| Param | Original file | Final file |
|---|---|---|
| Filename | modeM0/AS1C07_001T01_9000006454_51208cztM0_level2.fits | modeM0/AS1C07_001T01_9000006454_51208cztM0_level2_quad_clean.evt |
| Size (bytes) | 709,139,520 | 92,928,960 |
| Size | 676.3 MB | 88.6 MB |
| Events in quadrant A | 4,136,879 | 647,500 |
| Events in quadrant B | 6,878,571 | 571,746 |
| Events in quadrant C | 8,686,260 | 522,431 |
| Events in quadrant D | 5,997,638 | 576,712 |
| Mode M0 | |||
|---|---|---|---|
| Quadrant | BADHDUFLAG | Total packets | Discarded packets |
| A | 0 | 17364 | 1 |
| B | 0 | 25393 | 1 |
| C | 0 | 30791 | 1 |
| D | 0 | 22935 | 1 |
| Mode SS | |||
|---|---|---|---|
| Quadrant | BADHDUFLAG | Total packets | Discarded packets |
| A | 0 | 144 | 0 |
| B | 0 | 144 | 0 |
| C | 0 | 144 | 0 |
| D | 0 | 144 | 0 |
| Mode M9 | |||
|---|---|---|---|
| Quadrant | BADHDUFLAG | Total packets | Discarded packets |
| A | 0 | 1 | 0 |
| B | 0 | 1 | 0 |
| C | 0 | 1 | 0 |
| D | 0 | 1 | 0 |
| Quadrant | Total seconds | Saturated seconds | Saturation percentage |
|---|---|---|---|
| A | 7110 | 148 | 2.081575% |
| B | 7110 | 1619 | 22.770745% |
| C | 7110 | 1568 | 22.053446% |
| D | 7110 | 409 | 5.752461% |
Noise dominated data is calculated using 1-second bins in cleaned event files. If a bin has >2000 counts, and if more than 50% of those come from <1% of pixels, then it is considered to be noise-dominated and hence unusable.
| Quadrant | # 1 sec bins | Bins with >0 counts | Bins with >2000 counts | High rate bins dominated by noise | Noise dominated (total time) | Noise dominated (detector-on time) | Marked lightcurve |
|---|---|---|---|---|---|---|---|
| A | 7190 | 7111 | 69 | 69 | 0.96% | 0.97% | 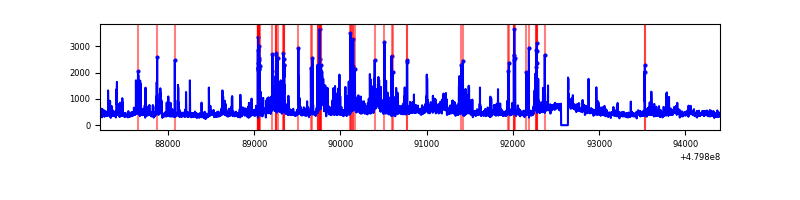 |
| B | 7190 | 7111 | 968 | 968 | 13.46% | 13.61% | 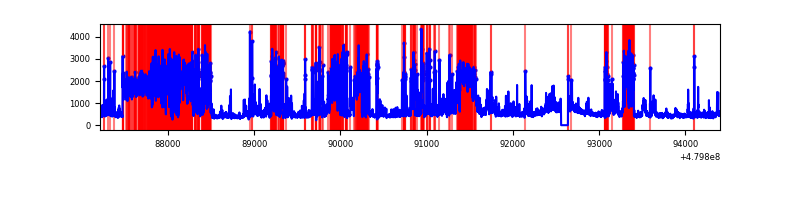 |
| C | 7190 | 7111 | 1340 | 1340 | 18.64% | 18.84% | 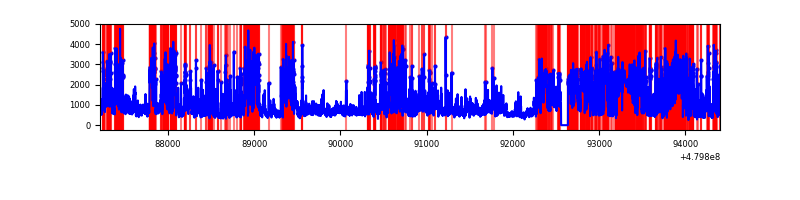 |
| D | 7190 | 7111 | 400 | 400 | 5.56% | 5.63% | 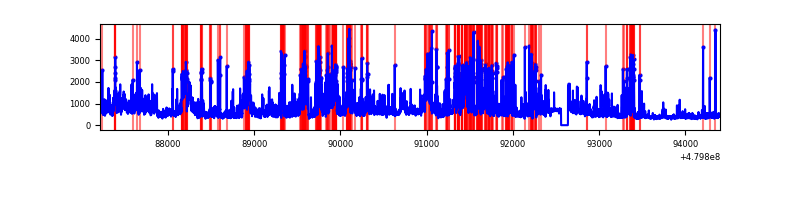 |
Top three noisy pixels from each quadrant. If the there are fewer than three noisy pixels in the level2.evt file, extra rows are filled as -1
| Pixel properties | Quadrant properties | ||||||
|---|---|---|---|---|---|---|---|
| Quadrant | DetID | PixID | Counts | Sigma | Mean | Median | Sigma |
| A | 3 | 130 | 203501 | 1092.13 | 746 | 728 | 185.7 |
| A | 13 | 248 | 160802 | 862.16 | 746 | 728 | 185.7 |
| A | 9 | 160 | 120884 | 647.16 | 746 | 728 | 185.7 |
| B | 12 | 32 | 2064912 | 14549.51 | 660 | 635 | 141.9 |
| B | 5 | 172 | 1289642 | 9085.23 | 660 | 635 | 141.9 |
| B | 8 | 128 | 184706 | 1297.38 | 660 | 635 | 141.9 |
| C | 4 | 12 | 2708982 | 14984.2 | 656 | 653 | 180.7 |
| C | 10 | 171 | 1233749 | 6822.27 | 656 | 653 | 180.7 |
| C | 9 | 38 | 892760 | 4935.7 | 656 | 653 | 180.7 |
| D | 2 | 62 | 1059709 | 5337.03 | 702 | 677 | 198.4 |
| D | 3 | 12 | 762444 | 3838.95 | 702 | 677 | 198.4 |
| D | 8 | 176 | 305794 | 1537.65 | 702 | 677 | 198.4 |
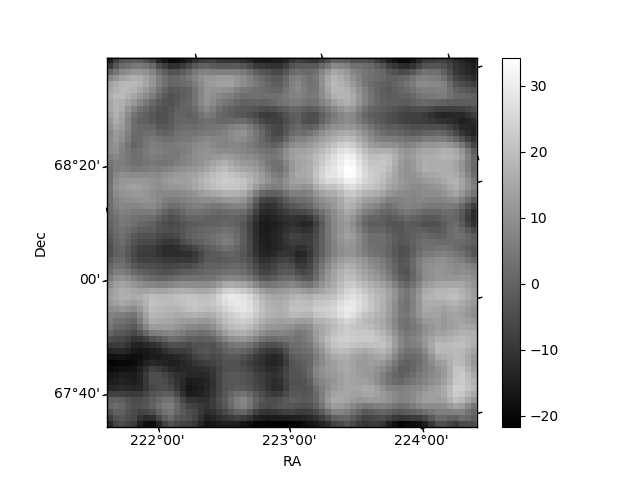
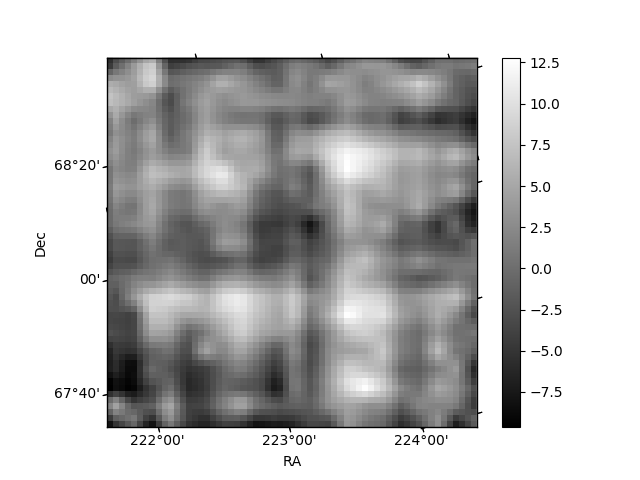
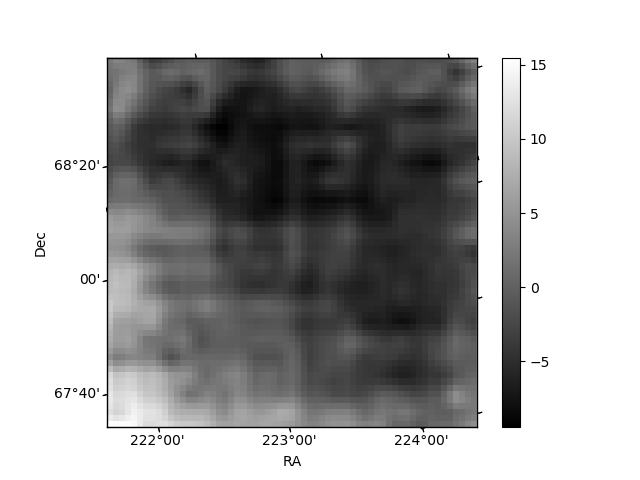
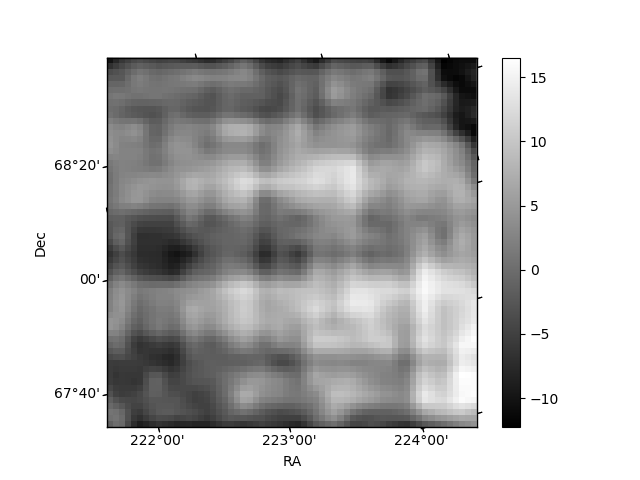
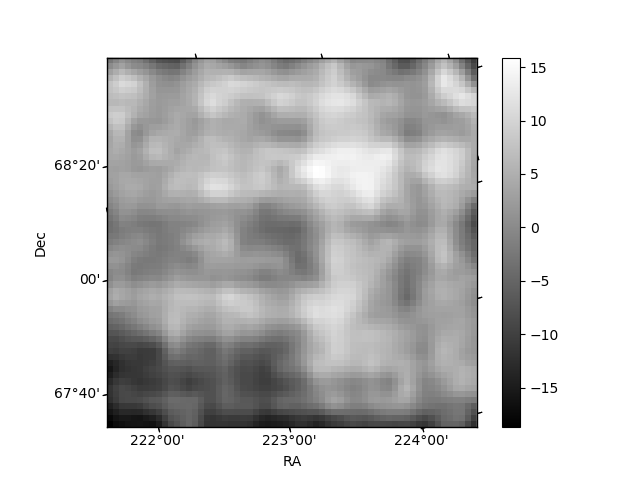
Histogram calculated using DETX and DETY for each event in the final _common_clean file
| Quadrant A | 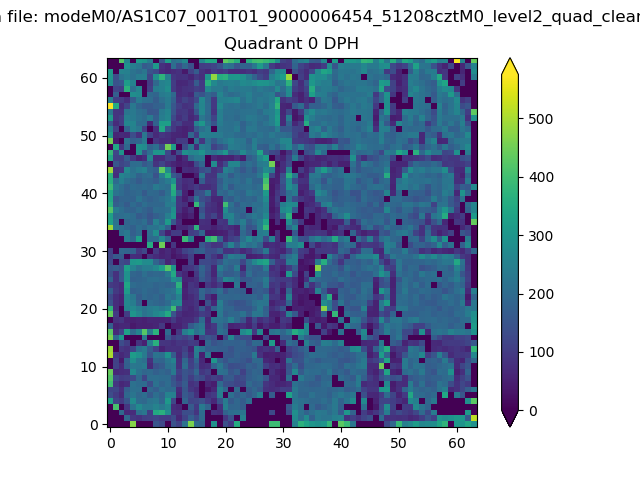 |
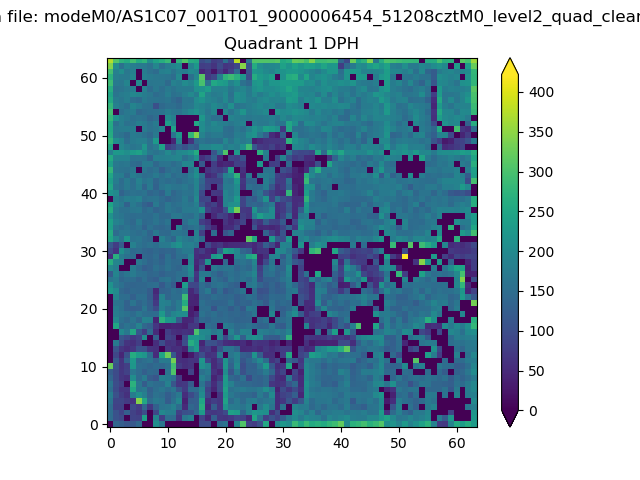 |
Quadrant B |
|---|---|---|---|
| Quadrant D |  |
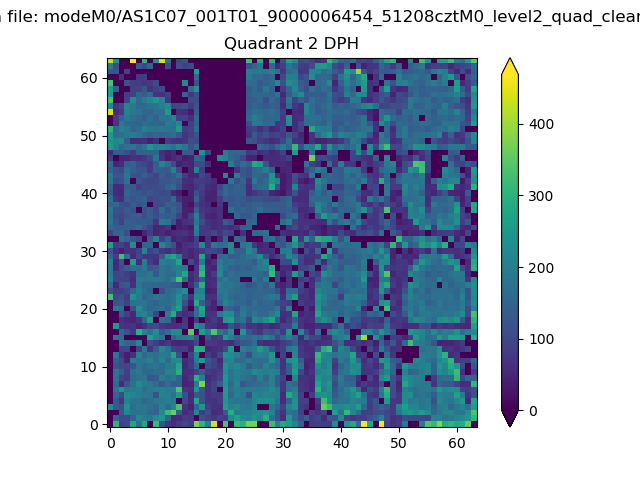 |
Quadrant C |
| Plot type | Count rate plots | Images |
|---|---|---|
| Comparison with Poisson distribution Blue bars denote a histogram of data divided into 1 sec bins. Red curve is a Poisson curve with rate = median count rate of data. |
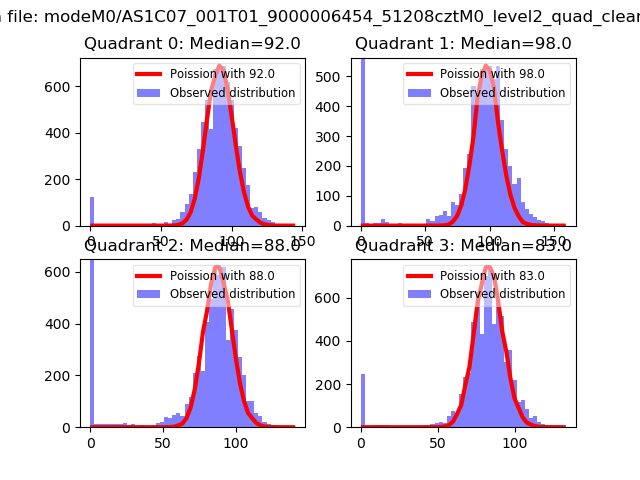 |
 |
| Quadrant-wise count rates Data is divided into 100 sec bins |
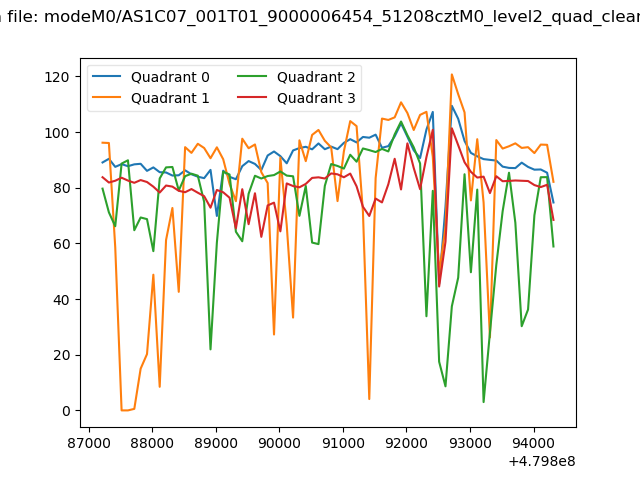 |
|
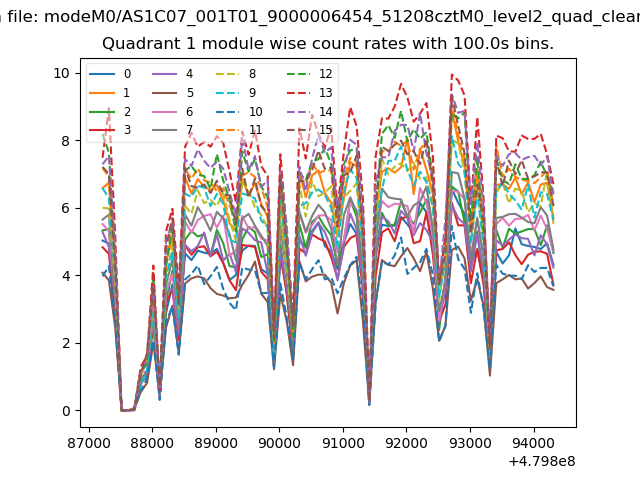
| Module-wise count rates for Quadrant A Data is divided into 100 sec bins |
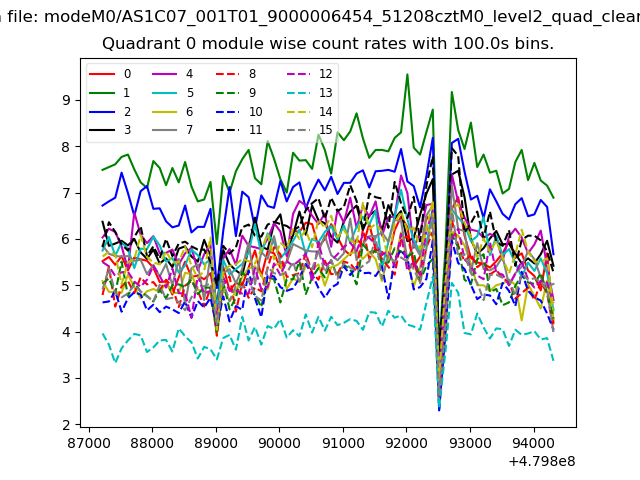 |
 |
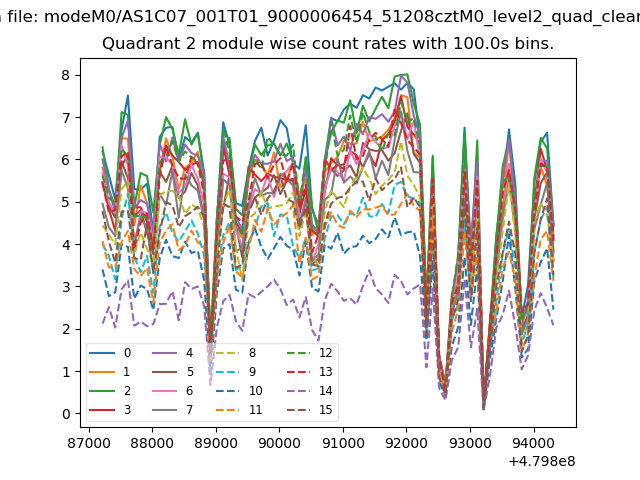
| Module-wise count rates for Quadrant B Data is divided into 100 sec bins |
 |
 |
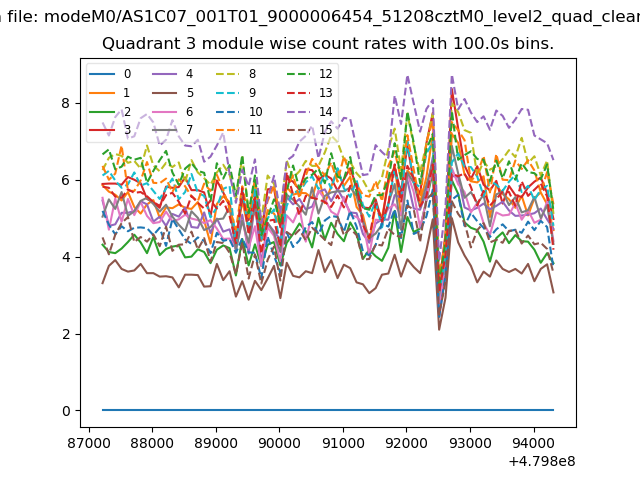
| Module-wise count rates for Quadrant C Data is divided into 100 sec bins |
 |
 |
| Module-wise count rates for Quadrant D Data is divided into 100 sec bins |
 |
 |
| Parameter | Plot |
|---|---|
| CZT HV Monitor |  |
| D_VDD | 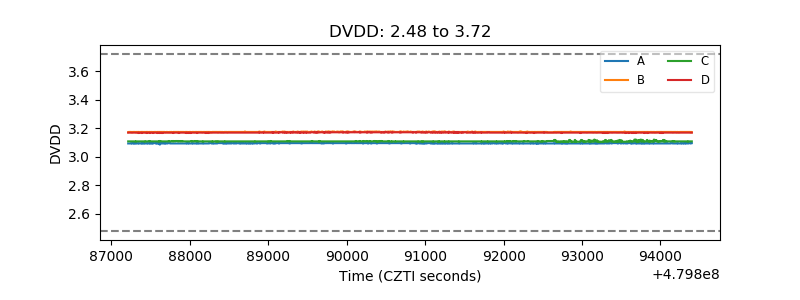 |
| Temperature 1 | 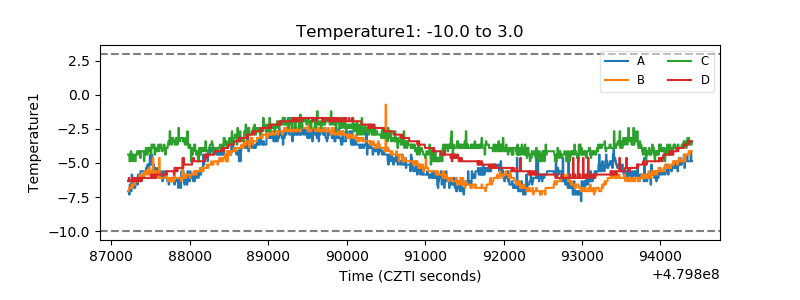 |
| Veto HV Monitor | 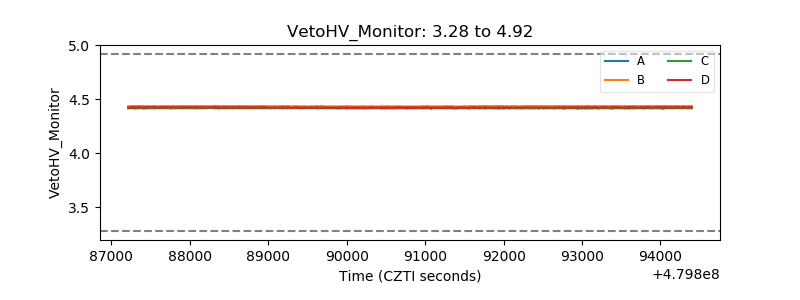 |
| Veto LLD | 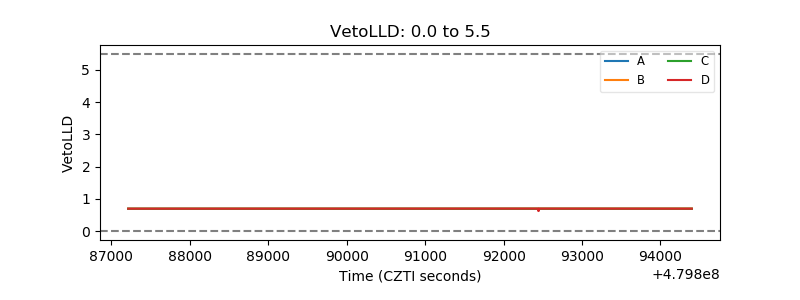 |
| Alpha Counter | 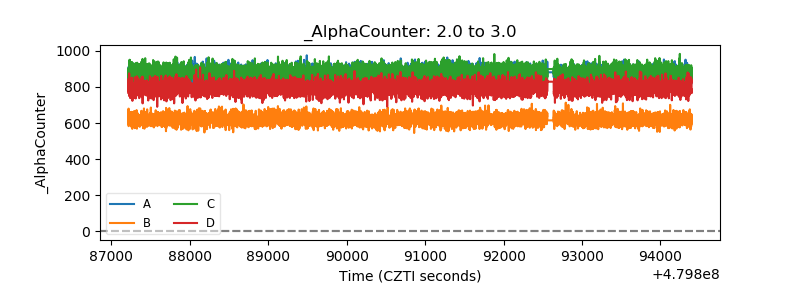 |
| _CPM_Rate | 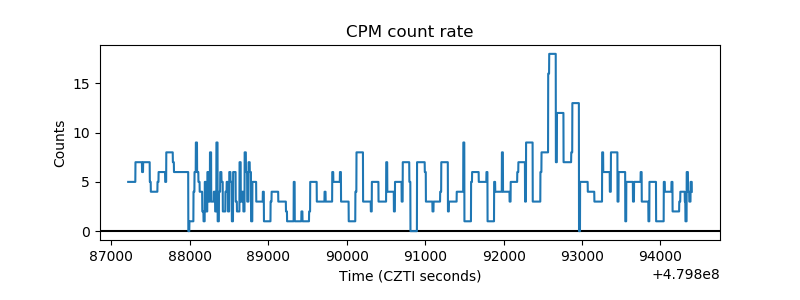 |
| CZT Counter | 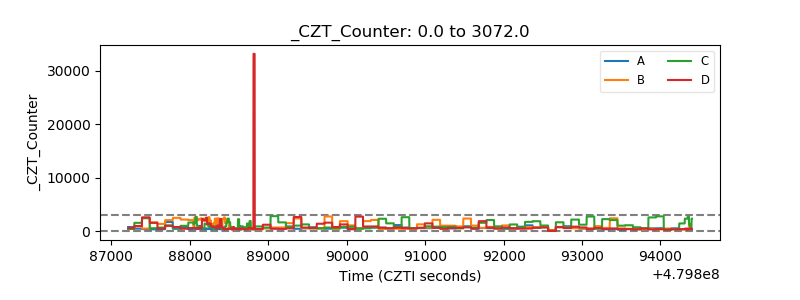 |
| +2.5 Volts monitor | 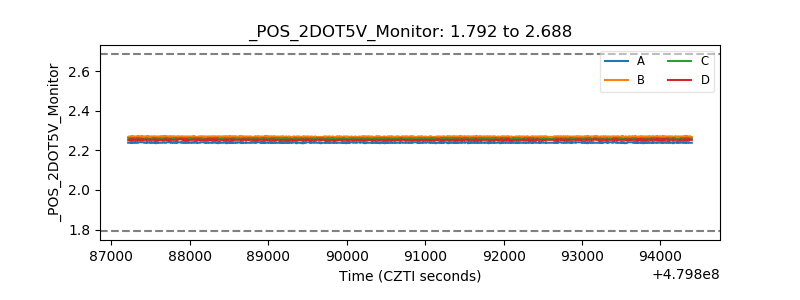 |
| +5 Volts monitor | 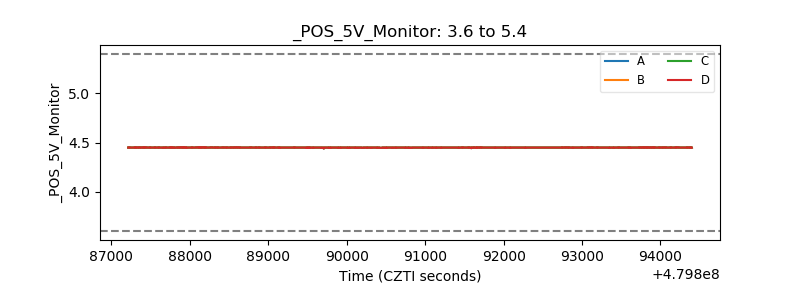 |
| _ROLL_ROT | 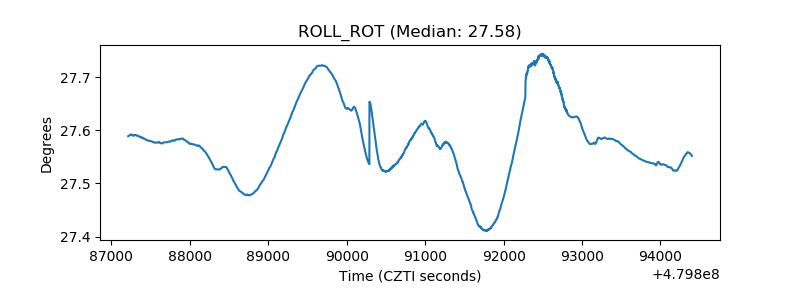 |
| _Roll_DEC | 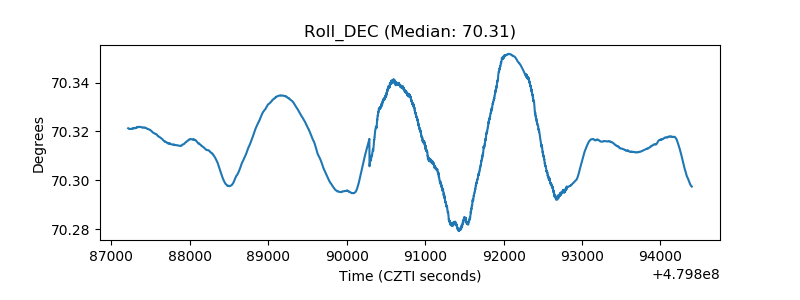 |
| _Roll_RA | 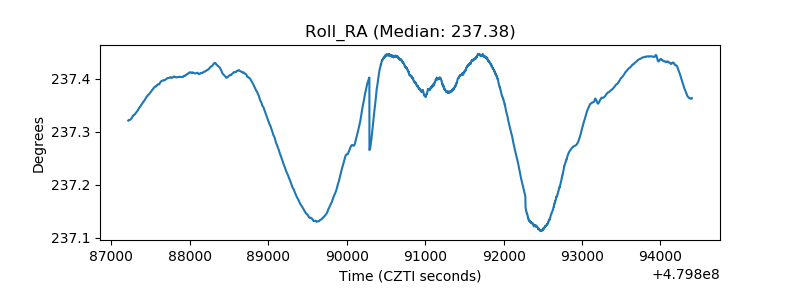 |
| Veto Counter | 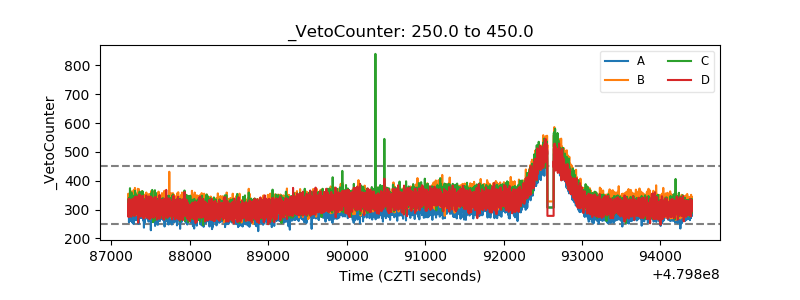 |