| Param | Original file | Final file |
|---|---|---|
| Filename | modeM0/AS1C07_001T01_9000006454_51209cztM0_level2.fits | modeM0/AS1C07_001T01_9000006454_51209cztM0_level2_quad_clean.evt |
| Size (bytes) | 720,907,200 | 103,993,920 |
| Size | 687.5 MB | 99.2 MB |
| Events in quadrant A | 4,444,389 | 691,154 |
| Events in quadrant B | 6,881,482 | 721,651 |
| Events in quadrant C | 8,456,115 | 589,223 |
| Events in quadrant D | 6,306,715 | 609,980 |
| Mode M0 | |||
|---|---|---|---|
| Quadrant | BADHDUFLAG | Total packets | Discarded packets |
| A | 0 | 18618 | 0 |
| B | 0 | 25795 | 0 |
| C | 0 | 30472 | 0 |
| D | 0 | 24277 | 0 |
| Mode SS | |||
|---|---|---|---|
| Quadrant | BADHDUFLAG | Total packets | Discarded packets |
| A | 0 | 154 | 0 |
| B | 0 | 154 | 0 |
| C | 0 | 154 | 0 |
| D | 0 | 154 | 0 |
| Quadrant | Total seconds | Saturated seconds | Saturation percentage |
|---|---|---|---|
| A | 7712 | 161 | 2.087656% |
| B | 7712 | 668 | 8.661826% |
| C | 7713 | 1401 | 18.164138% |
| D | 7713 | 560 | 7.260469% |
Noise dominated data is calculated using 1-second bins in cleaned event files. If a bin has >2000 counts, and if more than 50% of those come from <1% of pixels, then it is considered to be noise-dominated and hence unusable.
| Quadrant | # 1 sec bins | Bins with >0 counts | Bins with >2000 counts | High rate bins dominated by noise | Noise dominated (total time) | Noise dominated (detector-on time) | Marked lightcurve |
|---|---|---|---|---|---|---|---|
| A | 7712 | 7712 | 114 | 114 | 1.48% | 1.48% | 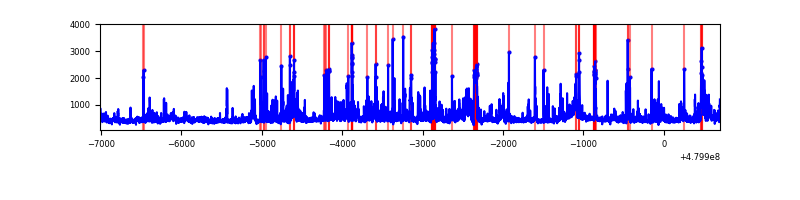 |
| B | 7712 | 7712 | 420 | 420 | 5.45% | 5.45% | 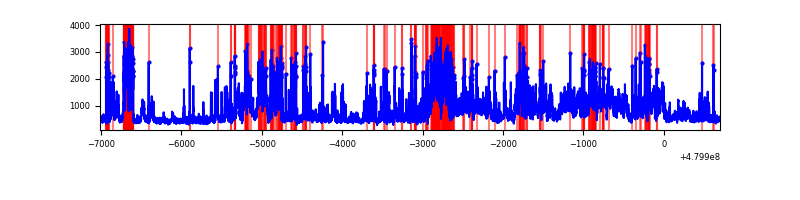 |
| C | 7713 | 7713 | 1346 | 1346 | 17.45% | 17.45% | 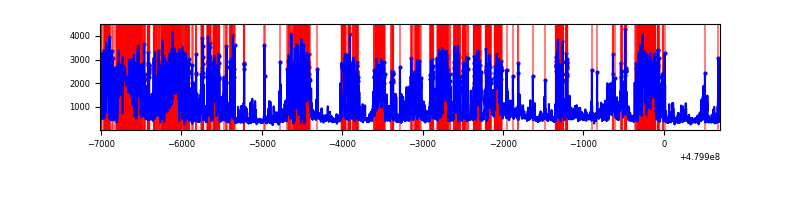 |
| D | 7713 | 7713 | 552 | 552 | 7.16% | 7.16% | 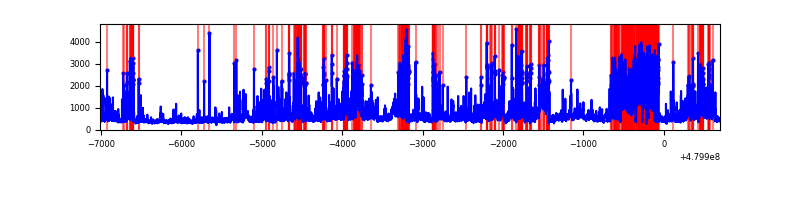 |
Top three noisy pixels from each quadrant. If the there are fewer than three noisy pixels in the level2.evt file, extra rows are filled as -1
| Pixel properties | Quadrant properties | ||||||
|---|---|---|---|---|---|---|---|
| Quadrant | DetID | PixID | Counts | Sigma | Mean | Median | Sigma |
| A | 12 | 3 | 300143 | 1548.17 | 783 | 763 | 193.4 |
| A | 13 | 248 | 229833 | 1184.58 | 783 | 763 | 193.4 |
| A | 12 | 250 | 140506 | 722.65 | 783 | 763 | 193.4 |
| B | 10 | 254 | 1240718 | 7572.87 | 769 | 742 | 163.7 |
| B | 5 | 172 | 1168394 | 7131.17 | 769 | 742 | 163.7 |
| B | 8 | 128 | 331618 | 2020.75 | 769 | 742 | 163.7 |
| C | 4 | 12 | 3138274 | 15845.7 | 717 | 711 | 198.0 |
| C | 9 | 38 | 672249 | 3391.48 | 717 | 711 | 198.0 |
| C | 4 | 13 | 393007 | 1981.22 | 717 | 711 | 198.0 |
| D | 2 | 62 | 1091749 | 5190.85 | 739 | 711 | 210.2 |
| D | 3 | 12 | 1091358 | 5188.99 | 739 | 711 | 210.2 |
| D | 11 | 176 | 227702 | 1079.96 | 739 | 711 | 210.2 |
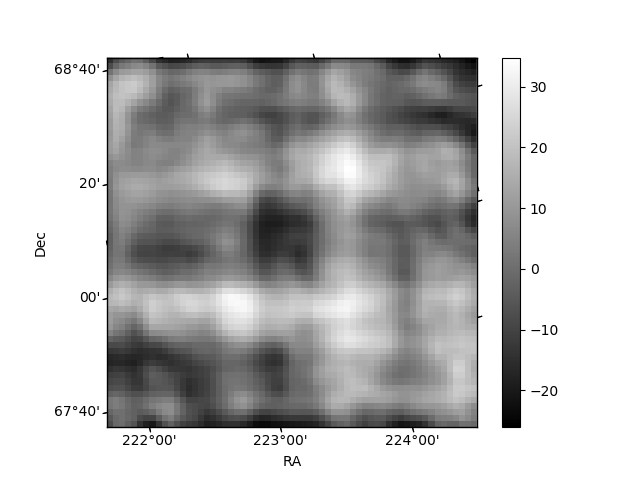
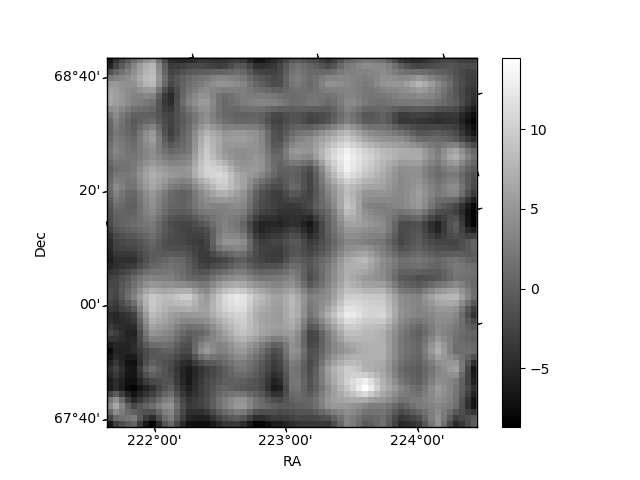
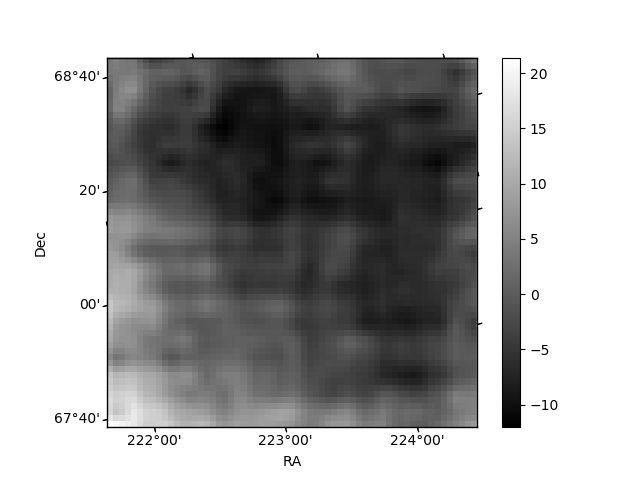
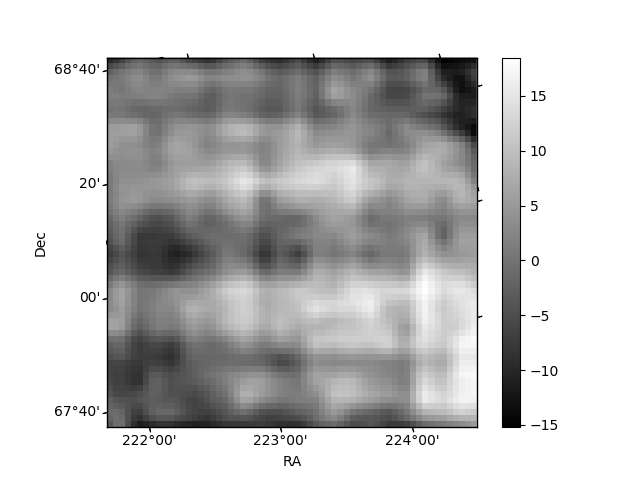
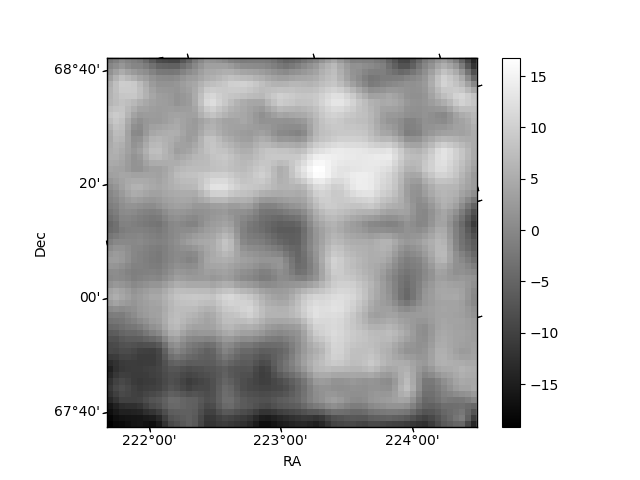
Histogram calculated using DETX and DETY for each event in the final _common_clean file
| Quadrant A | 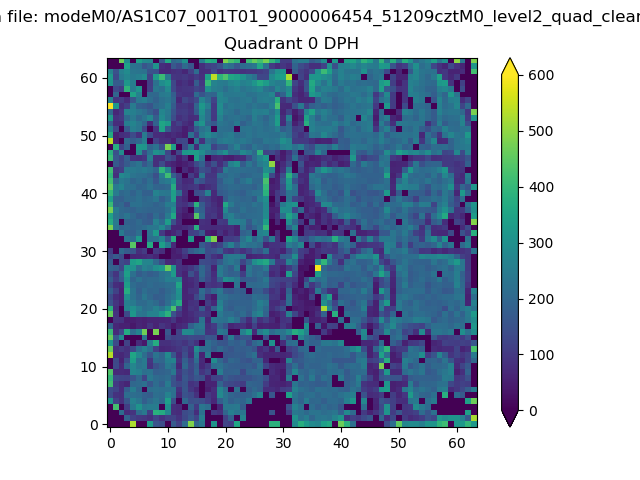 |
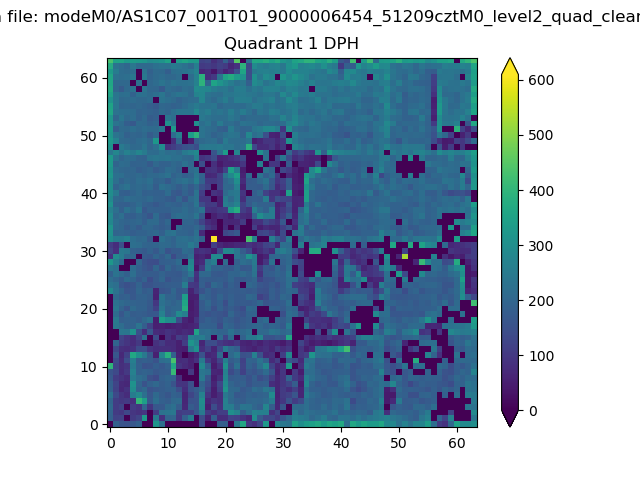 |
Quadrant B |
|---|---|---|---|
| Quadrant D | 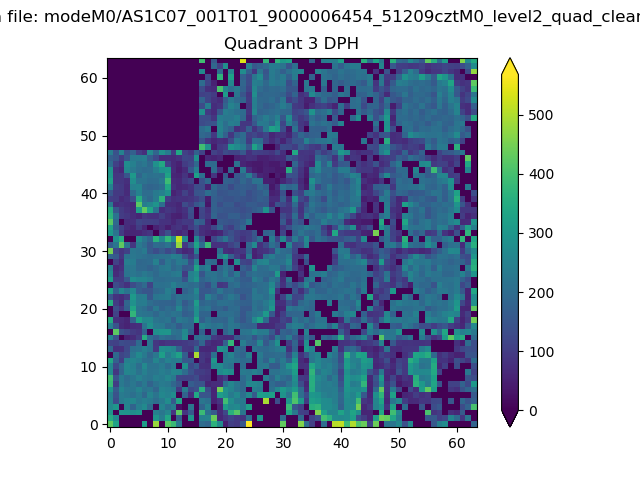 |
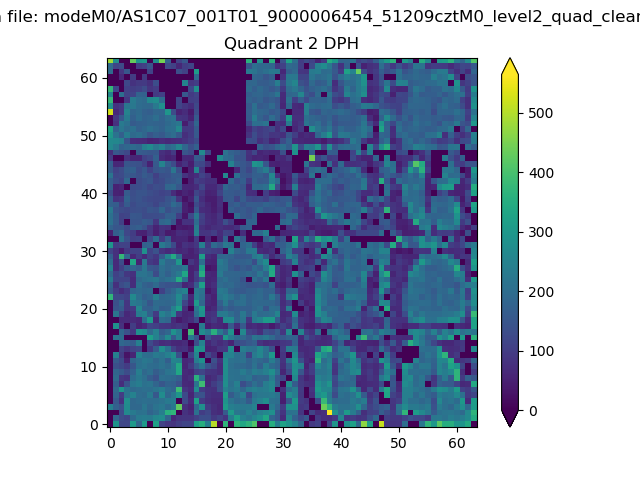 |
Quadrant C |
| Plot type | Count rate plots | Images |
|---|---|---|
| Comparison with Poisson distribution Blue bars denote a histogram of data divided into 1 sec bins. Red curve is a Poisson curve with rate = median count rate of data. |
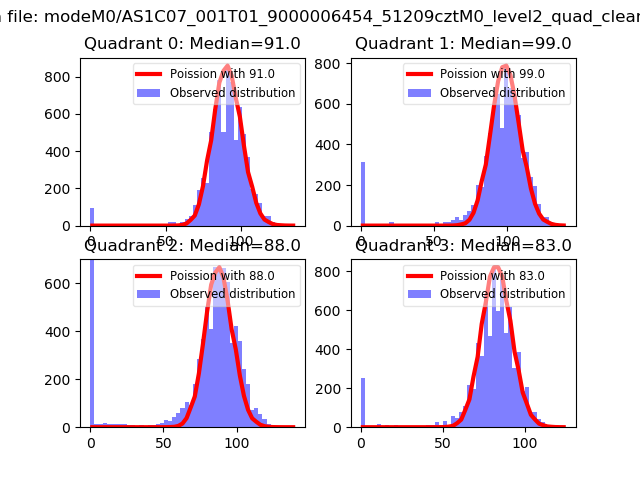 |
 |
| Quadrant-wise count rates Data is divided into 100 sec bins |
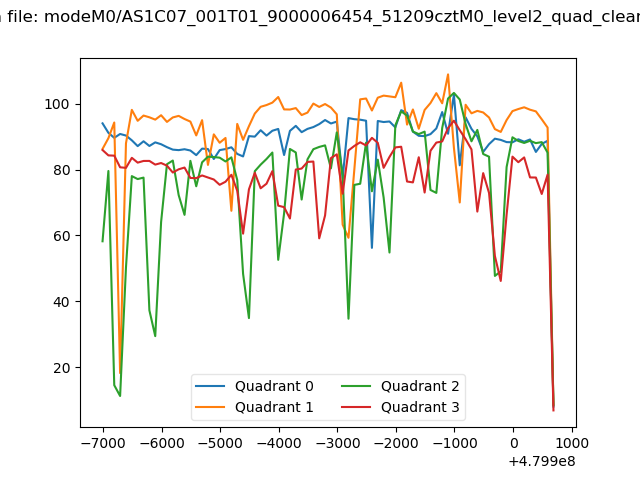 |
|
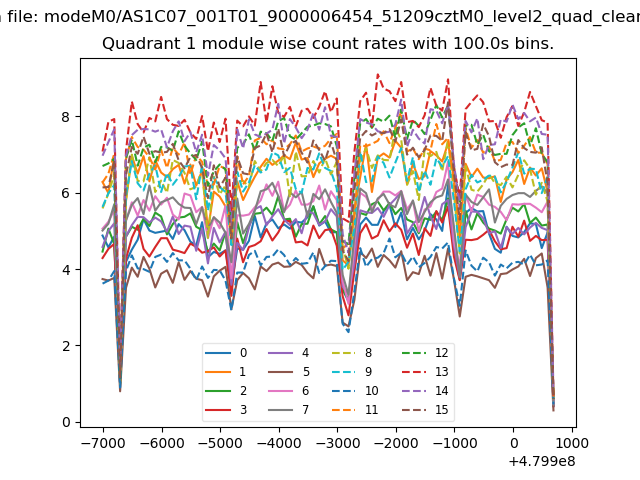
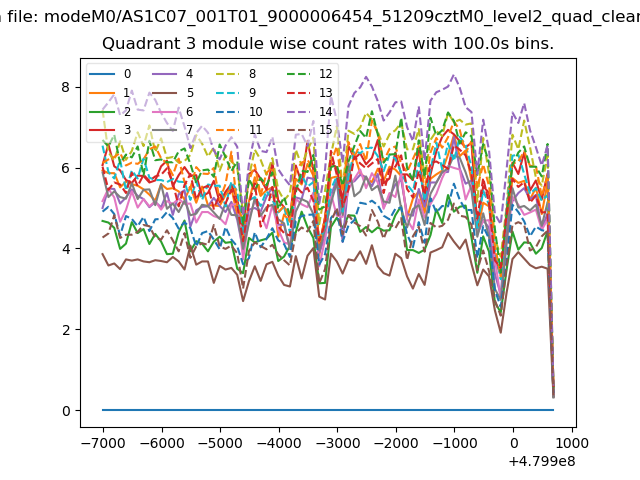
| Module-wise count rates for Quadrant A Data is divided into 100 sec bins |
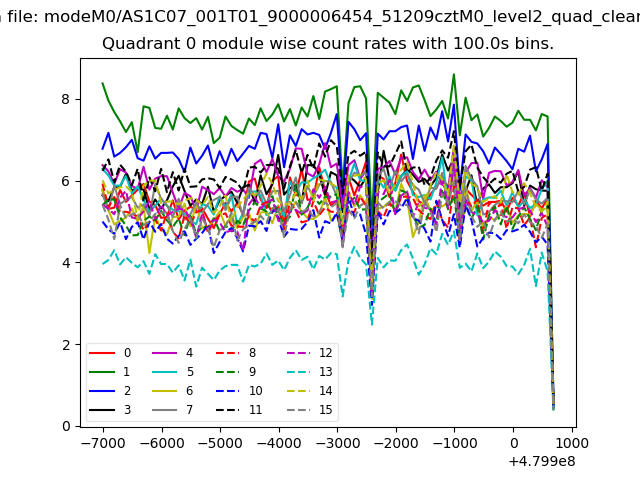 |
 |
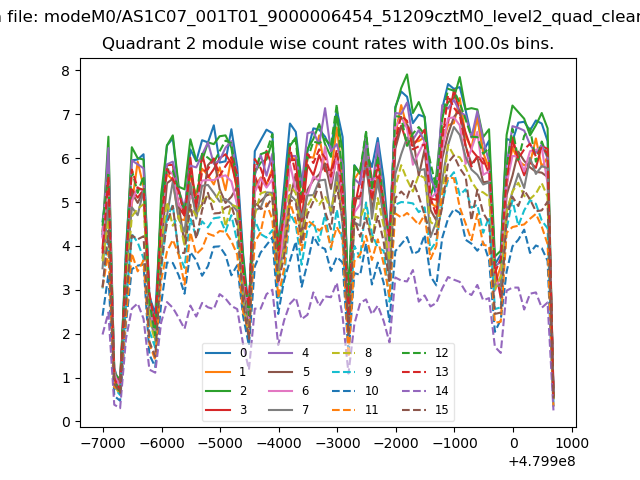
| Module-wise count rates for Quadrant B Data is divided into 100 sec bins |
 |
 |
| Module-wise count rates for Quadrant C Data is divided into 100 sec bins |
 |
 |
| Module-wise count rates for Quadrant D Data is divided into 100 sec bins |
 |
 |
| Parameter | Plot |
|---|---|
| CZT HV Monitor |  |
| D_VDD | 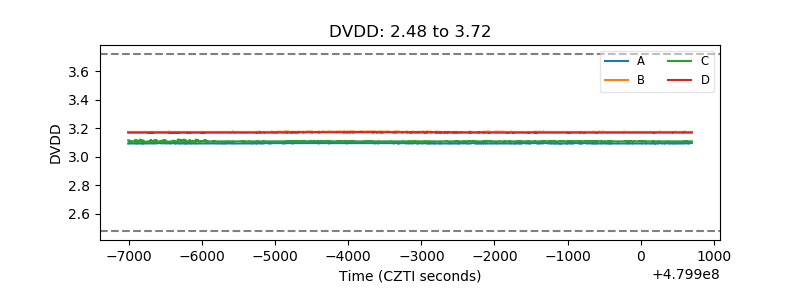 |
| Temperature 1 | 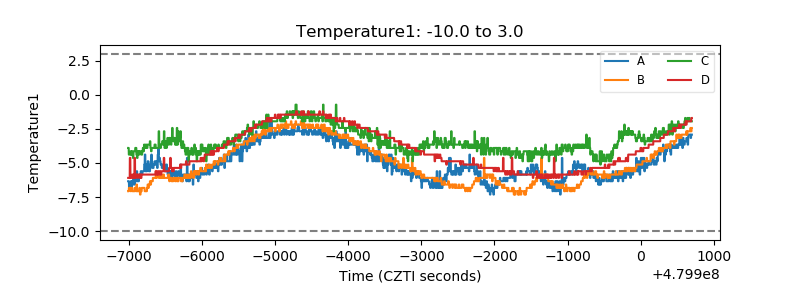 |
| Veto HV Monitor | 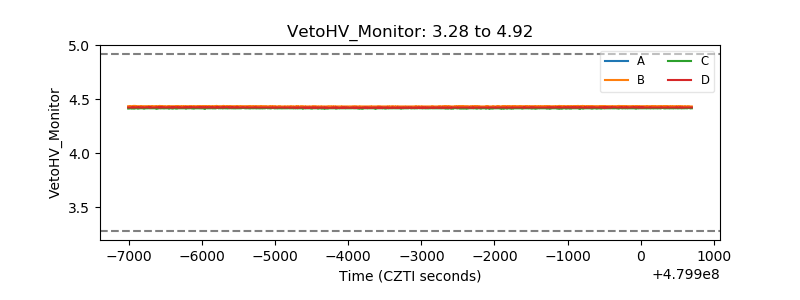 |
| Veto LLD | 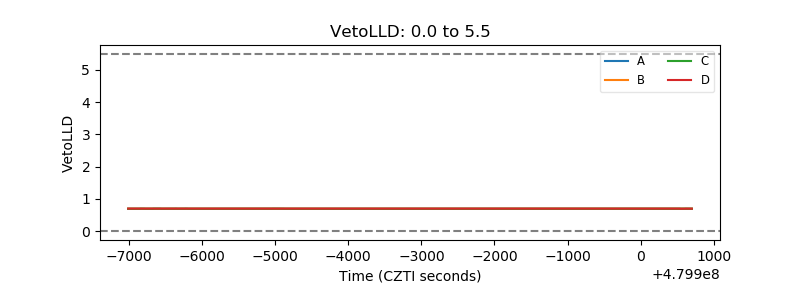 |
| Alpha Counter | 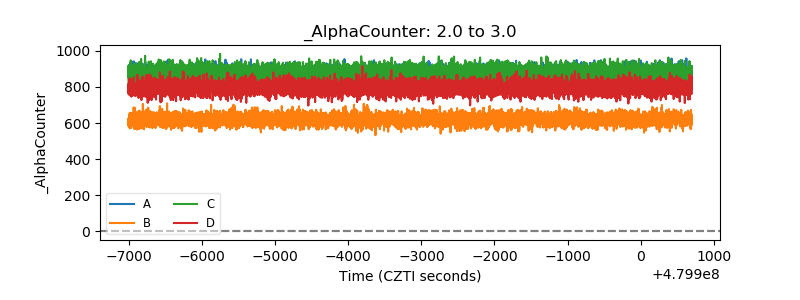 |
| _CPM_Rate | 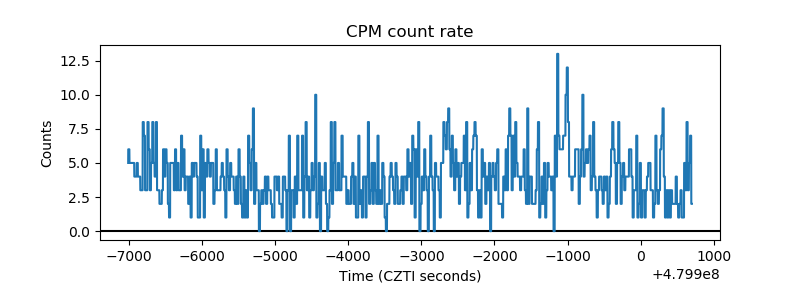 |
| CZT Counter | 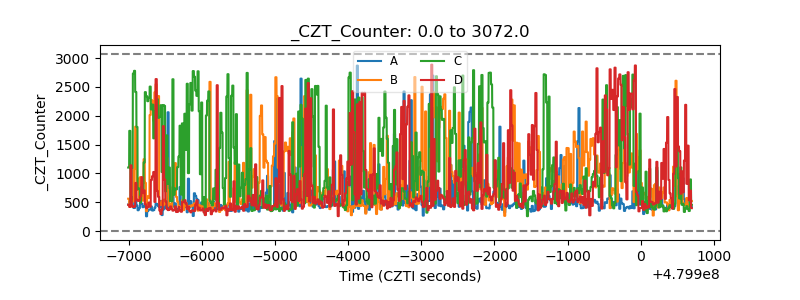 |
| +2.5 Volts monitor | 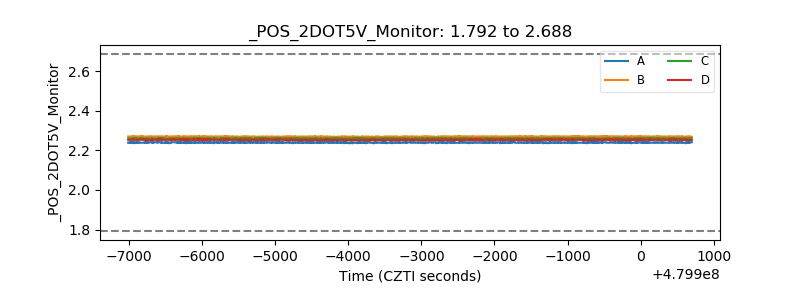 |
| +5 Volts monitor | 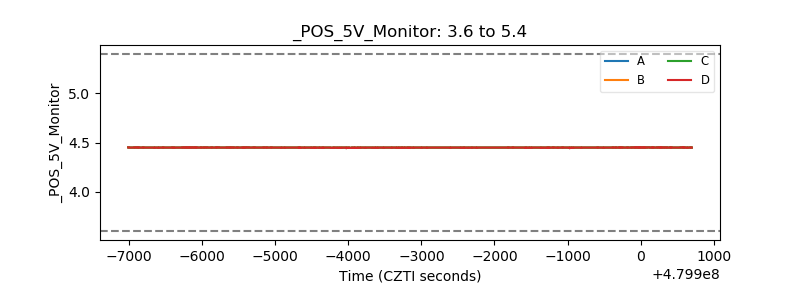 |
| _ROLL_ROT | 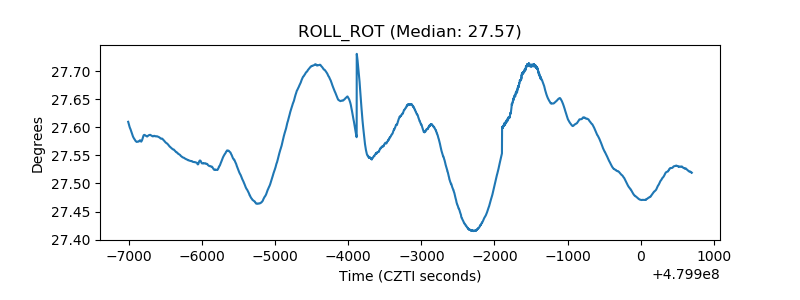 |
| _Roll_DEC | 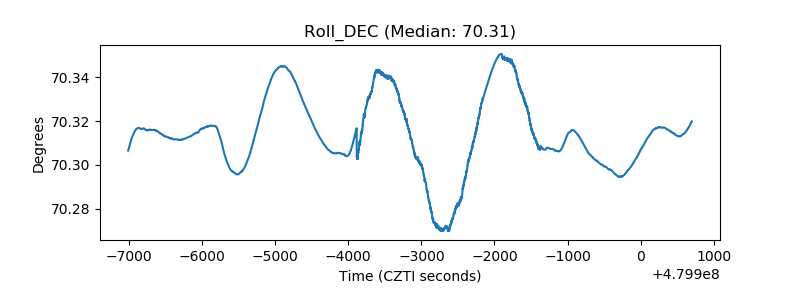 |
| _Roll_RA | 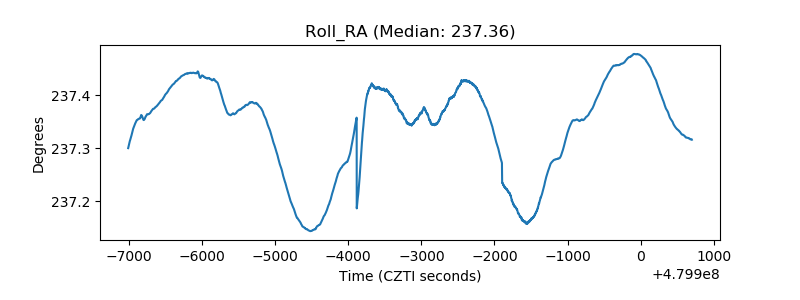 |
| Veto Counter | 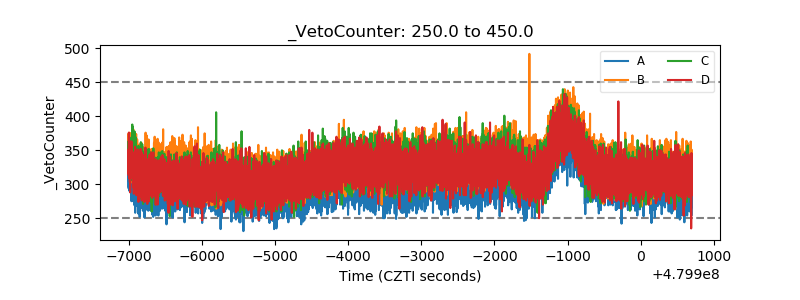 |