| Param | Original file | Final file |
|---|---|---|
| Filename | modeM0/AS1C07_001T01_9000006454_51210cztM0_level2.fits | modeM0/AS1C07_001T01_9000006454_51210cztM0_level2_quad_clean.evt |
| Size (bytes) | 726,543,360 | 95,895,360 |
| Size | 692.9 MB | 91.5 MB |
| Events in quadrant A | 4,515,431 | 664,086 |
| Events in quadrant B | 6,728,446 | 643,598 |
| Events in quadrant C | 9,091,524 | 517,474 |
| Events in quadrant D | 5,987,943 | 565,016 |
| Mode M0 | |||
|---|---|---|---|
| Quadrant | BADHDUFLAG | Total packets | Discarded packets |
| A | 0 | 18481 | 0 |
| B | 0 | 24998 | 0 |
| C | 0 | 32115 | 0 |
| D | 0 | 22987 | 0 |
| Mode SS | |||
|---|---|---|---|
| Quadrant | BADHDUFLAG | Total packets | Discarded packets |
| A | 0 | 148 | 0 |
| B | 0 | 148 | 0 |
| C | 0 | 148 | 0 |
| D | 0 | 148 | 0 |
| Quadrant | Total seconds | Saturated seconds | Saturation percentage |
|---|---|---|---|
| A | 7370 | 168 | 2.279512% |
| B | 7370 | 1059 | 14.369064% |
| C | 7370 | 1813 | 24.599729% |
| D | 7370 | 713 | 9.674355% |
Noise dominated data is calculated using 1-second bins in cleaned event files. If a bin has >2000 counts, and if more than 50% of those come from <1% of pixels, then it is considered to be noise-dominated and hence unusable.
| Quadrant | # 1 sec bins | Bins with >0 counts | Bins with >2000 counts | High rate bins dominated by noise | Noise dominated (total time) | Noise dominated (detector-on time) | Marked lightcurve |
|---|---|---|---|---|---|---|---|
| A | 7370 | 7370 | 111 | 111 | 1.51% | 1.51% | 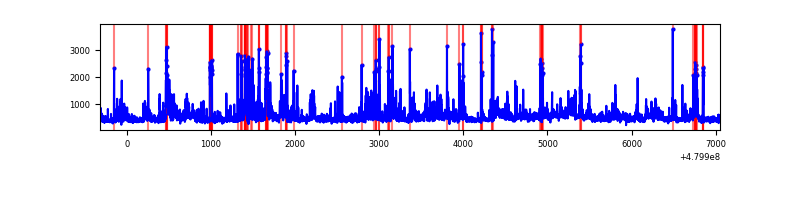 |
| B | 7370 | 7370 | 867 | 867 | 11.76% | 11.76% | 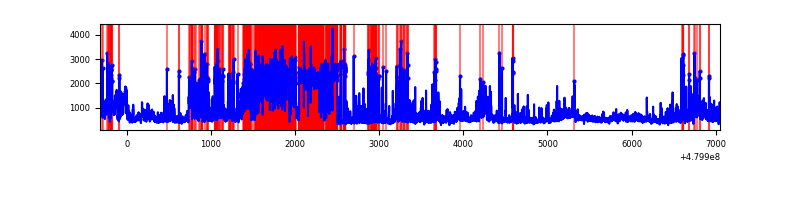 |
| C | 7370 | 7370 | 1640 | 1640 | 22.25% | 22.25% | 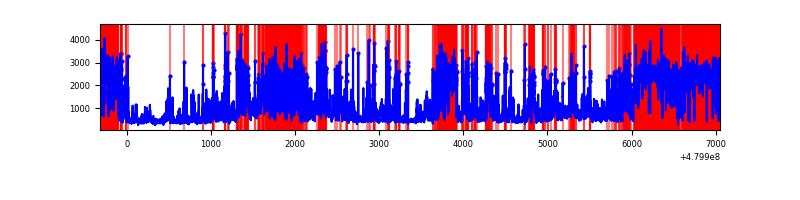 |
| D | 7370 | 7370 | 656 | 656 | 8.90% | 8.90% | 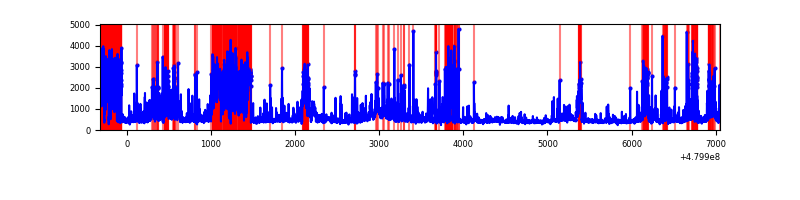 |
Top three noisy pixels from each quadrant. If the there are fewer than three noisy pixels in the level2.evt file, extra rows are filled as -1
| Pixel properties | Quadrant properties | ||||||
|---|---|---|---|---|---|---|---|
| Quadrant | DetID | PixID | Counts | Sigma | Mean | Median | Sigma |
| A | 12 | 3 | 485034 | 2574.72 | 759 | 740 | 188.1 |
| A | 13 | 248 | 126405 | 668.09 | 759 | 740 | 188.1 |
| A | 12 | 250 | 120833 | 638.47 | 759 | 740 | 188.1 |
| B | 5 | 172 | 2137813 | 13954.76 | 712 | 686 | 153.1 |
| B | 8 | 128 | 377874 | 2462.92 | 712 | 686 | 153.1 |
| B | 10 | 254 | 337118 | 2196.79 | 712 | 686 | 153.1 |
| C | 4 | 12 | 4172252 | 22653.74 | 675 | 670 | 184.1 |
| C | 4 | 13 | 768356 | 4168.91 | 675 | 670 | 184.1 |
| C | 15 | 158 | 542605 | 2942.97 | 675 | 670 | 184.1 |
| D | 2 | 62 | 1095198 | 5443.87 | 707 | 682 | 201.1 |
| D | 2 | 216 | 353550 | 1755.08 | 707 | 682 | 201.1 |
| D | 2 | 153 | 281009 | 1394.28 | 707 | 682 | 201.1 |
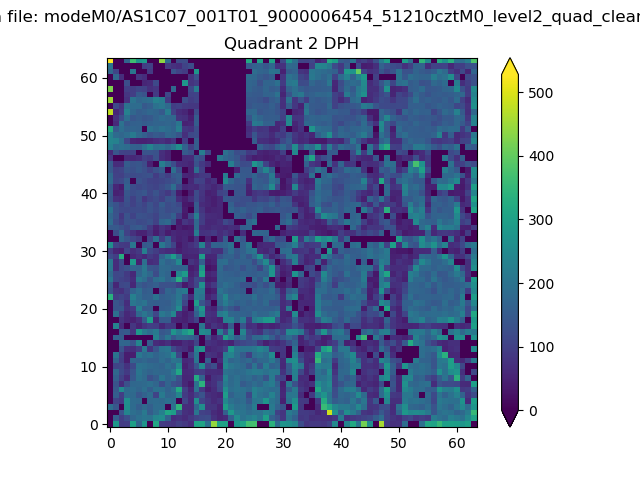
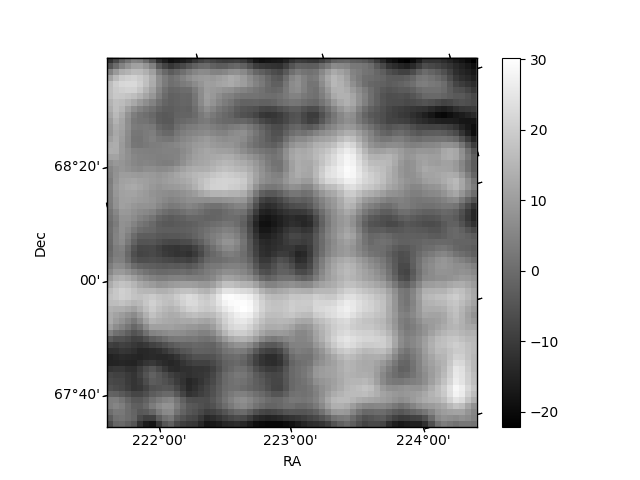
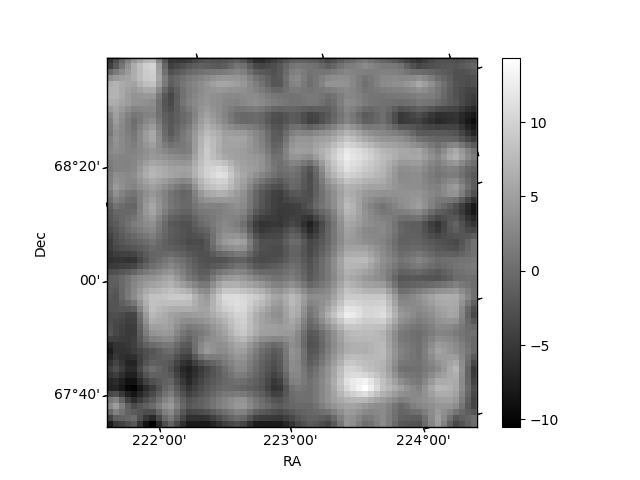
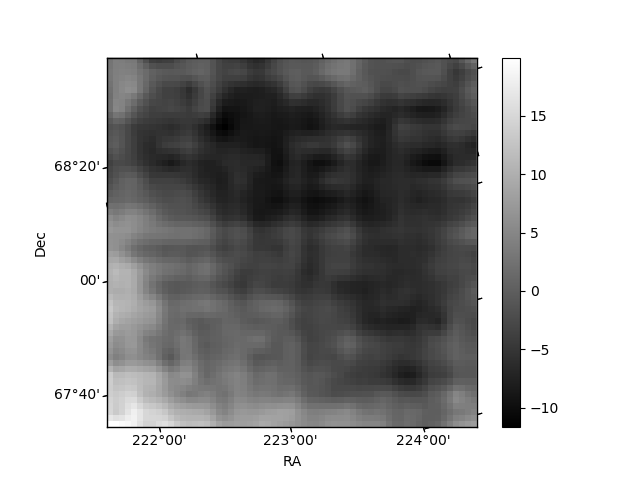
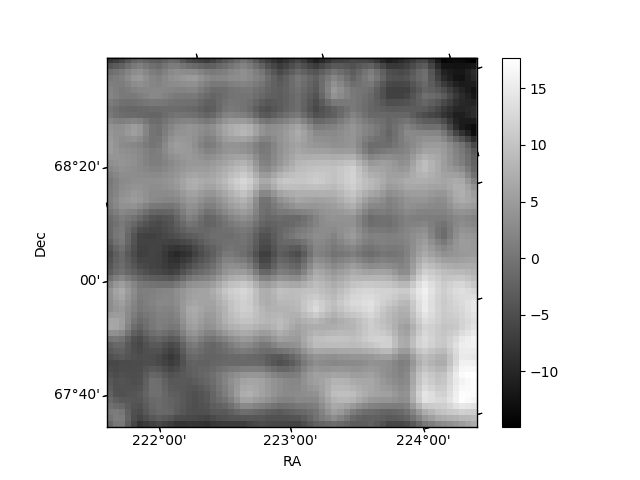
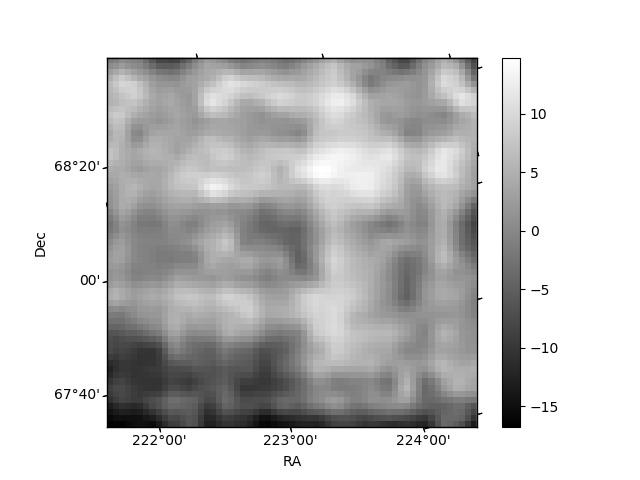
Histogram calculated using DETX and DETY for each event in the final _common_clean file
| Quadrant A | 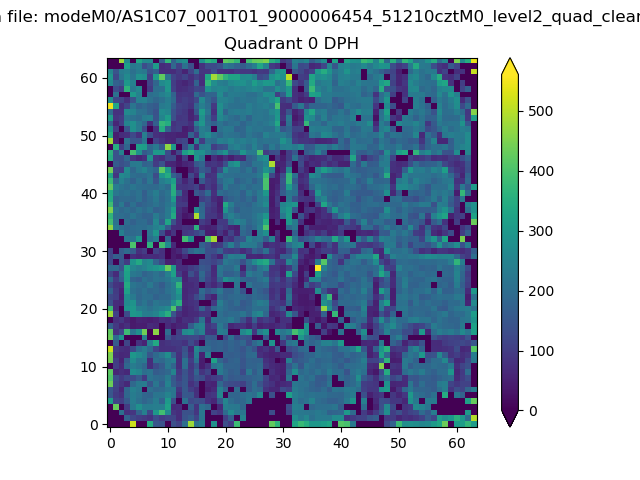 |
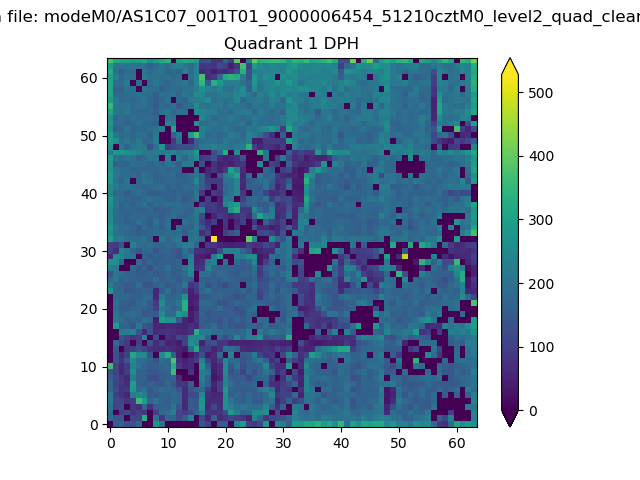 |
Quadrant B |
|---|---|---|---|
| Quadrant D | 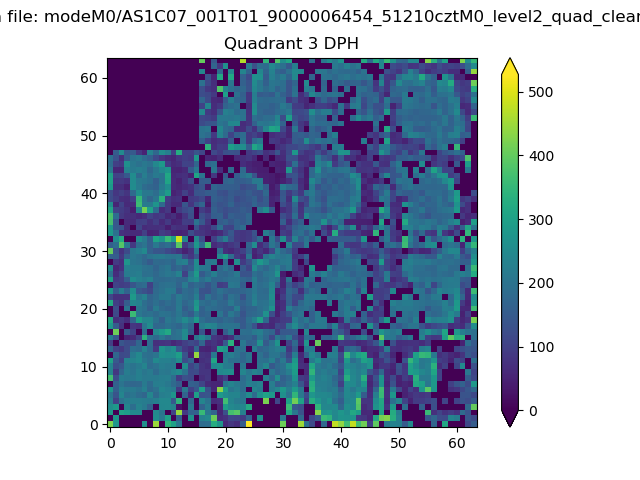 |
 |
Quadrant C |
| Plot type | Count rate plots | Images |
|---|---|---|
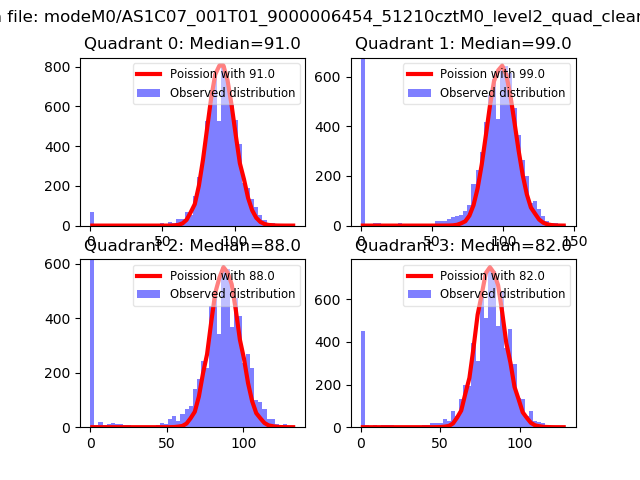
| Comparison with Poisson distribution Blue bars denote a histogram of data divided into 1 sec bins. Red curve is a Poisson curve with rate = median count rate of data. |
 |
 |
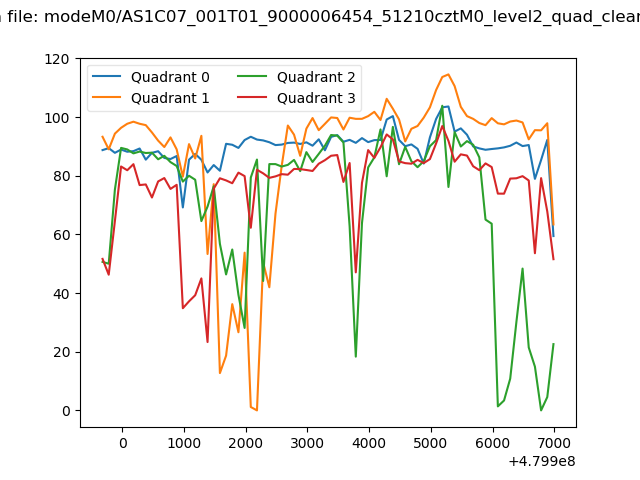
| Quadrant-wise count rates Data is divided into 100 sec bins |
 |
|
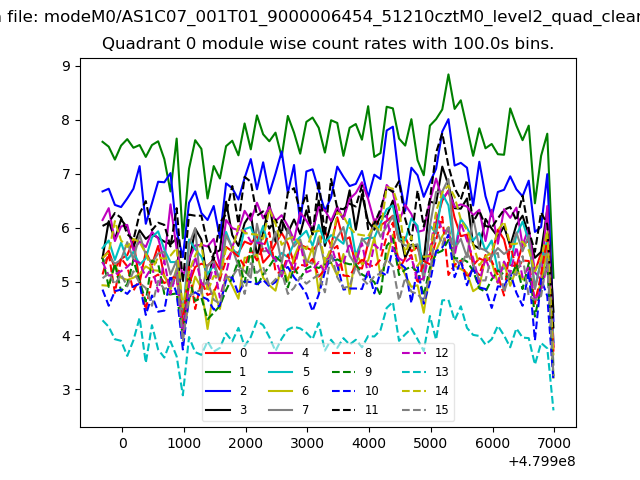
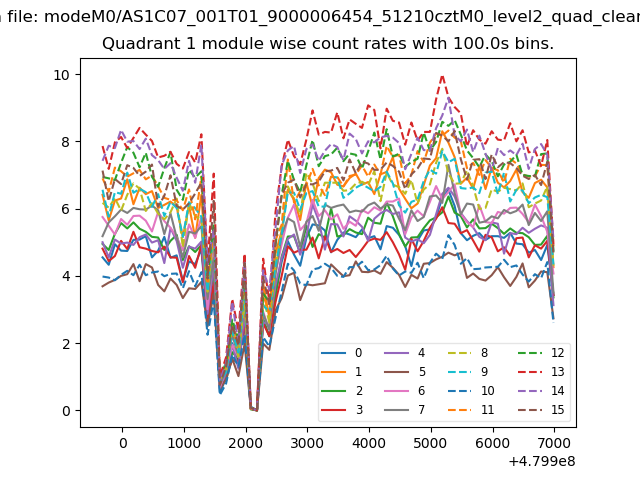
| Module-wise count rates for Quadrant A Data is divided into 100 sec bins |
 |
 |
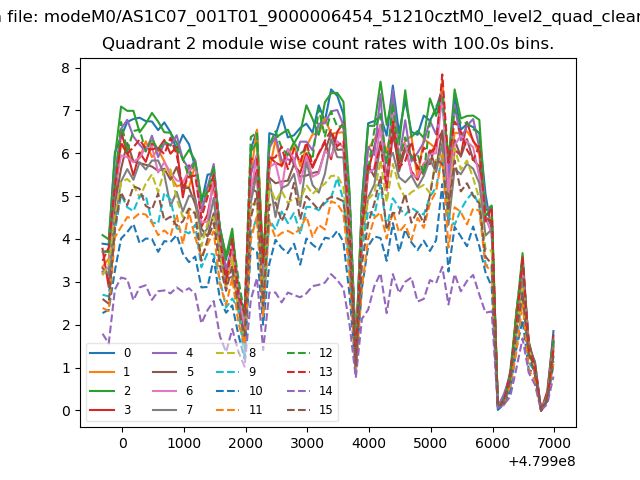
| Module-wise count rates for Quadrant B Data is divided into 100 sec bins |
 |
 |
| Module-wise count rates for Quadrant C Data is divided into 100 sec bins |
 |
 |
| Module-wise count rates for Quadrant D Data is divided into 100 sec bins |
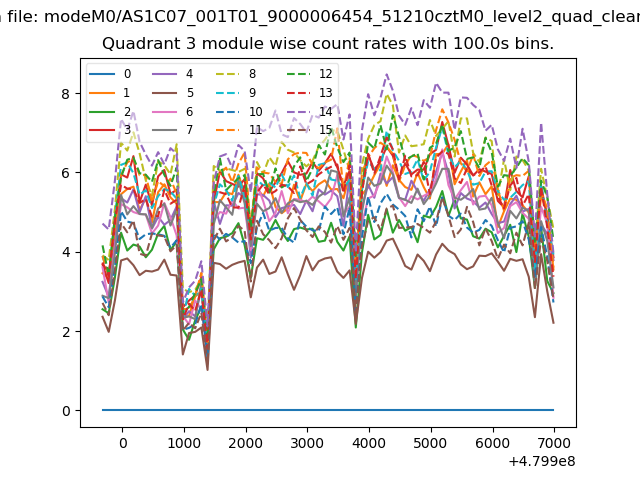 |
 |
| Parameter | Plot |
|---|---|
| CZT HV Monitor | 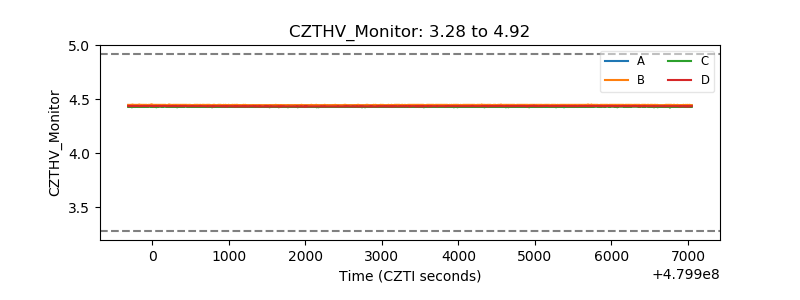 |
| D_VDD | 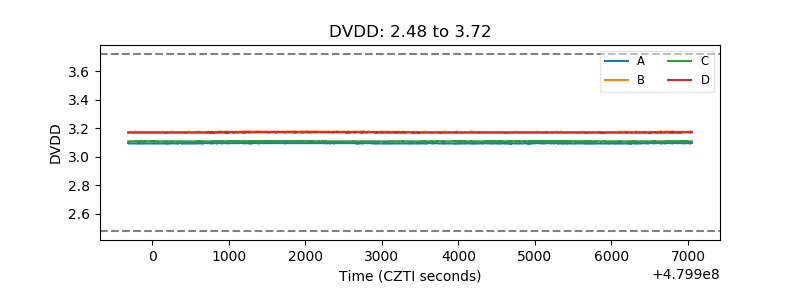 |
| Temperature 1 | 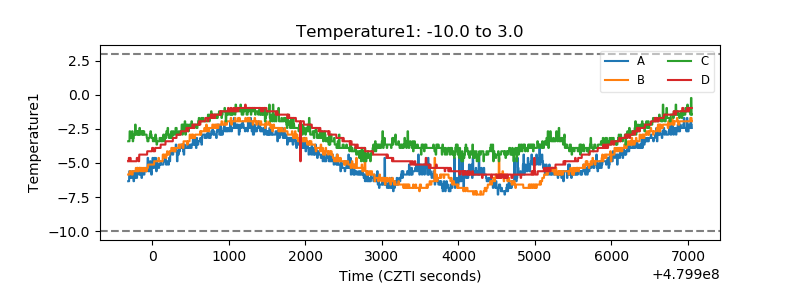 |
| Veto HV Monitor |  |
| Veto LLD | 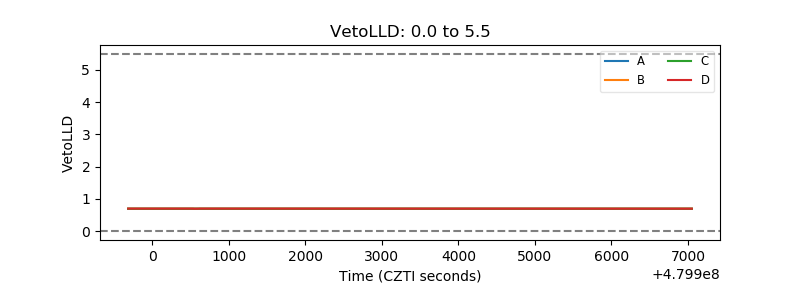 |
| Alpha Counter | 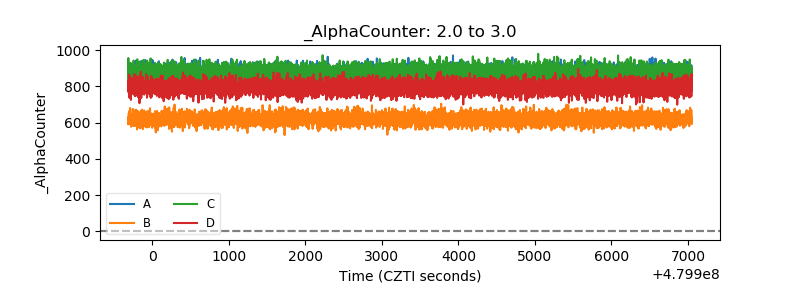 |
| _CPM_Rate | 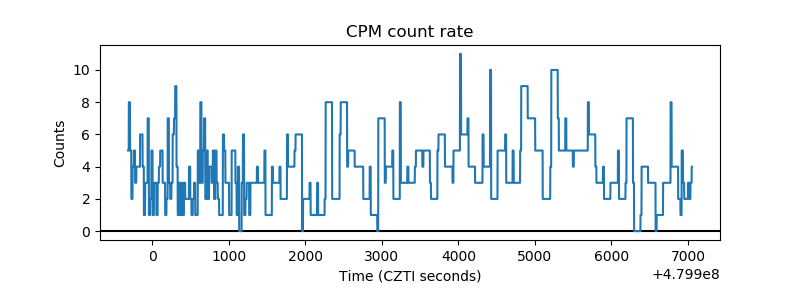 |
| CZT Counter | 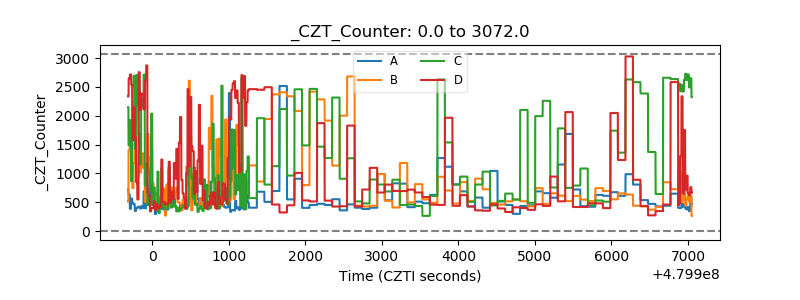 |
| +2.5 Volts monitor |  |
| +5 Volts monitor | 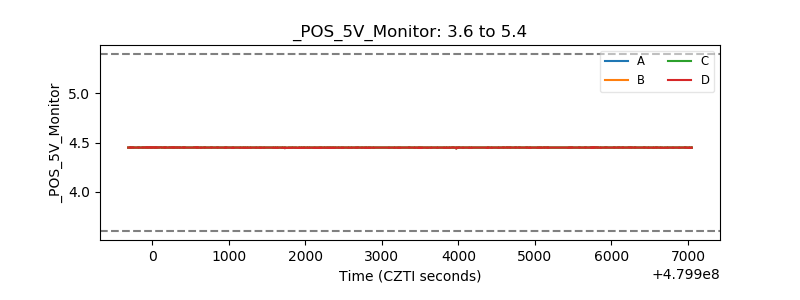 |
| _ROLL_ROT | 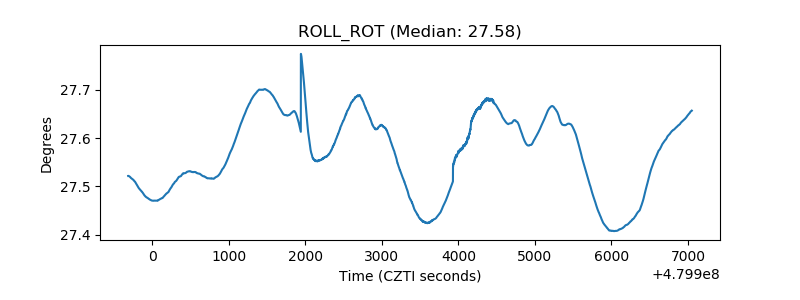 |
| _Roll_DEC | 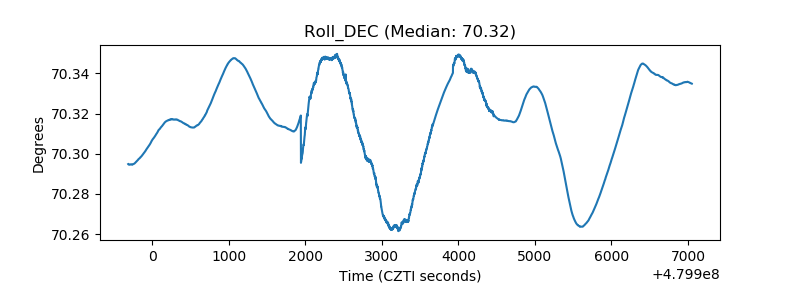 |
| _Roll_RA | 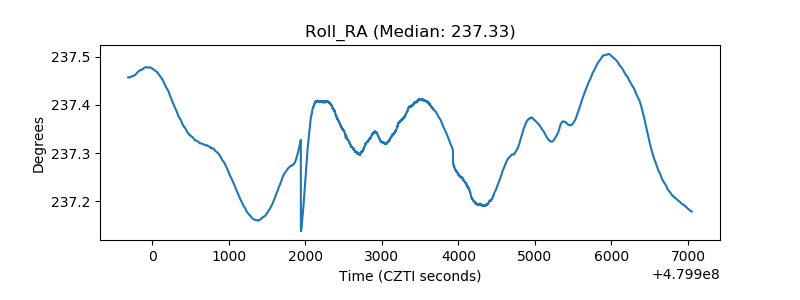 |
| Veto Counter | 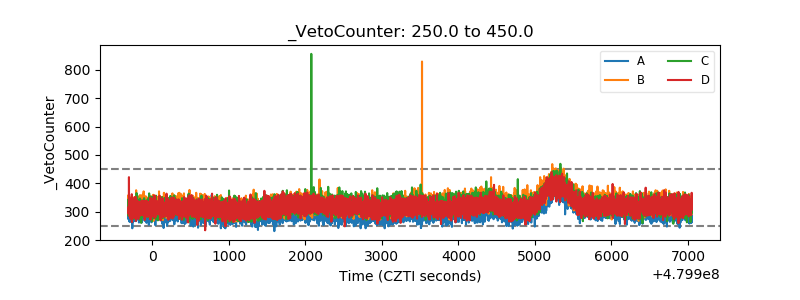 |