| Param | Original file | Final file |
|---|---|---|
| Filename | modeM0/AS1C07_001T01_9000006454_51213cztM0_level2.fits | modeM0/AS1C07_001T01_9000006454_51213cztM0_level2_quad_clean.evt |
| Size (bytes) | 2,212,799,040 | 220,199,040 |
| Size | 2.1 GB | 210.0 MB |
| Events in quadrant A | 17,939,823 | 1,409,338 |
| Events in quadrant B | 12,748,209 | 1,784,215 |
| Events in quadrant C | 31,920,336 | 866,994 |
| Events in quadrant D | 17,877,209 | 1,330,768 |
| Mode M0 | |||
|---|---|---|---|
| Quadrant | BADHDUFLAG | Total packets | Discarded packets |
| A | 0 | 65995 | 2 |
| B | 0 | 50609 | 2 |
| C | 0 | 107589 | 2 |
| D | 0 | 66087 | 2 |
| Mode SS | |||
|---|---|---|---|
| Quadrant | BADHDUFLAG | Total packets | Discarded packets |
| A | 0 | 372 | 0 |
| B | 0 | 372 | 0 |
| C | 0 | 372 | 0 |
| D | 0 | 372 | 0 |
| Mode M9 | |||
|---|---|---|---|
| Quadrant | BADHDUFLAG | Total packets | Discarded packets |
| A | 0 | 11 | 0 |
| B | 0 | 11 | 0 |
| C | 0 | 11 | 0 |
| D | 0 | 11 | 0 |
| Quadrant | Total seconds | Saturated seconds | Saturation percentage |
|---|---|---|---|
| A | 18499 | 3128 | 16.909022% |
| B | 18499 | 879 | 4.751608% |
| C | 18499 | 9005 | 48.678307% |
| D | 18499 | 2649 | 14.319693% |
Noise dominated data is calculated using 1-second bins in cleaned event files. If a bin has >2000 counts, and if more than 50% of those come from <1% of pixels, then it is considered to be noise-dominated and hence unusable.
| Quadrant | # 1 sec bins | Bins with >0 counts | Bins with >2000 counts | High rate bins dominated by noise | Noise dominated (total time) | Noise dominated (detector-on time) | Marked lightcurve |
|---|---|---|---|---|---|---|---|
| A | 19544 | 18500 | 2605 | 2605 | 13.33% | 14.08% | 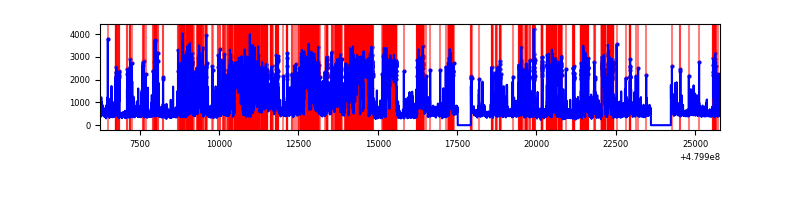 |
| B | 19544 | 18501 | 401 | 401 | 2.05% | 2.17% | 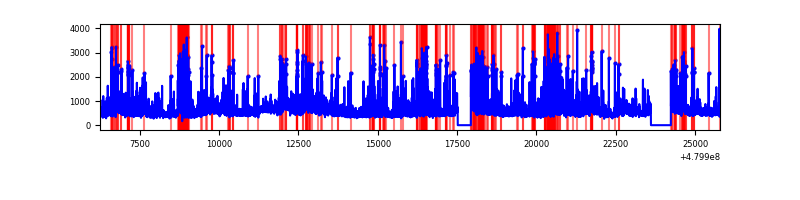 |
| C | 19543 | 18498 | 8295 | 8295 | 42.44% | 44.84% | 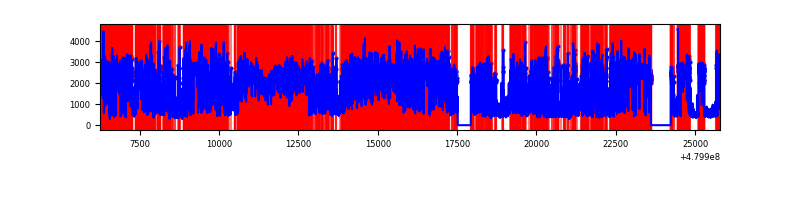 |
| D | 19544 | 18499 | 2446 | 2446 | 12.52% | 13.22% | 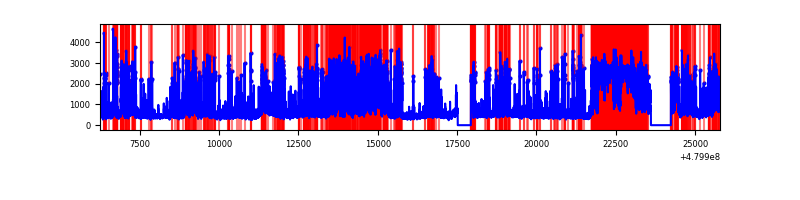 |
Top three noisy pixels from each quadrant. If the there are fewer than three noisy pixels in the level2.evt file, extra rows are filled as -1
| Pixel properties | Quadrant properties | ||||||
|---|---|---|---|---|---|---|---|
| Quadrant | DetID | PixID | Counts | Sigma | Mean | Median | Sigma |
| A | 8 | 26 | 6462649 | 14355.85 | 1827 | 1784 | 450.1 |
| A | 3 | 95 | 1565126 | 3473.7 | 1827 | 1784 | 450.1 |
| A | 12 | 3 | 578886 | 1282.3 | 1827 | 1784 | 450.1 |
| B | 5 | 185 | 919744 | 2250.5 | 1929 | 1859 | 407.9 |
| B | 8 | 128 | 794733 | 1944.0 | 1929 | 1859 | 407.9 |
| B | 10 | 254 | 764654 | 1870.25 | 1929 | 1859 | 407.9 |
| C | 4 | 12 | 13540963 | 32644.54 | 1490 | 1475 | 414.8 |
| C | 9 | 38 | 2906271 | 7003.64 | 1490 | 1475 | 414.8 |
| C | 9 | 95 | 2327024 | 5607.04 | 1490 | 1475 | 414.8 |
| D | 6 | 42 | 3569717 | 7195.09 | 1792 | 1734 | 495.9 |
| D | 3 | 12 | 2238769 | 4511.14 | 1792 | 1734 | 495.9 |
| D | 7 | 60 | 820046 | 1650.18 | 1792 | 1734 | 495.9 |
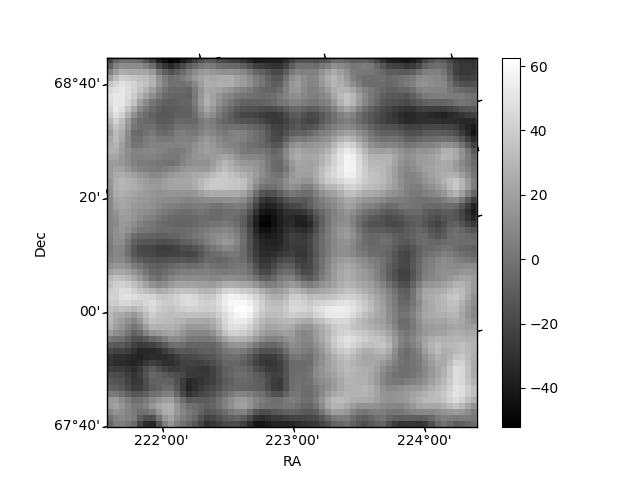
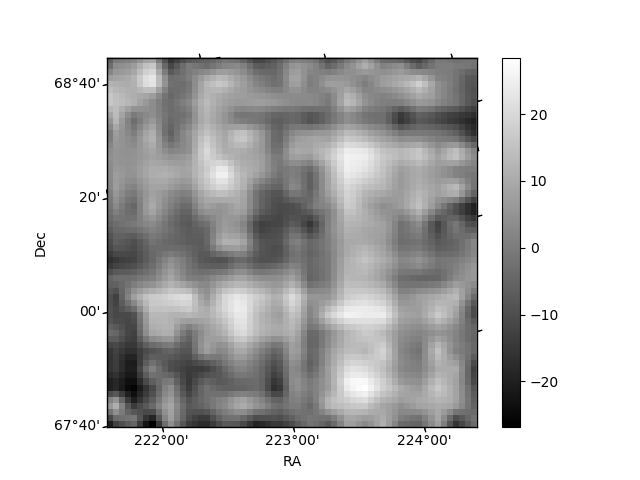
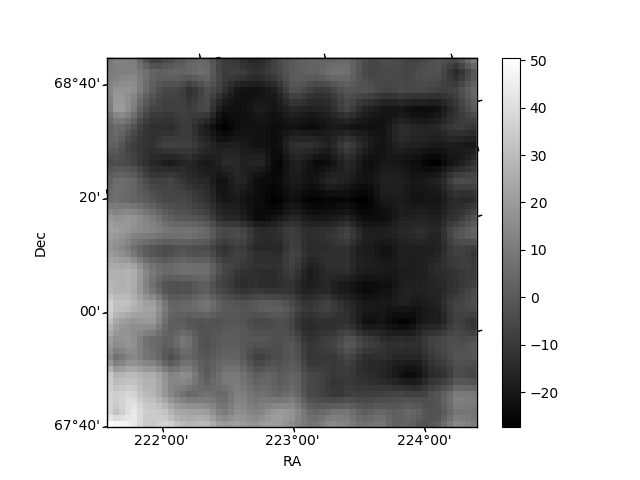
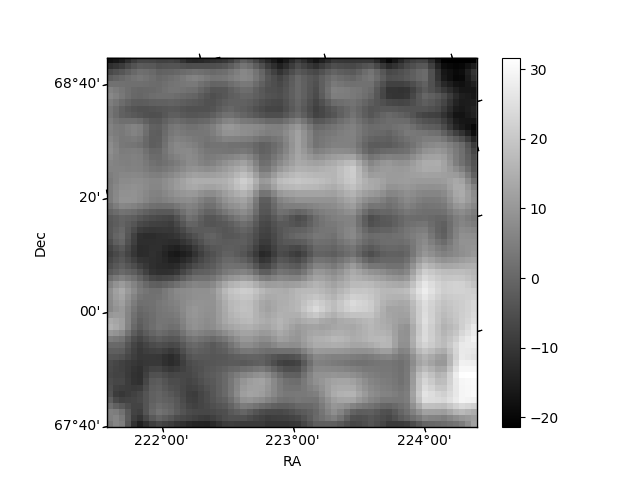
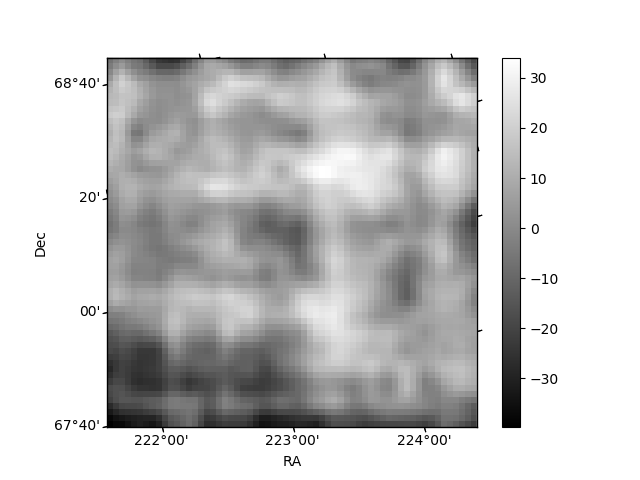
Histogram calculated using DETX and DETY for each event in the final _common_clean file
| Quadrant A | 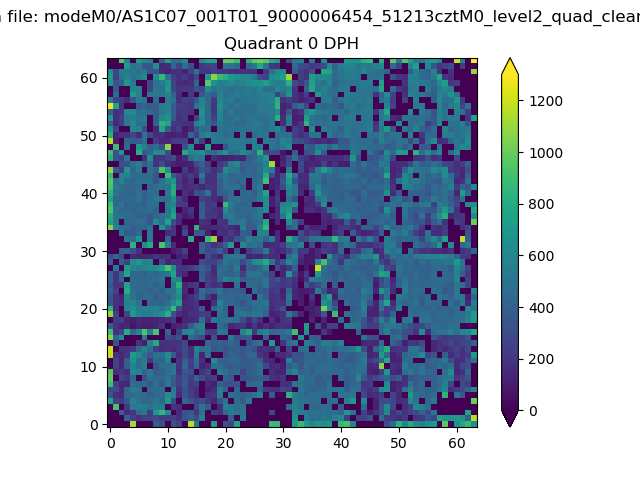 |
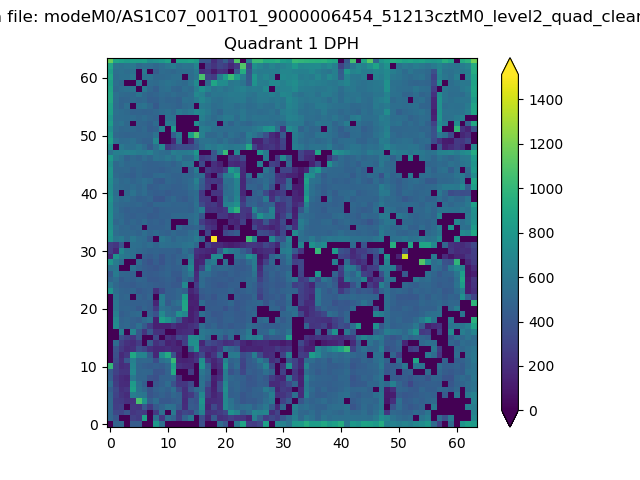 |
Quadrant B |
|---|---|---|---|
| Quadrant D | 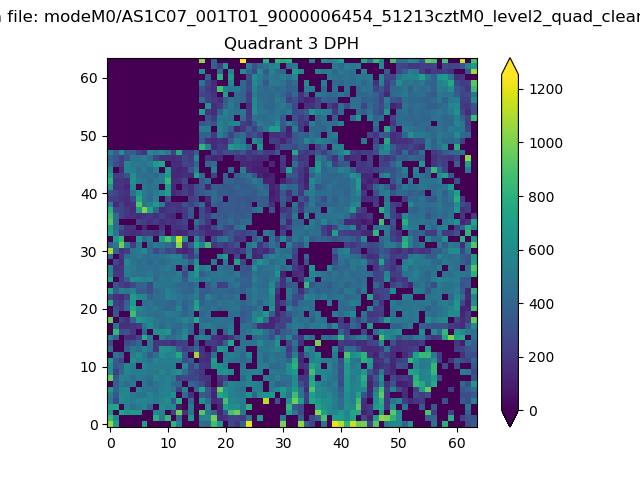 |
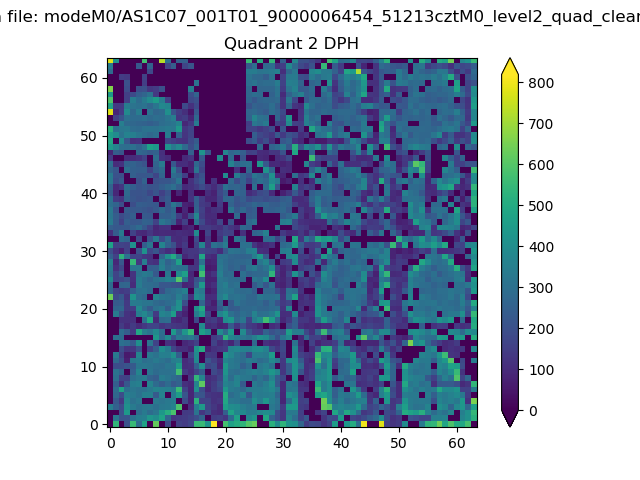 |
Quadrant C |
| Plot type | Count rate plots | Images |
|---|---|---|
| Comparison with Poisson distribution Blue bars denote a histogram of data divided into 1 sec bins. Red curve is a Poisson curve with rate = median count rate of data. |
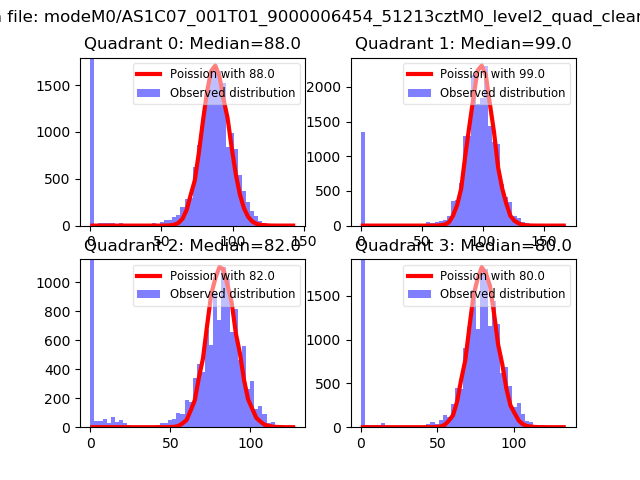 |
 |
| Quadrant-wise count rates Data is divided into 100 sec bins |
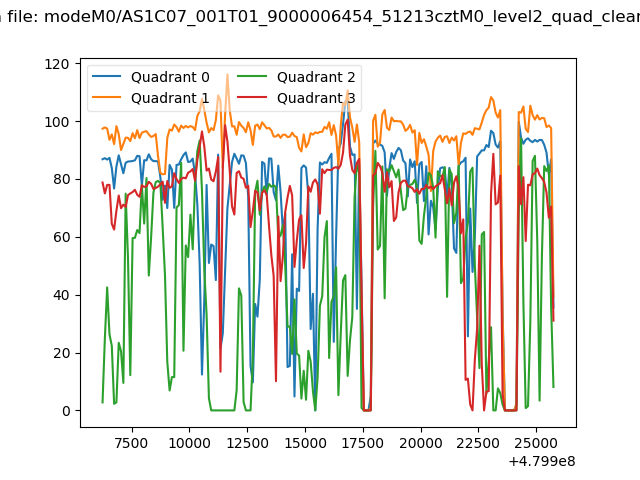 |
|
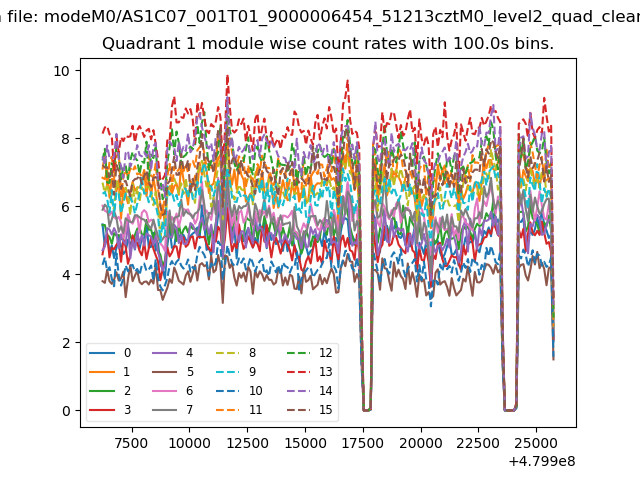
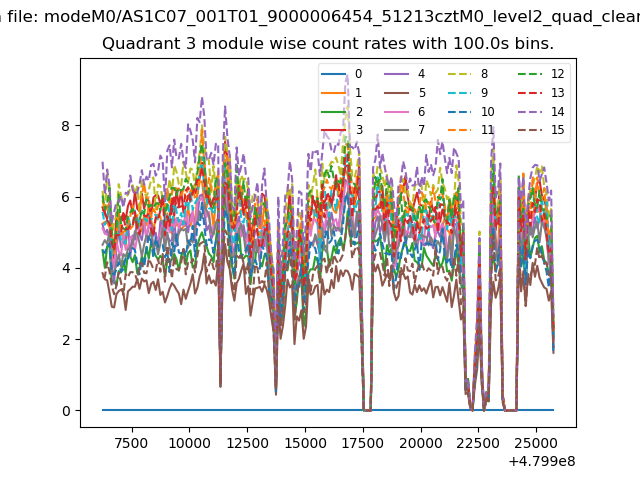
| Module-wise count rates for Quadrant A Data is divided into 100 sec bins |
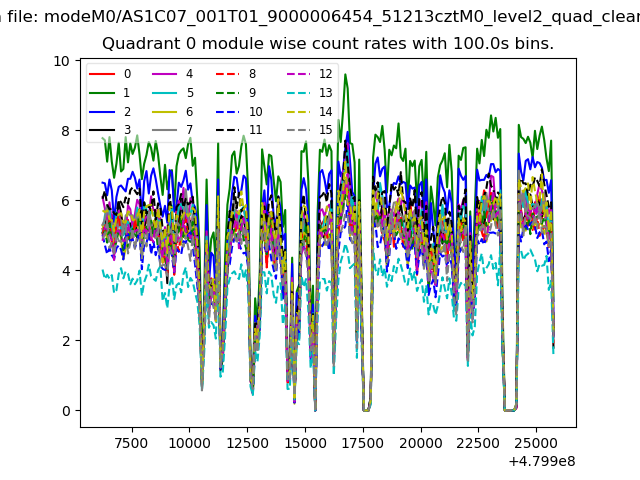 |
 |
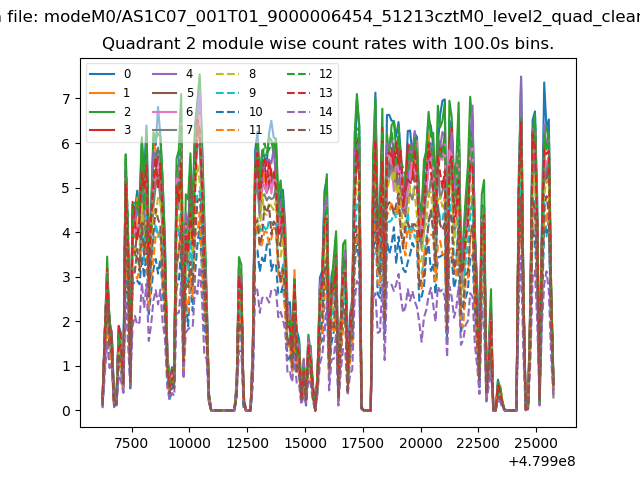
| Module-wise count rates for Quadrant B Data is divided into 100 sec bins |
 |
 |
| Module-wise count rates for Quadrant C Data is divided into 100 sec bins |
 |
 |
| Module-wise count rates for Quadrant D Data is divided into 100 sec bins |
 |
 |
| Parameter | Plot |
|---|---|
| CZT HV Monitor | 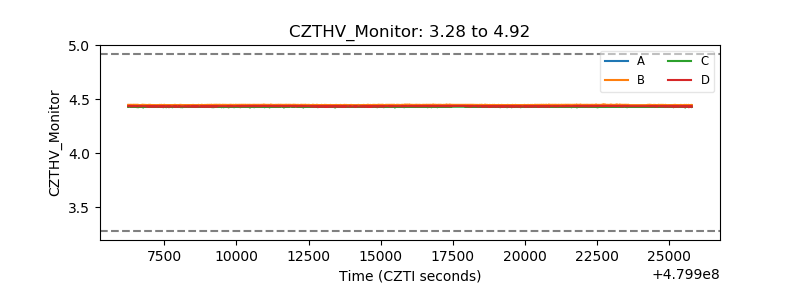 |
| D_VDD | 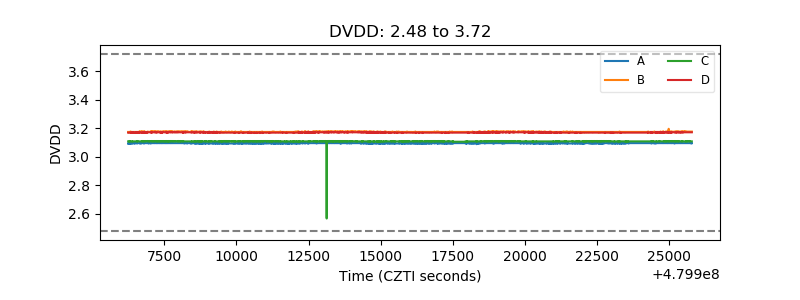 |
| Temperature 1 | 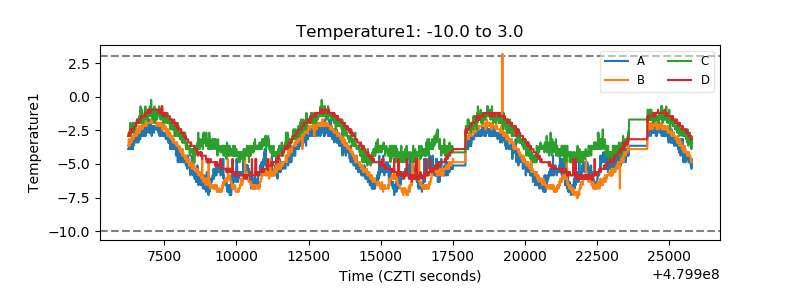 |
| Veto HV Monitor | 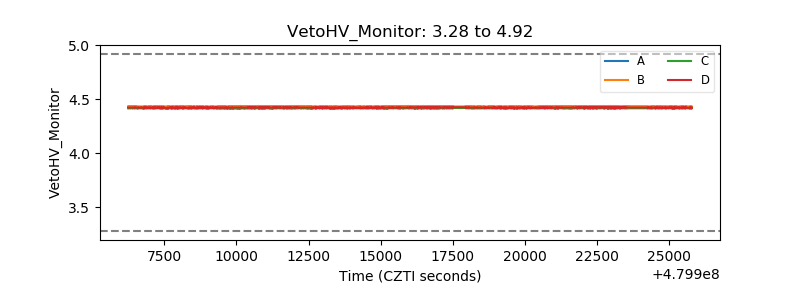 |
| Veto LLD | 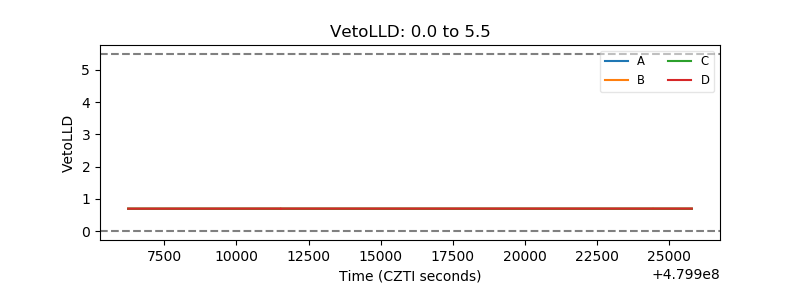 |
| Alpha Counter | 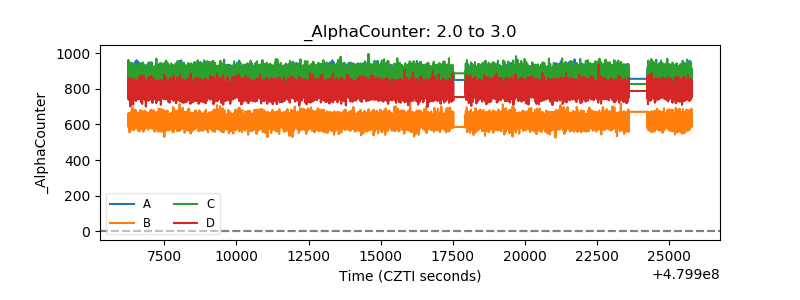 |
| _CPM_Rate | 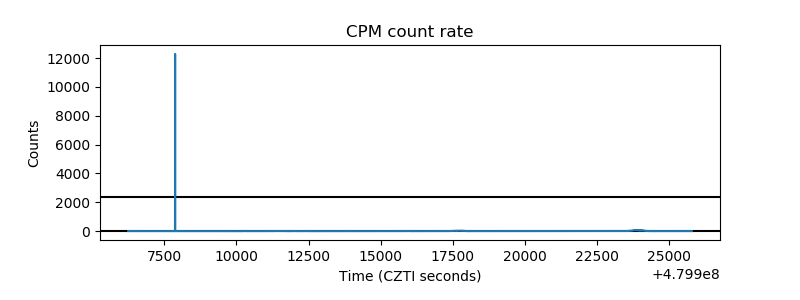 |
| CZT Counter | 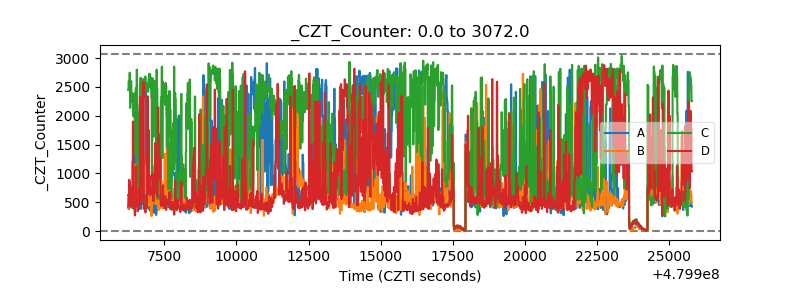 |
| +2.5 Volts monitor |  |
| +5 Volts monitor | 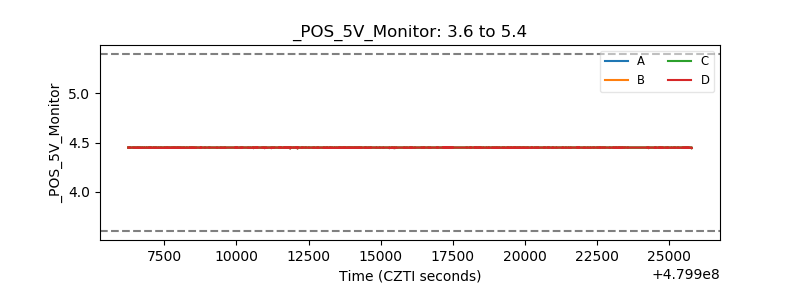 |
| _ROLL_ROT | 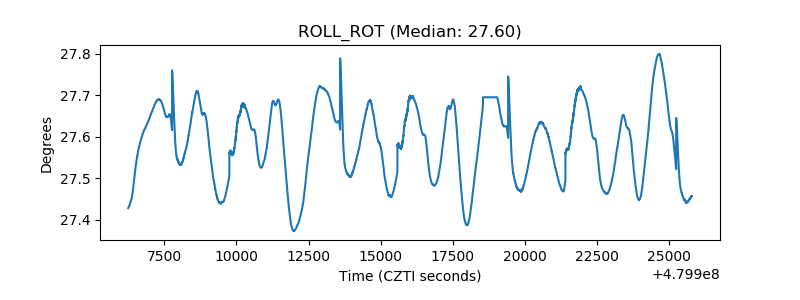 |
| _Roll_DEC | 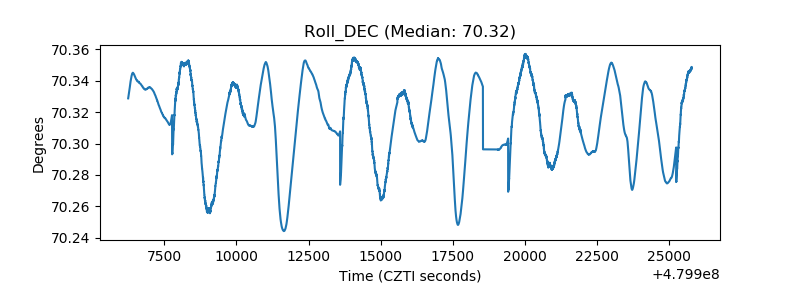 |
| _Roll_RA | 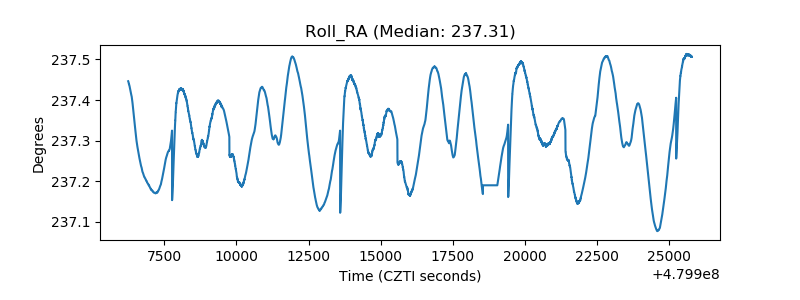 |
| Veto Counter | 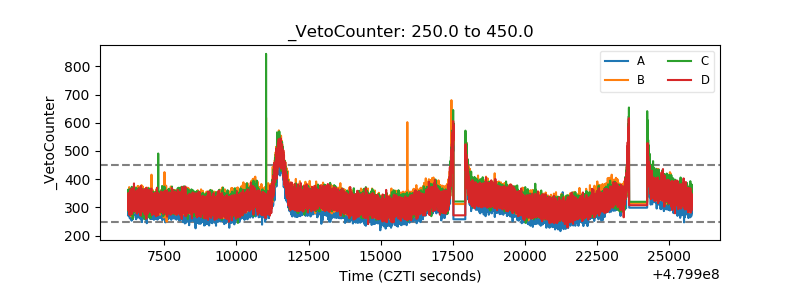 |