| Param | Original file | Final file |
|---|---|---|
| Filename | modeM0/AS1C07_001T01_9000006454_51214cztM0_level2.fits | modeM0/AS1C07_001T01_9000006454_51214cztM0_level2_quad_clean.evt |
| Size (bytes) | 637,894,080 | 89,170,560 |
| Size | 608.3 MB | 85.0 MB |
| Events in quadrant A | 4,227,122 | 606,008 |
| Events in quadrant B | 4,768,901 | 652,114 |
| Events in quadrant C | 8,085,472 | 456,167 |
| Events in quadrant D | 6,019,711 | 525,419 |
| Mode M0 | |||
|---|---|---|---|
| Quadrant | BADHDUFLAG | Total packets | Discarded packets |
| A | 0 | 17151 | 1 |
| B | 0 | 18551 | 1 |
| C | 0 | 28525 | 1 |
| D | 0 | 22482 | 1 |
| Mode SS | |||
|---|---|---|---|
| Quadrant | BADHDUFLAG | Total packets | Discarded packets |
| A | 0 | 132 | 0 |
| B | 0 | 132 | 0 |
| C | 0 | 132 | 0 |
| D | 0 | 132 | 0 |
| Mode M9 | |||
|---|---|---|---|
| Quadrant | BADHDUFLAG | Total packets | Discarded packets |
| A | 0 | 9 | 0 |
| B | 0 | 9 | 0 |
| C | 0 | 9 | 0 |
| D | 0 | 9 | 0 |
| Quadrant | Total seconds | Saturated seconds | Saturation percentage |
|---|---|---|---|
| A | 6603 | 230 | 3.483265% |
| B | 6603 | 236 | 3.574133% |
| C | 6603 | 1766 | 26.745419% |
| D | 6603 | 578 | 8.753597% |
Noise dominated data is calculated using 1-second bins in cleaned event files. If a bin has >2000 counts, and if more than 50% of those come from <1% of pixels, then it is considered to be noise-dominated and hence unusable.
| Quadrant | # 1 sec bins | Bins with >0 counts | Bins with >2000 counts | High rate bins dominated by noise | Noise dominated (total time) | Noise dominated (detector-on time) | Marked lightcurve |
|---|---|---|---|---|---|---|---|
| A | 7448 | 6604 | 163 | 163 | 2.19% | 2.47% | 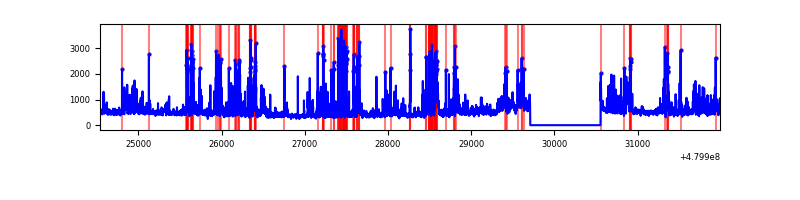 |
| B | 7448 | 6603 | 124 | 124 | 1.66% | 1.88% | 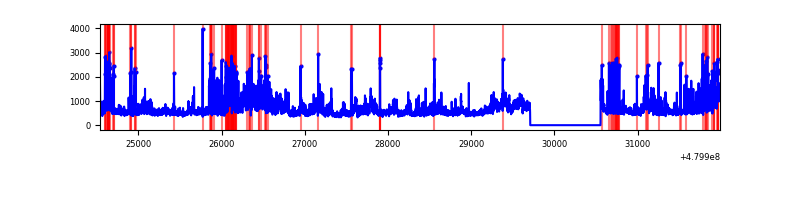 |
| C | 7448 | 6603 | 1667 | 1667 | 22.38% | 25.25% | 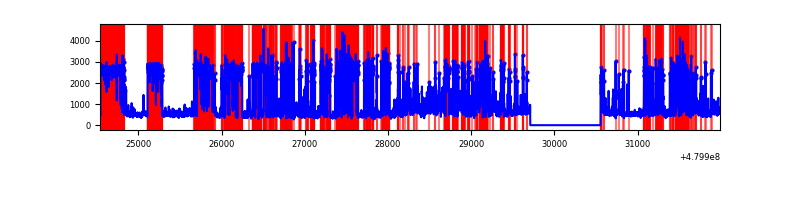 |
| D | 7448 | 6603 | 480 | 480 | 6.44% | 7.27% | 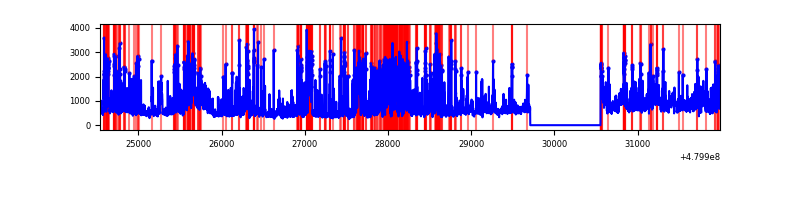 |
Top three noisy pixels from each quadrant. If the there are fewer than three noisy pixels in the level2.evt file, extra rows are filled as -1
| Pixel properties | Quadrant properties | ||||||
|---|---|---|---|---|---|---|---|
| Quadrant | DetID | PixID | Counts | Sigma | Mean | Median | Sigma |
| A | 8 | 26 | 298833 | 1745.93 | 693 | 674 | 170.8 |
| A | 3 | 114 | 284357 | 1661.17 | 693 | 674 | 170.8 |
| A | 12 | 3 | 181973 | 1061.63 | 693 | 674 | 170.8 |
| B | 10 | 254 | 594313 | 3990.02 | 689 | 663 | 148.8 |
| B | 4 | 171 | 272106 | 1824.41 | 689 | 663 | 148.8 |
| B | 10 | 14 | 204475 | 1369.85 | 689 | 663 | 148.8 |
| C | 4 | 12 | 4393371 | 26731.57 | 598 | 594 | 164.3 |
| C | 10 | 252 | 418545 | 2543.38 | 598 | 594 | 164.3 |
| C | 4 | 13 | 251368 | 1526.05 | 598 | 594 | 164.3 |
| D | 15 | 108 | 900780 | 4819.37 | 661 | 638 | 186.8 |
| D | 7 | 39 | 424945 | 2271.74 | 661 | 638 | 186.8 |
| D | 3 | 12 | 389006 | 2079.33 | 661 | 638 | 186.8 |
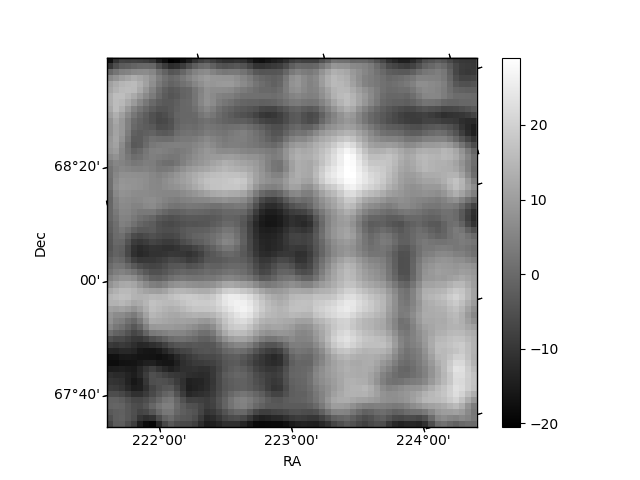
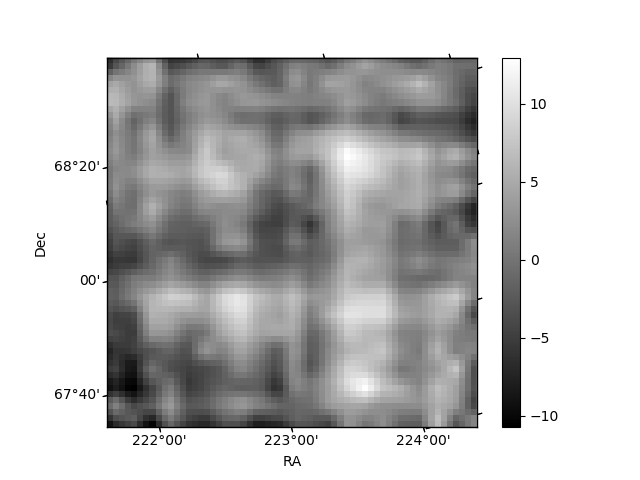
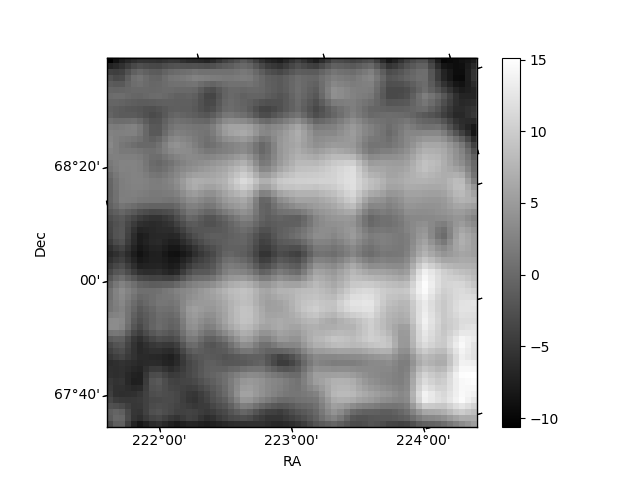
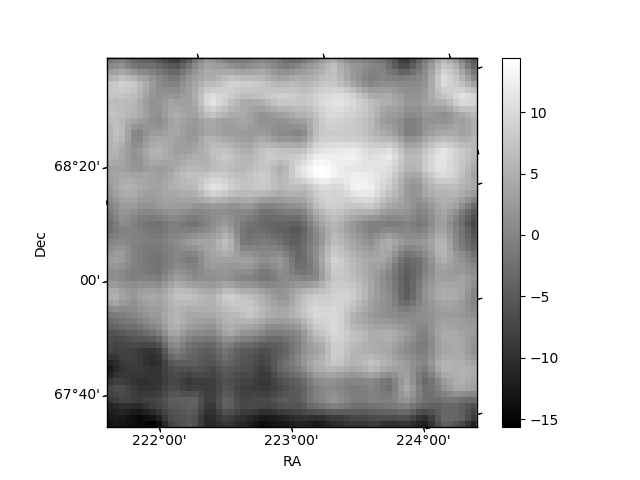
Histogram calculated using DETX and DETY for each event in the final _common_clean file
| Quadrant A | 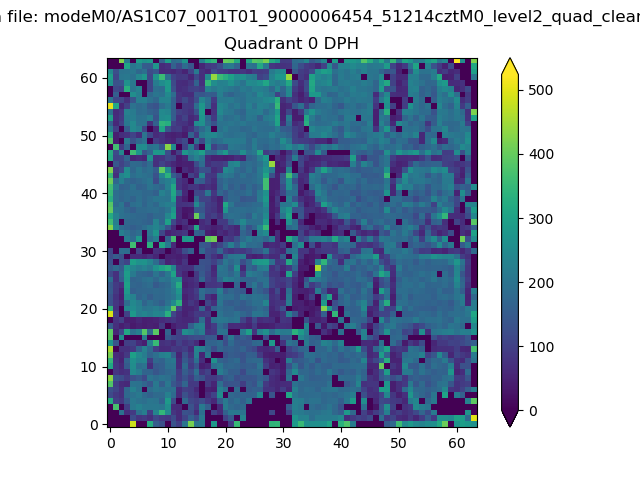 |
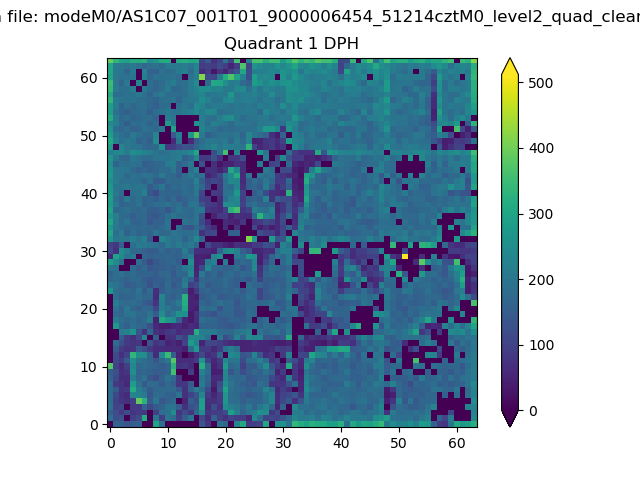 |
Quadrant B |
|---|---|---|---|
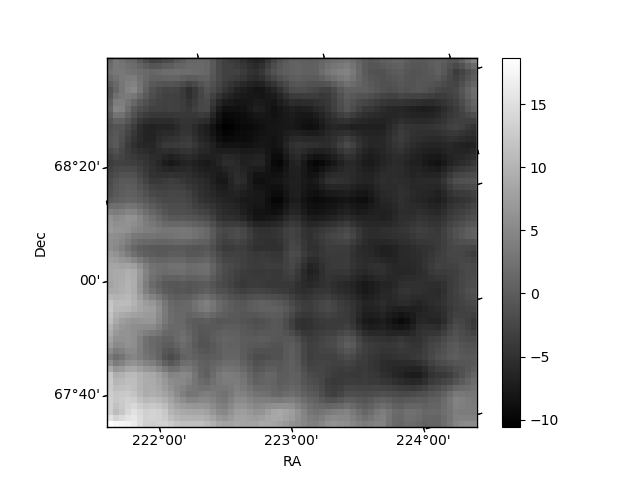
| Quadrant D | 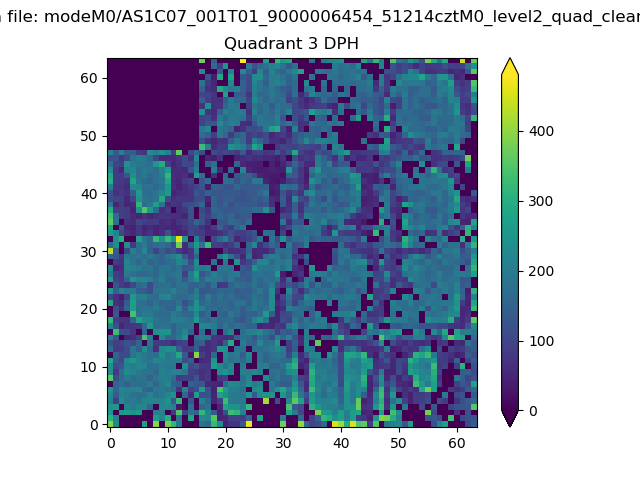 |
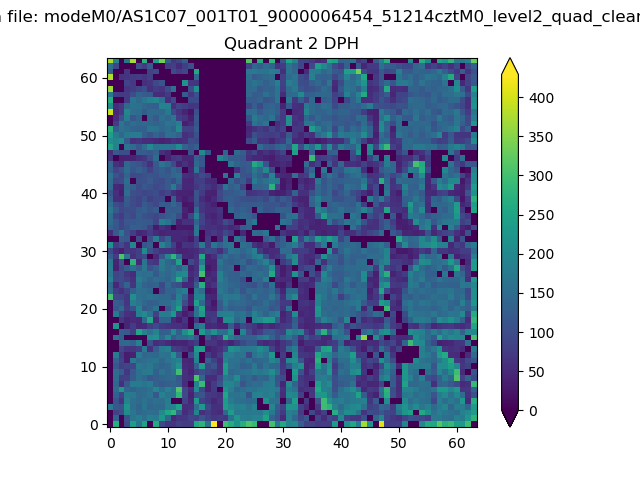 |
Quadrant C |
| Plot type | Count rate plots | Images |
|---|---|---|
| Comparison with Poisson distribution Blue bars denote a histogram of data divided into 1 sec bins. Red curve is a Poisson curve with rate = median count rate of data. |
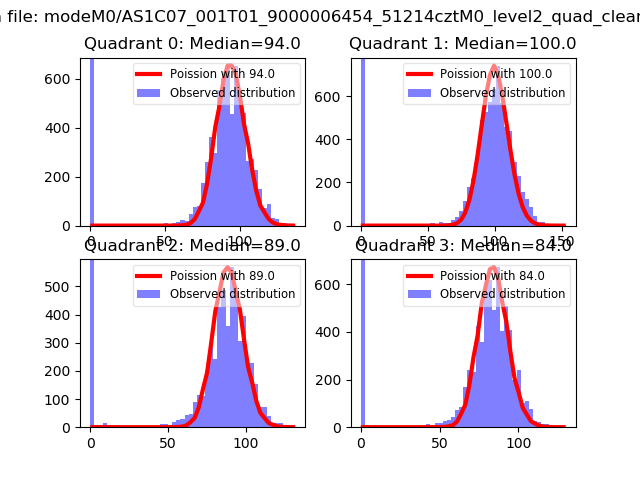 |
 |
| Quadrant-wise count rates Data is divided into 100 sec bins |
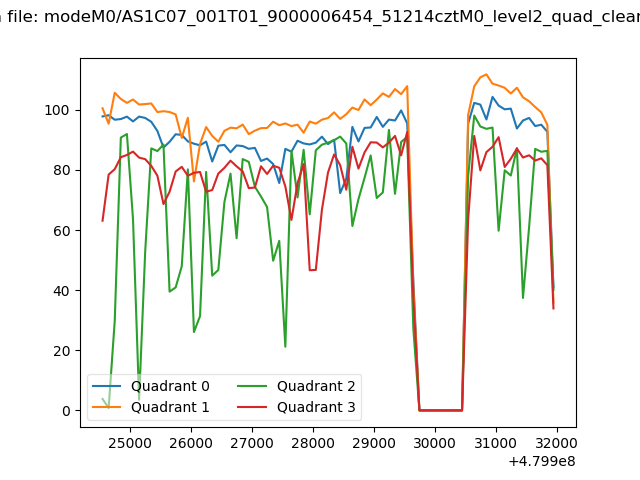 |
|
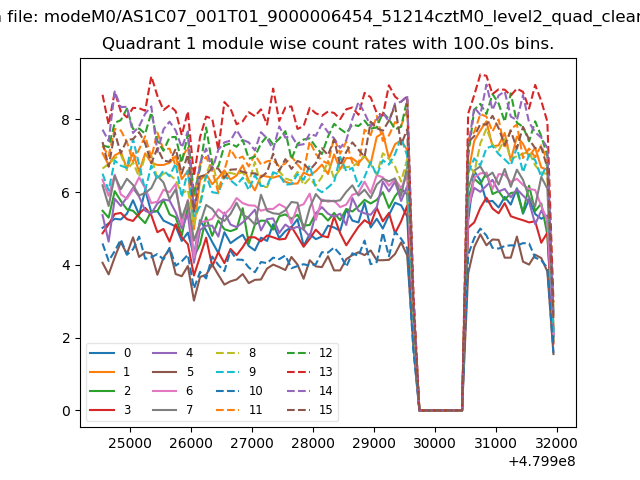
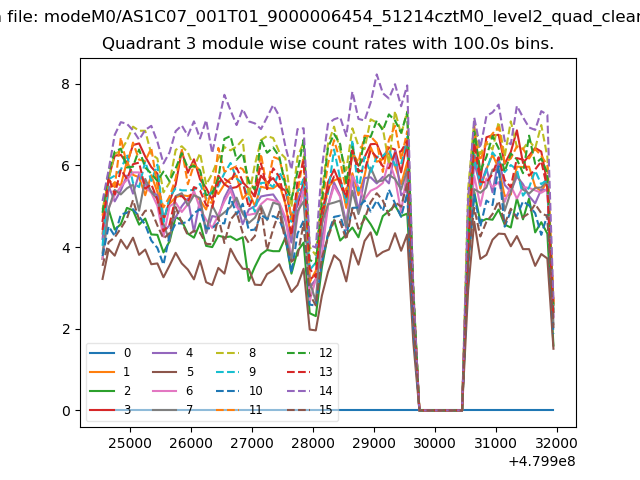
| Module-wise count rates for Quadrant A Data is divided into 100 sec bins |
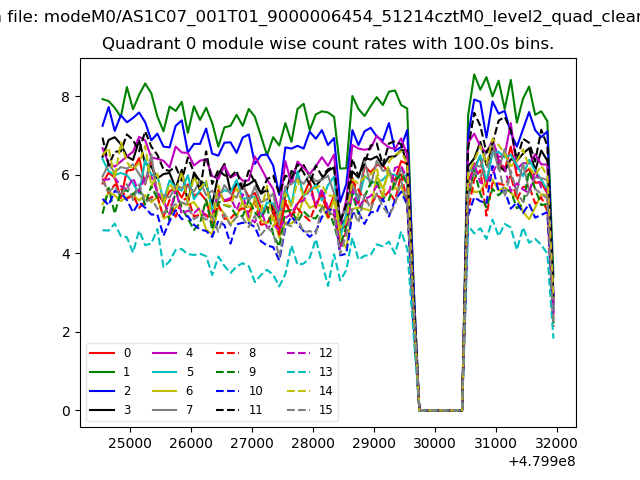 |
 |
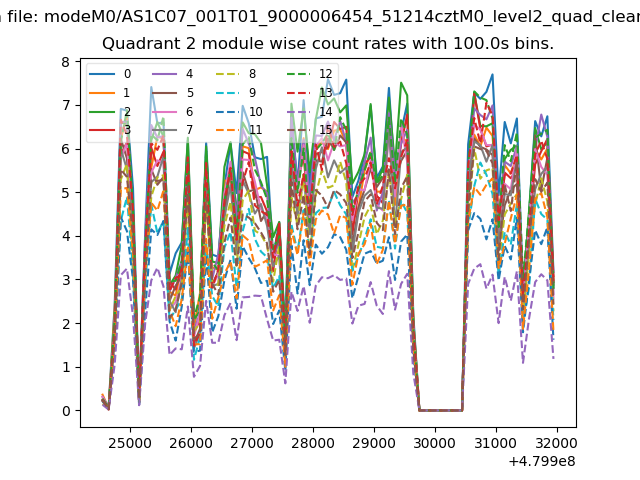
| Module-wise count rates for Quadrant B Data is divided into 100 sec bins |
 |
 |
| Module-wise count rates for Quadrant C Data is divided into 100 sec bins |
 |
 |
| Module-wise count rates for Quadrant D Data is divided into 100 sec bins |
 |
 |
| Parameter | Plot |
|---|---|
| CZT HV Monitor |  |
| D_VDD | 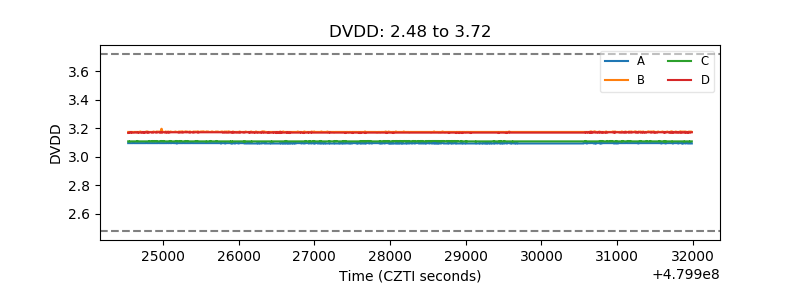 |
| Temperature 1 | 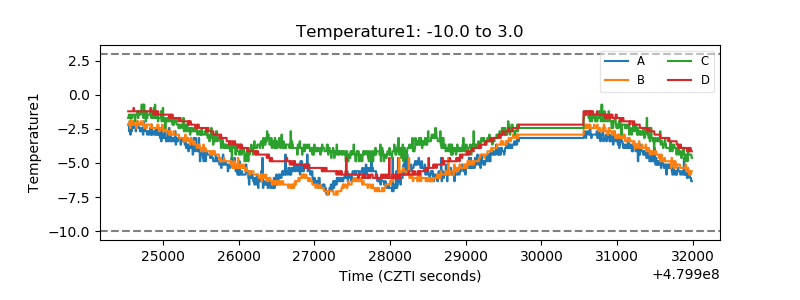 |
| Veto HV Monitor | 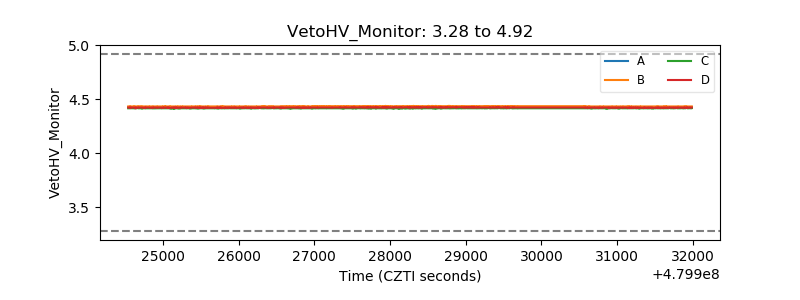 |
| Veto LLD | 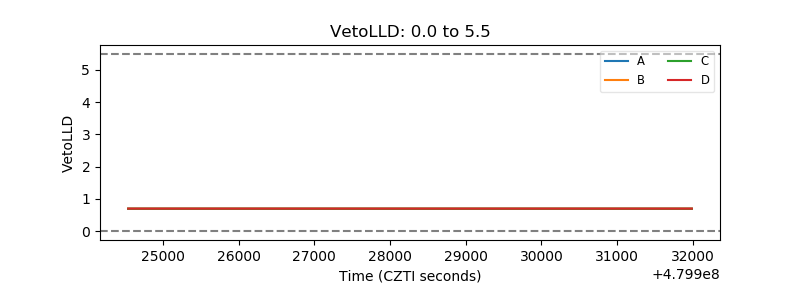 |
| Alpha Counter | 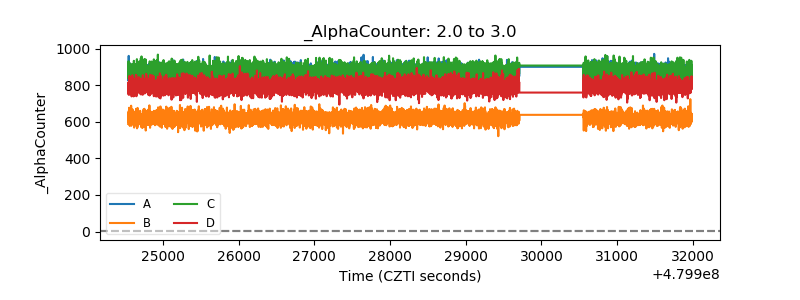 |
| _CPM_Rate | 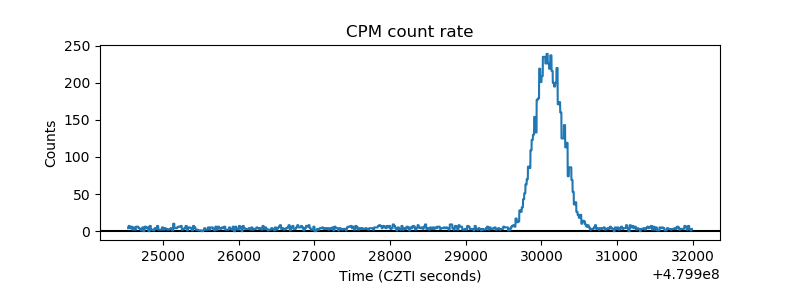 |
| CZT Counter | 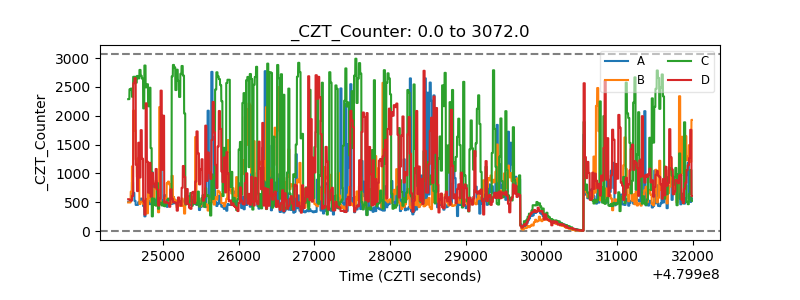 |
| +2.5 Volts monitor | 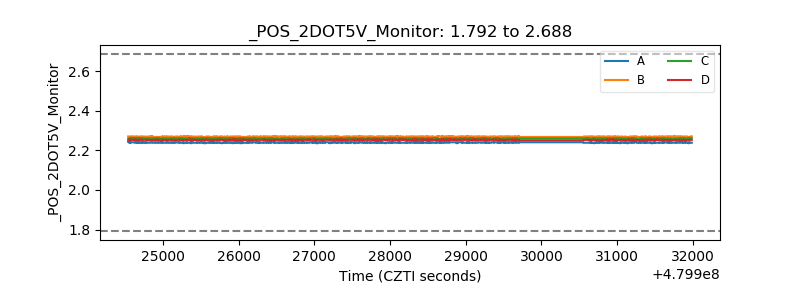 |
| +5 Volts monitor | 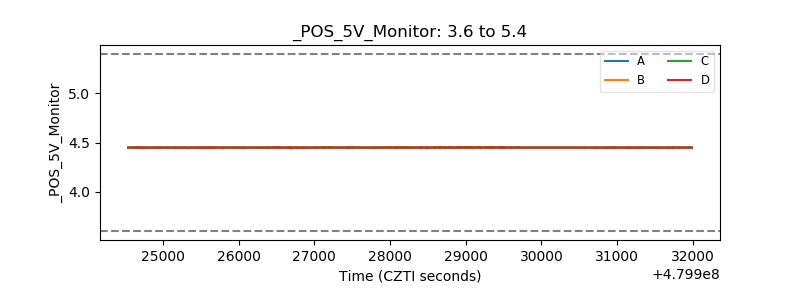 |
| _ROLL_ROT | 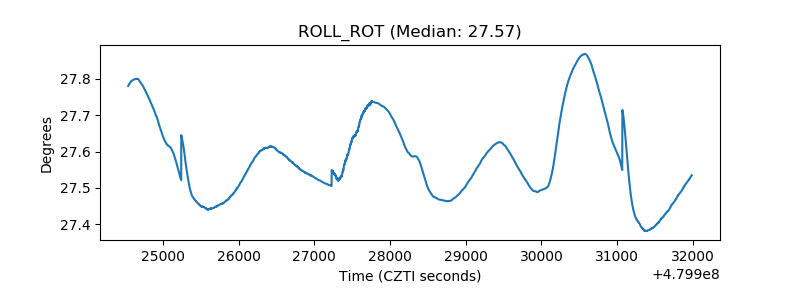 |
| _Roll_DEC | 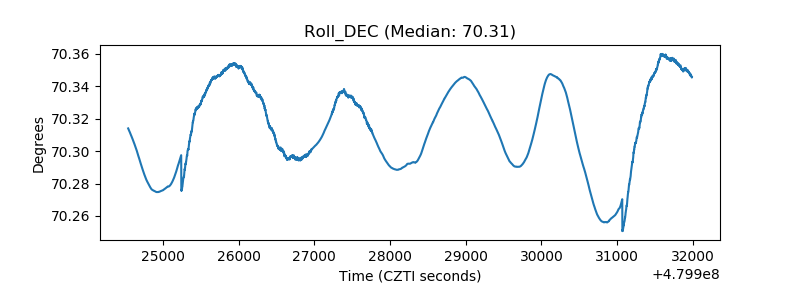 |
| _Roll_RA | 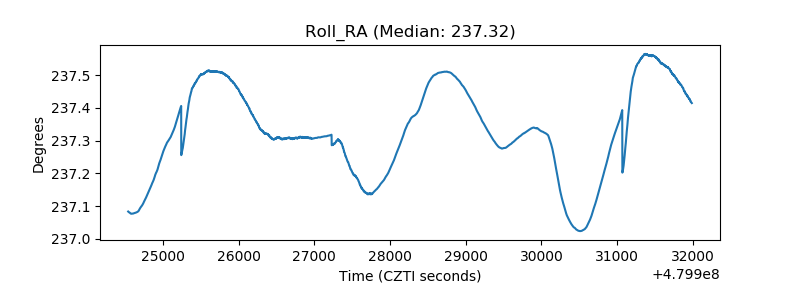 |
| Veto Counter | 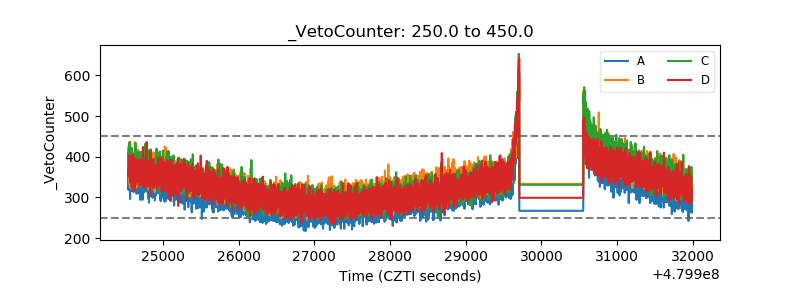 |