| Param | Original file | Final file |
|---|---|---|
| Filename | modeM0/AS1C07_001T01_9000006454_51216cztM0_level2.fits | modeM0/AS1C07_001T01_9000006454_51216cztM0_level2_quad_clean.evt |
| Size (bytes) | 591,425,280 | 88,162,560 |
| Size | 564.0 MB | 84.1 MB |
| Events in quadrant A | 3,794,213 | 596,625 |
| Events in quadrant B | 4,305,685 | 644,497 |
| Events in quadrant C | 8,210,033 | 461,211 |
| Events in quadrant D | 5,088,338 | 521,850 |
| Mode M0 | |||
|---|---|---|---|
| Quadrant | BADHDUFLAG | Total packets | Discarded packets |
| A | 0 | 15651 | 1 |
| B | 0 | 17287 | 1 |
| C | 0 | 28778 | 1 |
| D | 0 | 19810 | 1 |
| Mode SS | |||
|---|---|---|---|
| Quadrant | BADHDUFLAG | Total packets | Discarded packets |
| A | 0 | 130 | 0 |
| B | 0 | 130 | 0 |
| C | 0 | 130 | 0 |
| D | 0 | 130 | 0 |
| Mode M9 | |||
|---|---|---|---|
| Quadrant | BADHDUFLAG | Total packets | Discarded packets |
| A | 0 | 10 | 0 |
| B | 0 | 10 | 0 |
| C | 0 | 10 | 0 |
| D | 0 | 10 | 0 |
| Quadrant | Total seconds | Saturated seconds | Saturation percentage |
|---|---|---|---|
| A | 6377 | 118 | 1.850400% |
| B | 6377 | 177 | 2.775600% |
| C | 6377 | 1647 | 25.827191% |
| D | 6377 | 418 | 6.554806% |
Noise dominated data is calculated using 1-second bins in cleaned event files. If a bin has >2000 counts, and if more than 50% of those come from <1% of pixels, then it is considered to be noise-dominated and hence unusable.
| Quadrant | # 1 sec bins | Bins with >0 counts | Bins with >2000 counts | High rate bins dominated by noise | Noise dominated (total time) | Noise dominated (detector-on time) | Marked lightcurve |
|---|---|---|---|---|---|---|---|
| A | 7357 | 6378 | 62 | 62 | 0.84% | 0.97% | 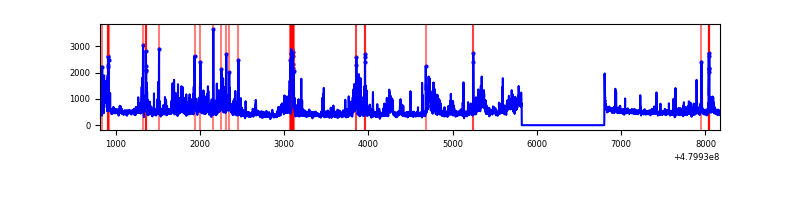 |
| B | 7357 | 6377 | 81 | 81 | 1.10% | 1.27% | 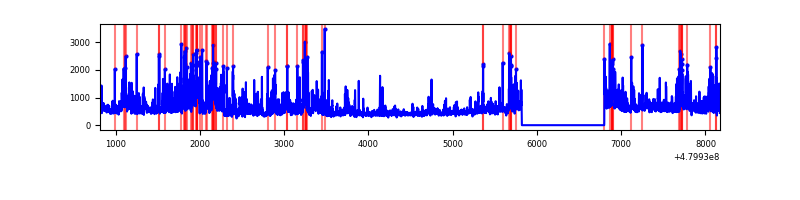 |
| C | 7357 | 6377 | 1583 | 1583 | 21.52% | 24.82% | 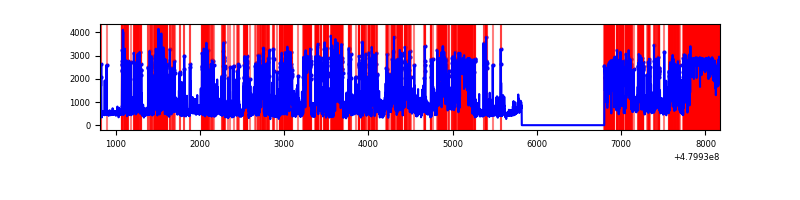 |
| D | 7357 | 6377 | 347 | 347 | 4.72% | 5.44% | 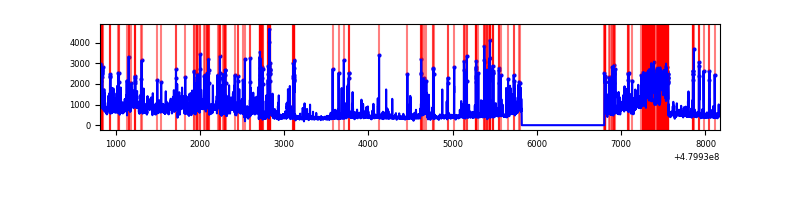 |
Top three noisy pixels from each quadrant. If the there are fewer than three noisy pixels in the level2.evt file, extra rows are filled as -1
| Pixel properties | Quadrant properties | ||||||
|---|---|---|---|---|---|---|---|
| Quadrant | DetID | PixID | Counts | Sigma | Mean | Median | Sigma |
| A | 12 | 3 | 260737 | 1571.5 | 668 | 652 | 165.5 |
| A | 8 | 26 | 193869 | 1167.47 | 668 | 652 | 165.5 |
| A | 4 | 142 | 166697 | 1003.29 | 668 | 652 | 165.5 |
| B | 8 | 128 | 260759 | 1828.1 | 666 | 641 | 142.3 |
| B | 4 | 170 | 227918 | 1597.29 | 666 | 641 | 142.3 |
| B | 10 | 254 | 223719 | 1567.78 | 666 | 641 | 142.3 |
| C | 4 | 12 | 3562278 | 21918.07 | 585 | 580 | 162.5 |
| C | 10 | 252 | 909791 | 5595.13 | 585 | 580 | 162.5 |
| C | 9 | 38 | 352941 | 2168.37 | 585 | 580 | 162.5 |
| D | 3 | 12 | 654450 | 3635.63 | 640 | 619 | 179.8 |
| D | 7 | 39 | 387967 | 2153.85 | 640 | 619 | 179.8 |
| D | 2 | 216 | 202749 | 1123.94 | 640 | 619 | 179.8 |
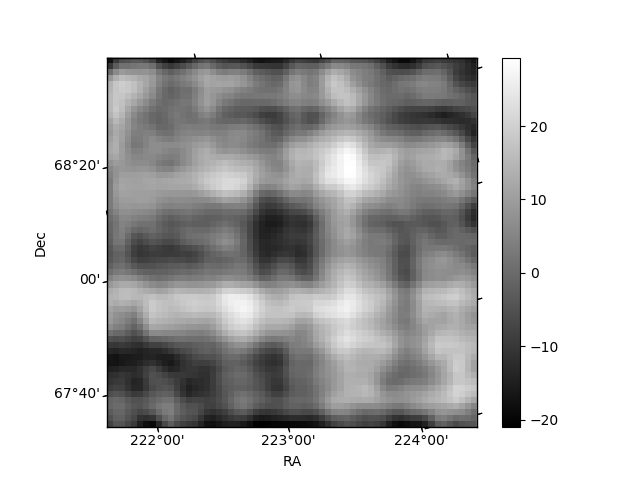
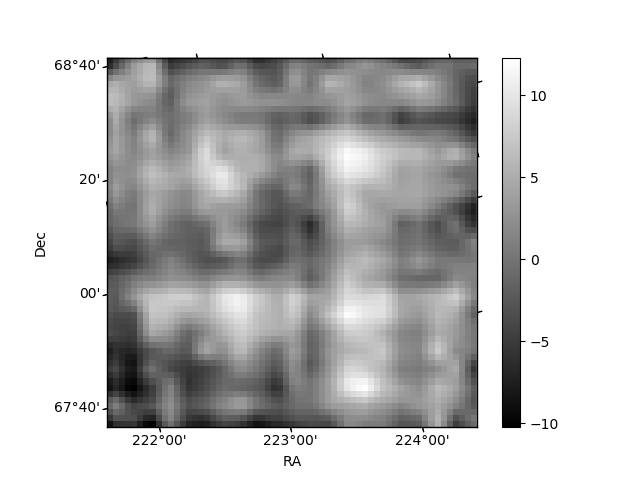
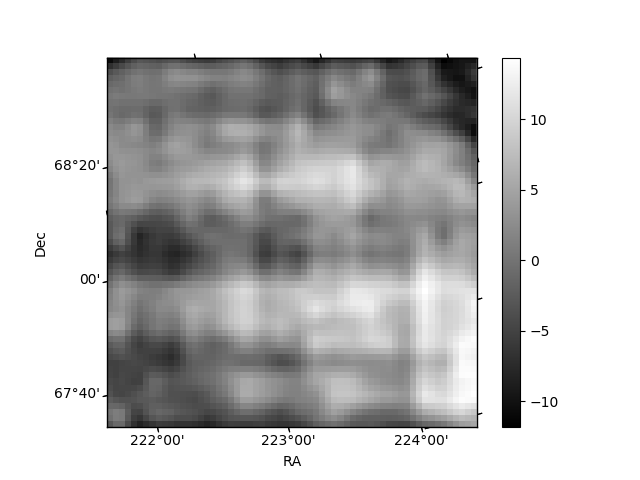
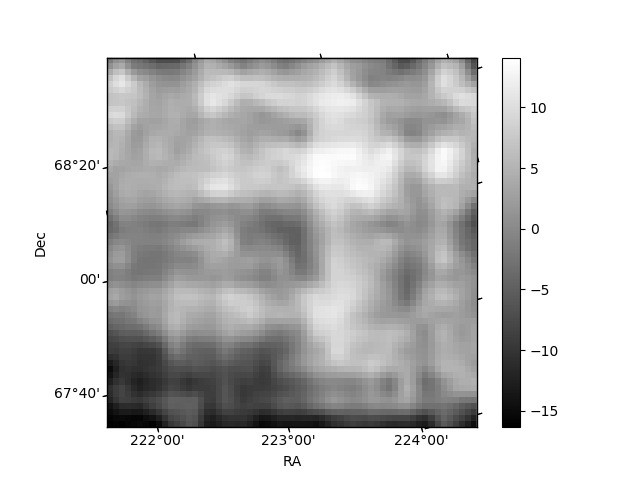
Histogram calculated using DETX and DETY for each event in the final _common_clean file
| Quadrant A | 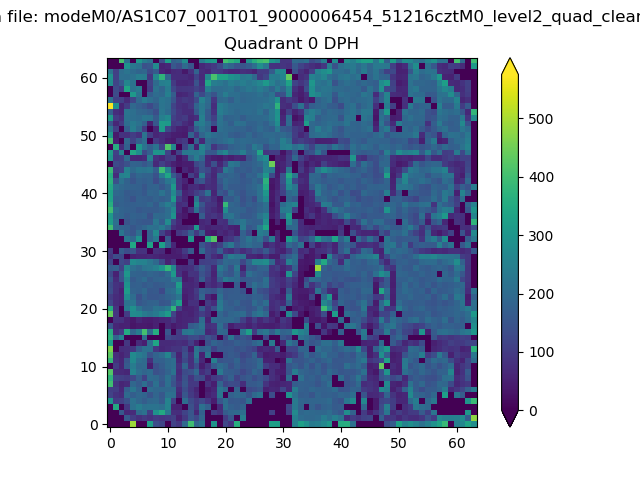 |
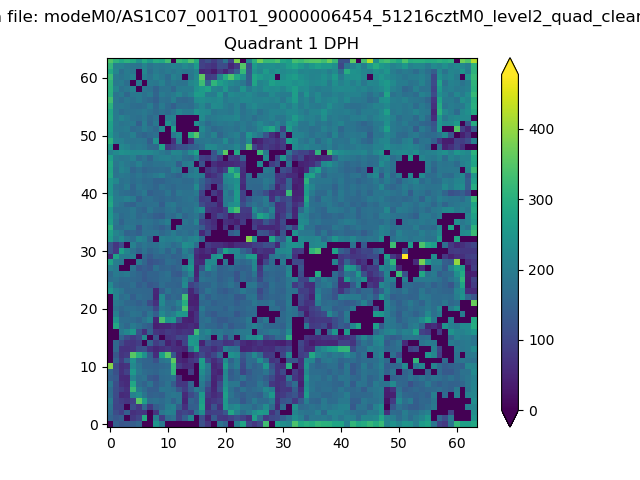 |
Quadrant B |
|---|---|---|---|
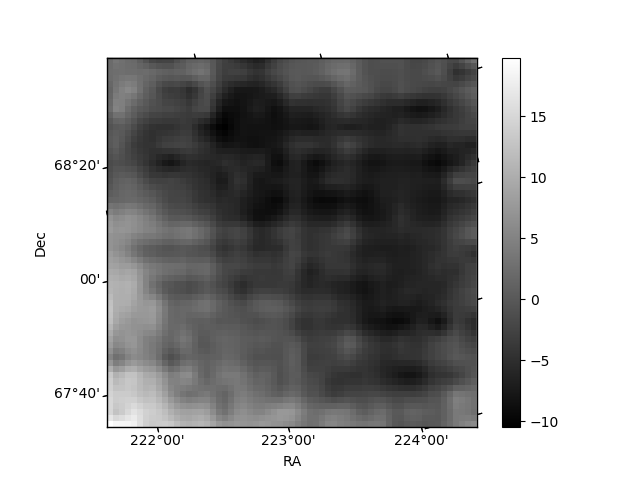
| Quadrant D | 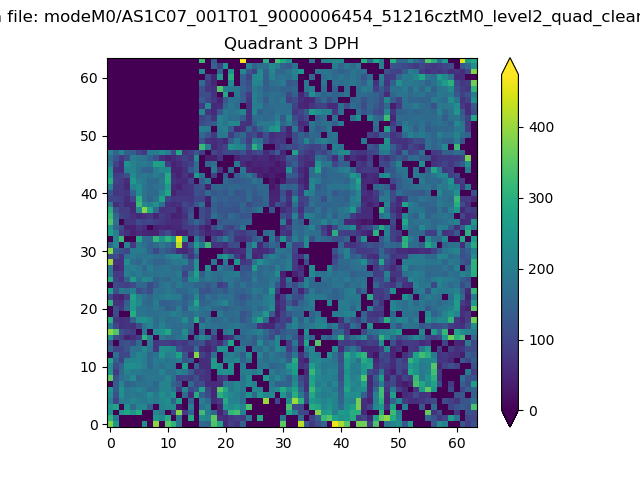 |
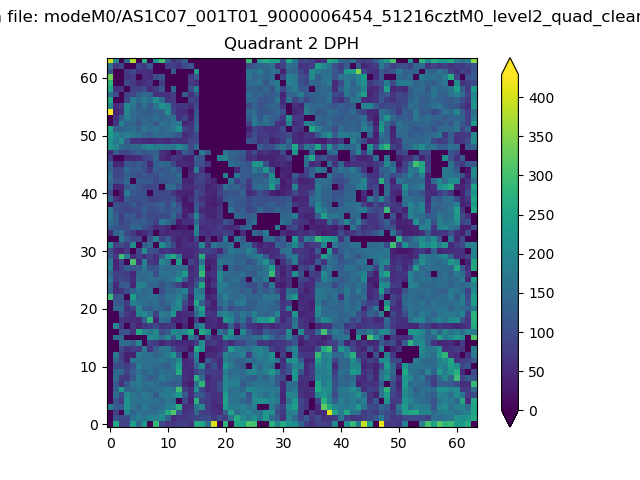 |
Quadrant C |
| Plot type | Count rate plots | Images |
|---|---|---|
| Comparison with Poisson distribution Blue bars denote a histogram of data divided into 1 sec bins. Red curve is a Poisson curve with rate = median count rate of data. |
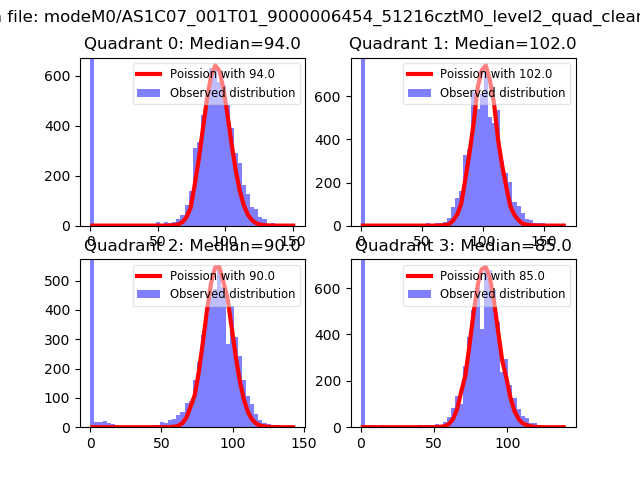 |
 |
| Quadrant-wise count rates Data is divided into 100 sec bins |
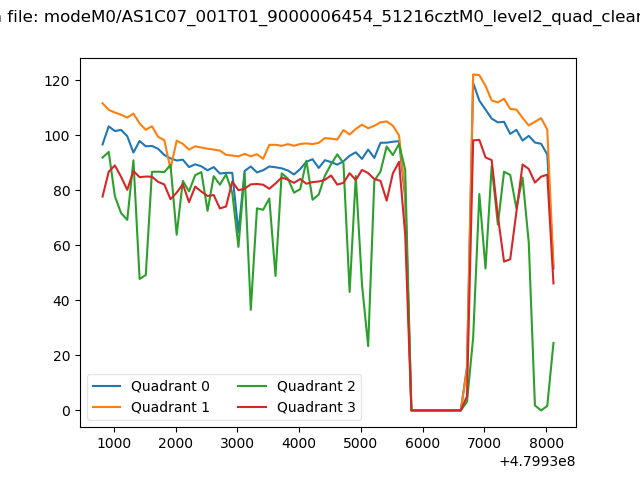 |
|
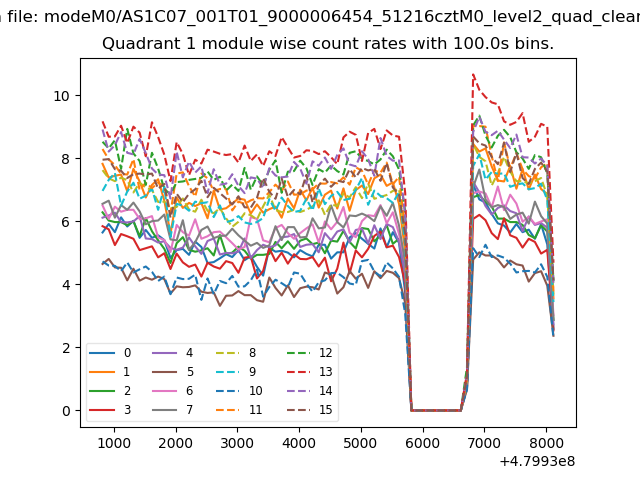
| Module-wise count rates for Quadrant A Data is divided into 100 sec bins |
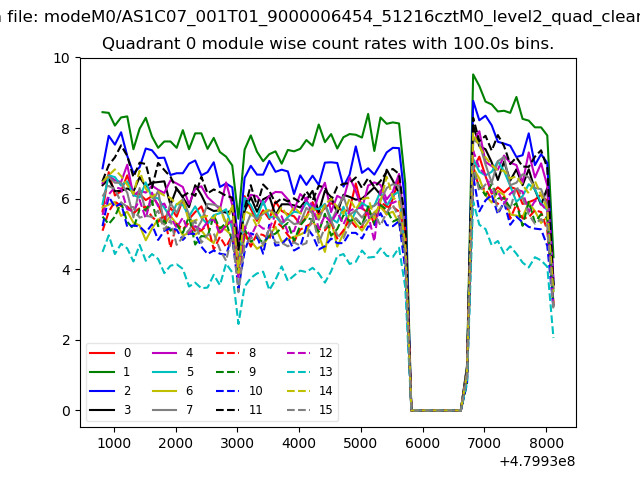 |
 |
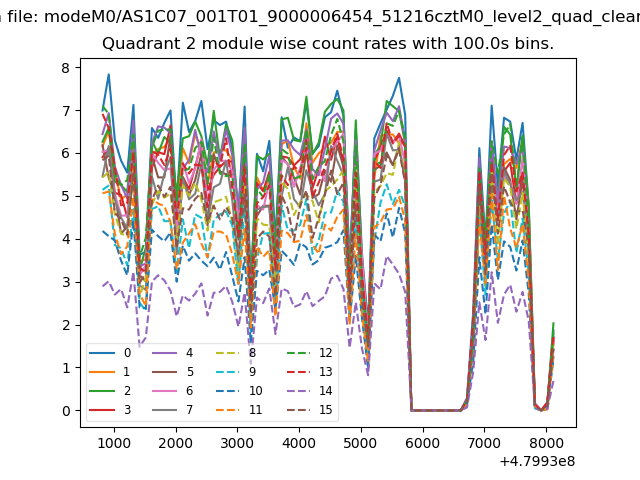
| Module-wise count rates for Quadrant B Data is divided into 100 sec bins |
 |
 |
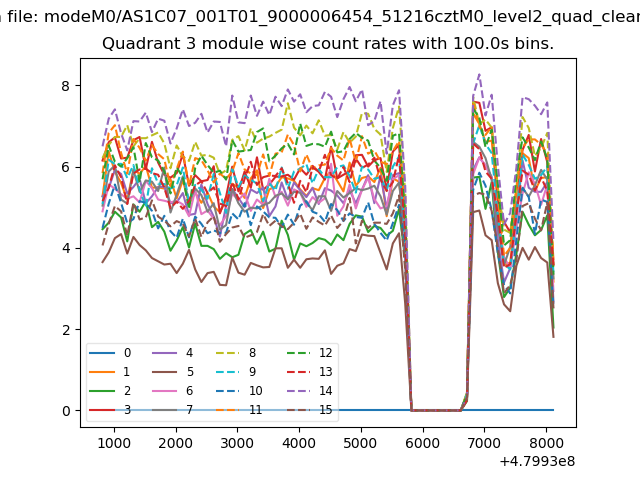
| Module-wise count rates for Quadrant C Data is divided into 100 sec bins |
 |
 |
| Module-wise count rates for Quadrant D Data is divided into 100 sec bins |
 |
 |
| Parameter | Plot |
|---|---|
| CZT HV Monitor | 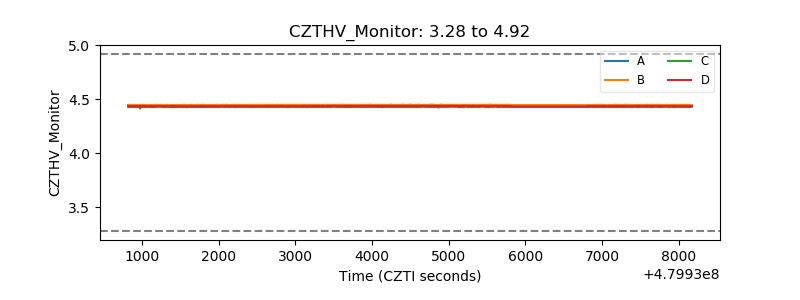 |
| D_VDD | 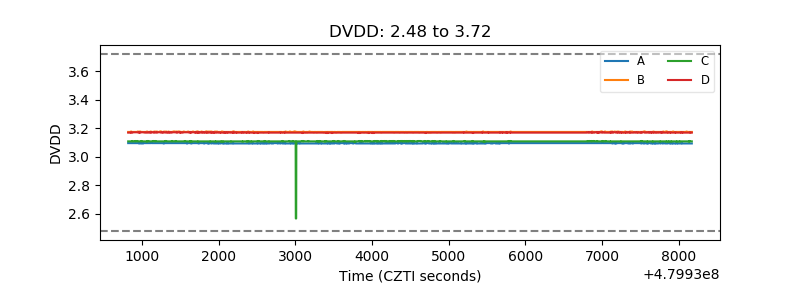 |
| Temperature 1 | 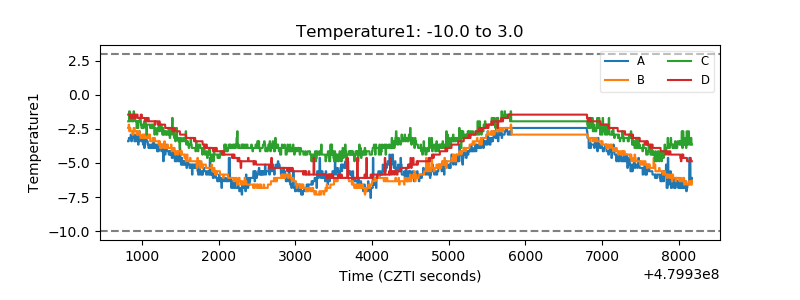 |
| Veto HV Monitor | 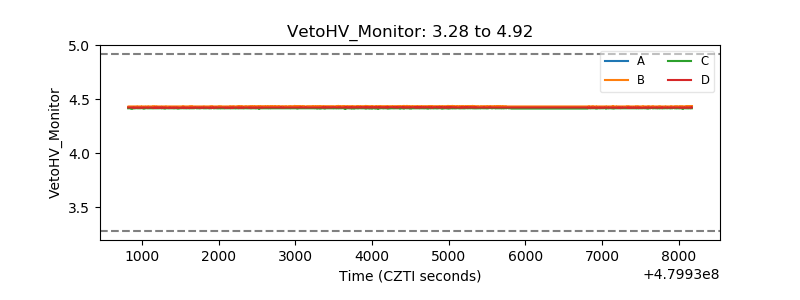 |
| Veto LLD | 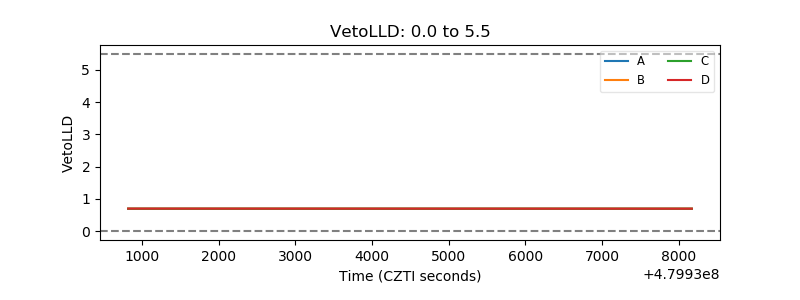 |
| Alpha Counter | 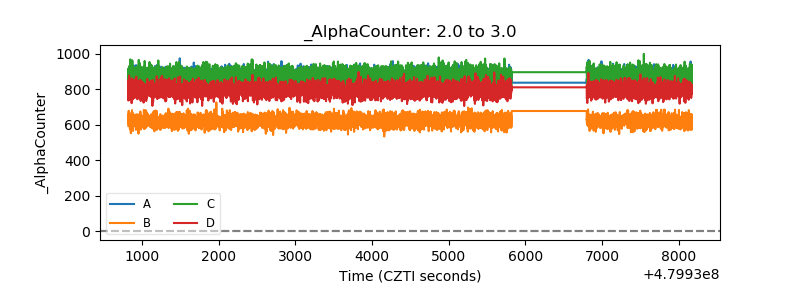 |
| _CPM_Rate | 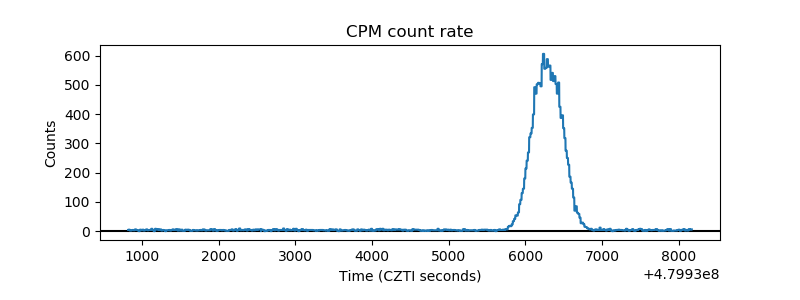 |
| CZT Counter | 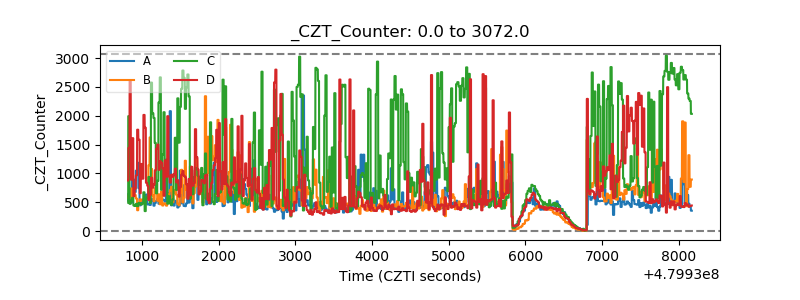 |
| +2.5 Volts monitor | 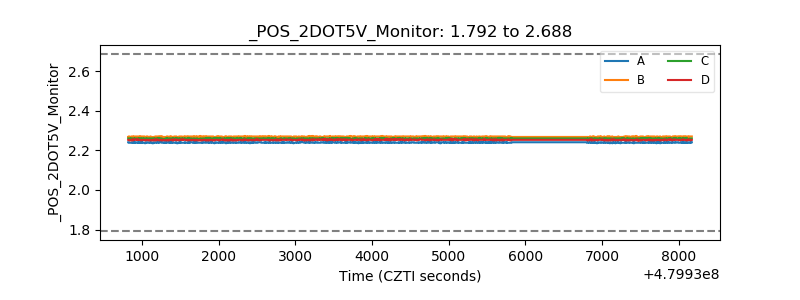 |
| +5 Volts monitor | 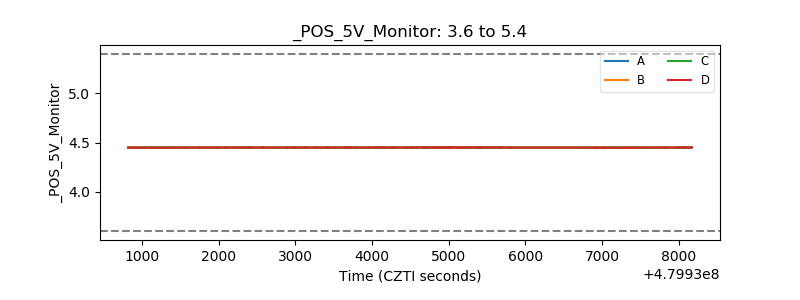 |
| _ROLL_ROT | 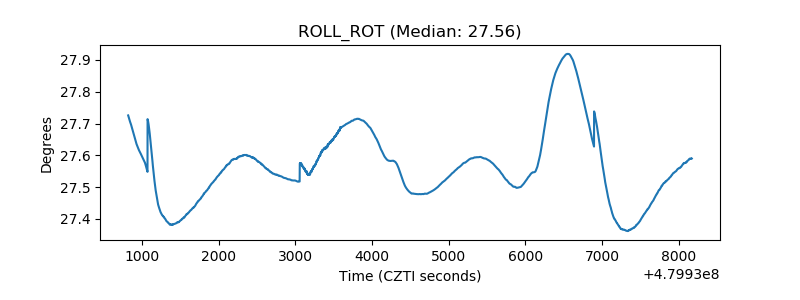 |
| _Roll_DEC | 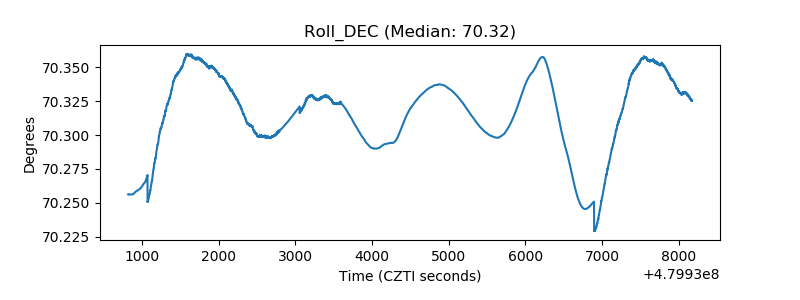 |
| _Roll_RA | 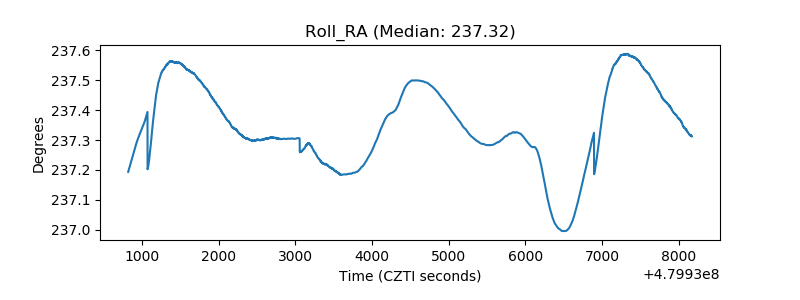 |
| Veto Counter | 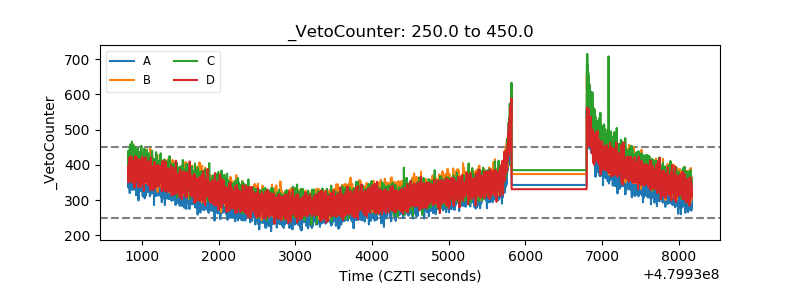 |