| Param | Original file | Final file |
|---|---|---|
| Filename | modeM0/AS1C07_001T01_9000006454_51217cztM0_level2.fits | modeM0/AS1C07_001T01_9000006454_51217cztM0_level2_quad_clean.evt |
| Size (bytes) | 581,538,240 | 91,244,160 |
| Size | 554.6 MB | 87.0 MB |
| Events in quadrant A | 4,344,607 | 612,168 |
| Events in quadrant B | 4,361,065 | 669,655 |
| Events in quadrant C | 7,828,512 | 474,740 |
| Events in quadrant D | 4,488,370 | 552,410 |
| Mode M0 | |||
|---|---|---|---|
| Quadrant | BADHDUFLAG | Total packets | Discarded packets |
| A | 0 | 17295 | 2 |
| B | 0 | 17629 | 2 |
| C | 0 | 27764 | 3 |
| D | 0 | 18155 | 2 |
| Mode SS | |||
|---|---|---|---|
| Quadrant | BADHDUFLAG | Total packets | Discarded packets |
| A | 0 | 136 | 0 |
| B | 0 | 136 | 0 |
| C | 0 | 136 | 0 |
| D | 0 | 136 | 0 |
| Mode M9 | |||
|---|---|---|---|
| Quadrant | BADHDUFLAG | Total packets | Discarded packets |
| A | 0 | 20 | 0 |
| B | 0 | 20 | 0 |
| C | 0 | 20 | 0 |
| D | 0 | 20 | 0 |
| Quadrant | Total seconds | Saturated seconds | Saturation percentage |
|---|---|---|---|
| A | 6499 | 219 | 3.369749% |
| B | 6499 | 260 | 4.000615% |
| C | 6499 | 1685 | 25.927066% |
| D | 6499 | 393 | 6.047084% |
Noise dominated data is calculated using 1-second bins in cleaned event files. If a bin has >2000 counts, and if more than 50% of those come from <1% of pixels, then it is considered to be noise-dominated and hence unusable.
| Quadrant | # 1 sec bins | Bins with >0 counts | Bins with >2000 counts | High rate bins dominated by noise | Noise dominated (total time) | Noise dominated (detector-on time) | Marked lightcurve |
|---|---|---|---|---|---|---|---|
| A | 8544 | 6501 | 135 | 135 | 1.58% | 2.08% | 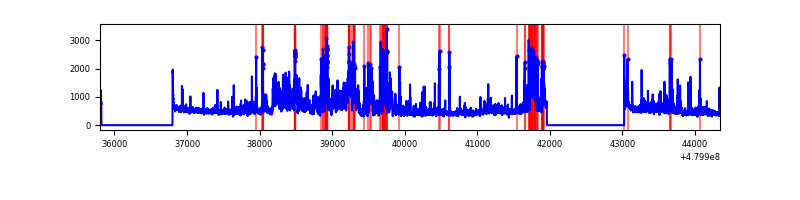 |
| B | 8544 | 6499 | 114 | 114 | 1.33% | 1.75% | 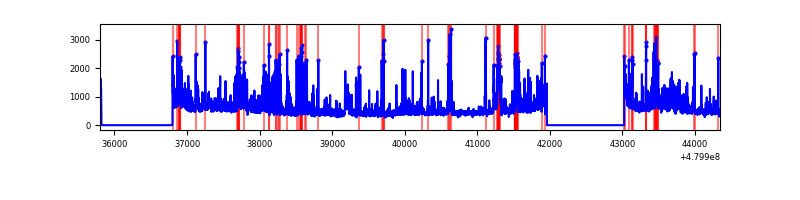 |
| C | 8544 | 6499 | 1573 | 1573 | 18.41% | 24.20% | 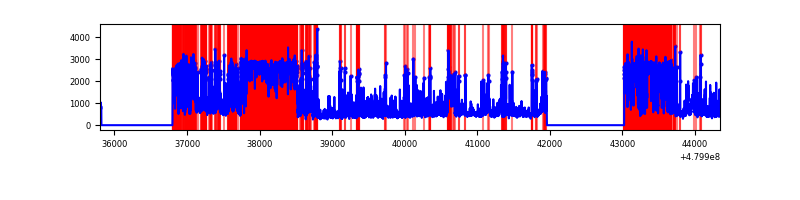 |
| D | 8544 | 6500 | 313 | 313 | 3.66% | 4.82% | 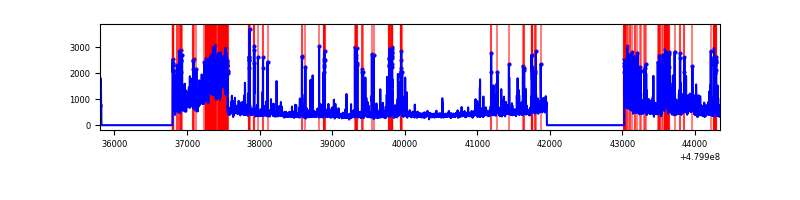 |
Top three noisy pixels from each quadrant. If the there are fewer than three noisy pixels in the level2.evt file, extra rows are filled as -1
| Pixel properties | Quadrant properties | ||||||
|---|---|---|---|---|---|---|---|
| Quadrant | DetID | PixID | Counts | Sigma | Mean | Median | Sigma |
| A | 12 | 3 | 667730 | 3912.73 | 685 | 670 | 170.5 |
| A | 8 | 26 | 222254 | 1299.73 | 685 | 670 | 170.5 |
| A | 4 | 249 | 154432 | 901.91 | 685 | 670 | 170.5 |
| B | 5 | 172 | 311550 | 2106.59 | 690 | 664 | 147.6 |
| B | 4 | 170 | 254797 | 1722.02 | 690 | 664 | 147.6 |
| B | 8 | 128 | 230735 | 1558.98 | 690 | 664 | 147.6 |
| C | 4 | 12 | 2831750 | 17081.11 | 596 | 592 | 165.7 |
| C | 9 | 38 | 1004207 | 6055.07 | 596 | 592 | 165.7 |
| C | 10 | 252 | 858005 | 5172.99 | 596 | 592 | 165.7 |
| D | 3 | 12 | 745502 | 4037.01 | 664 | 641 | 184.5 |
| D | 8 | 176 | 221974 | 1199.58 | 664 | 641 | 184.5 |
| D | 2 | 216 | 175768 | 949.16 | 664 | 641 | 184.5 |
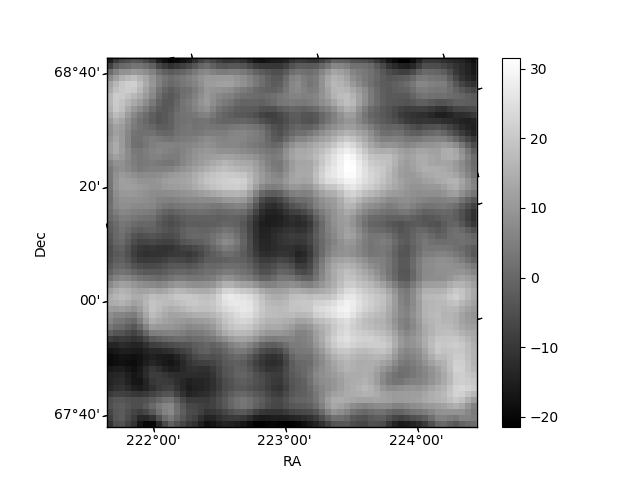
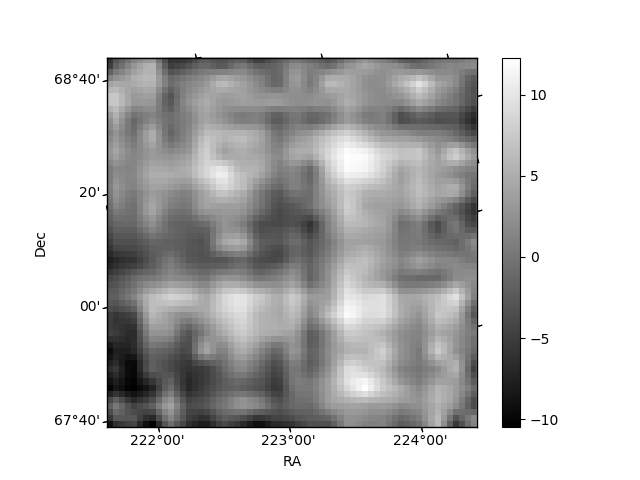
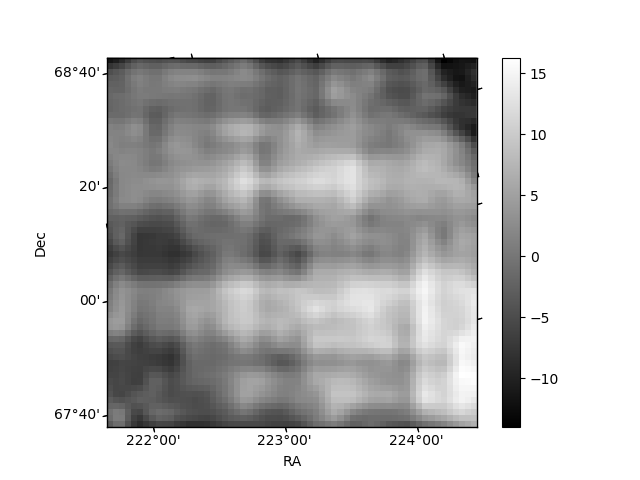
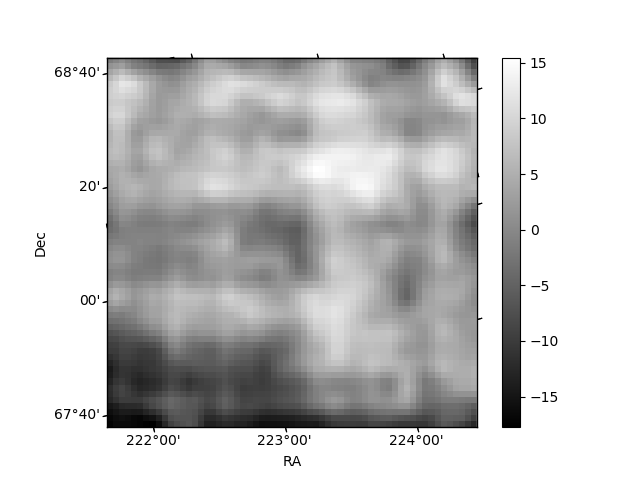
Histogram calculated using DETX and DETY for each event in the final _common_clean file
| Quadrant A | 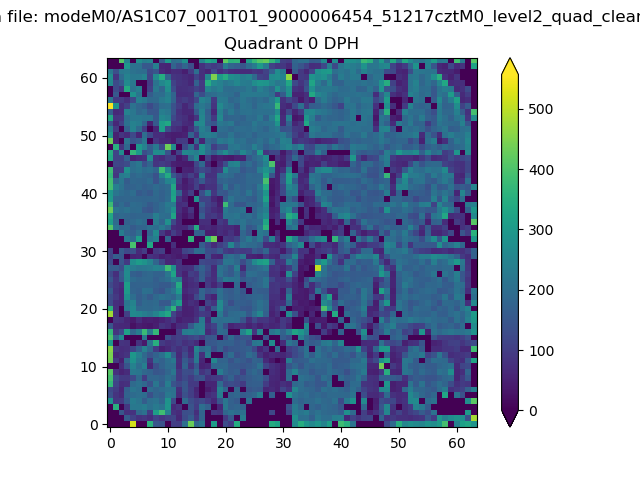 |
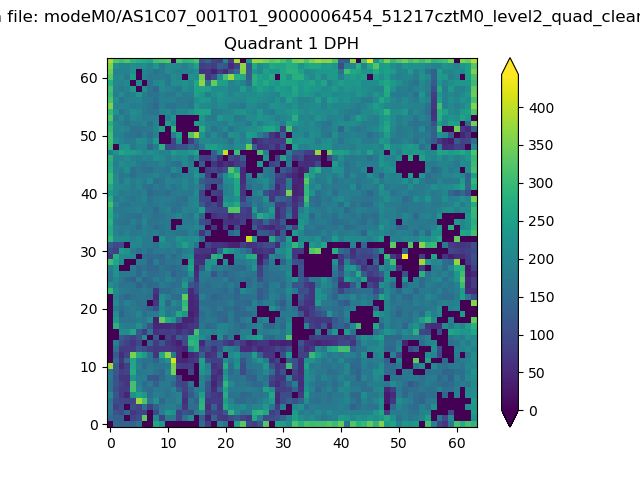 |
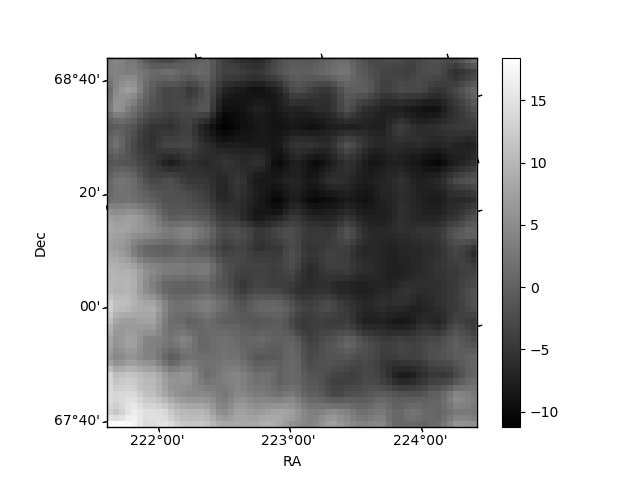
Quadrant B |
|---|---|---|---|
| Quadrant D | 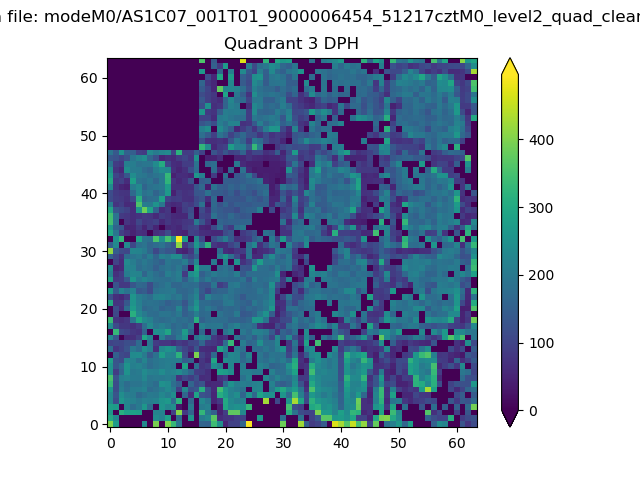 |
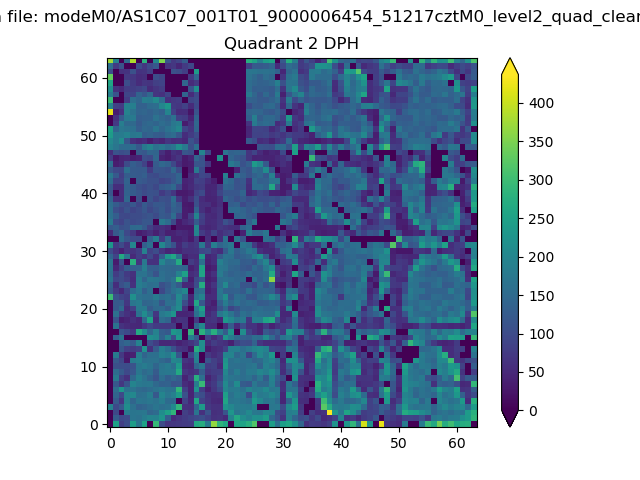 |
Quadrant C |
| Plot type | Count rate plots | Images |
|---|---|---|
| Comparison with Poisson distribution Blue bars denote a histogram of data divided into 1 sec bins. Red curve is a Poisson curve with rate = median count rate of data. |
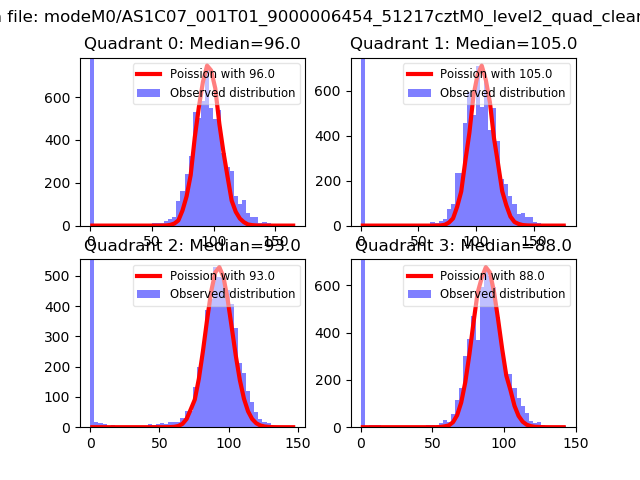 |
 |
| Quadrant-wise count rates Data is divided into 100 sec bins |
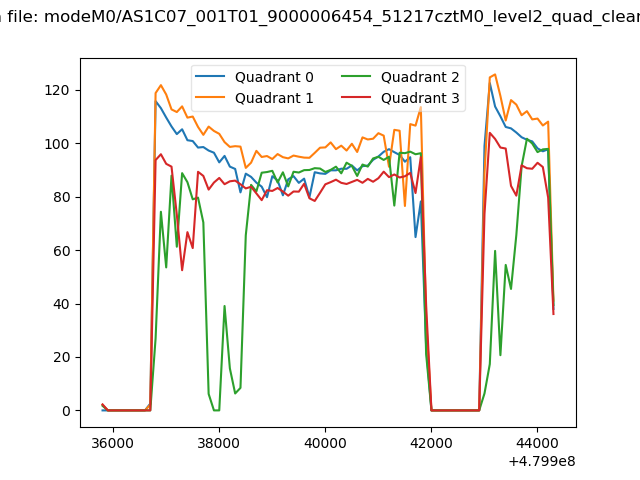 |
|
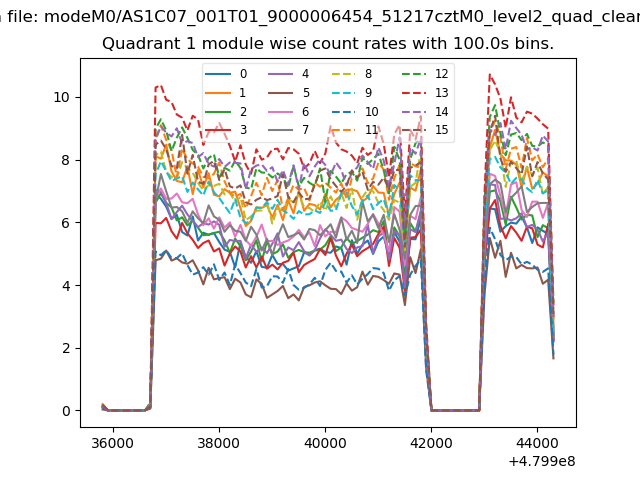
| Module-wise count rates for Quadrant A Data is divided into 100 sec bins |
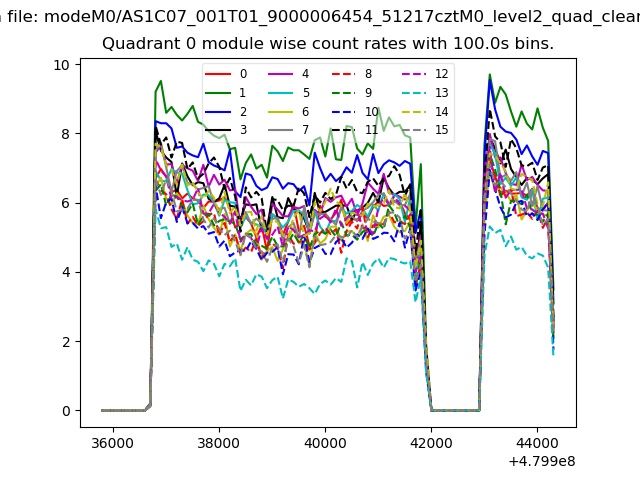 |
 |
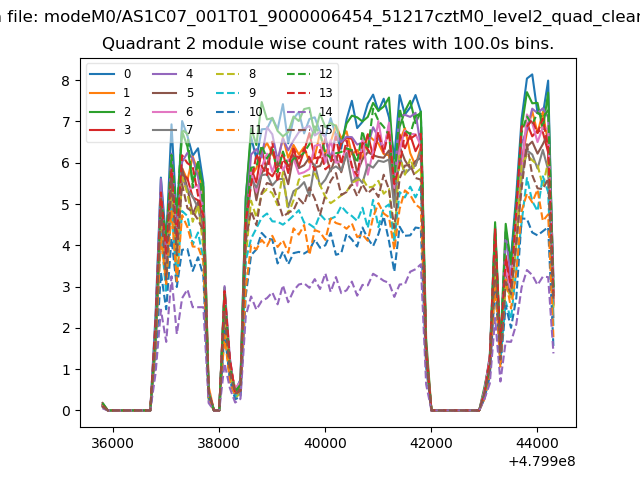
| Module-wise count rates for Quadrant B Data is divided into 100 sec bins |
 |
 |
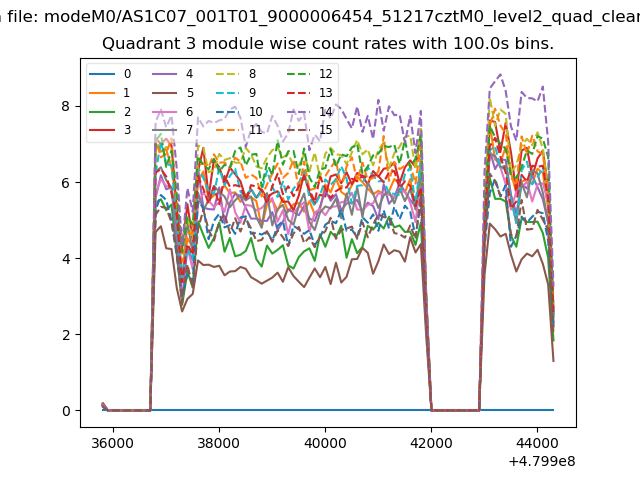
| Module-wise count rates for Quadrant C Data is divided into 100 sec bins |
 |
 |
| Module-wise count rates for Quadrant D Data is divided into 100 sec bins |
 |
 |
| Parameter | Plot |
|---|---|
| CZT HV Monitor |  |
| D_VDD | 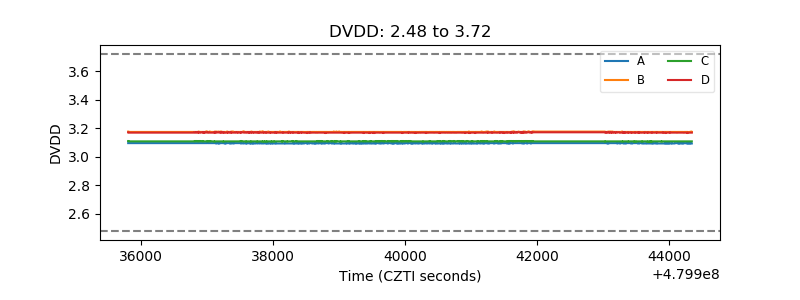 |
| Temperature 1 | 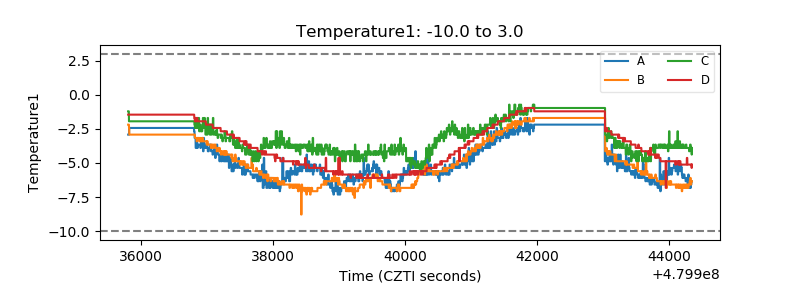 |
| Veto HV Monitor | 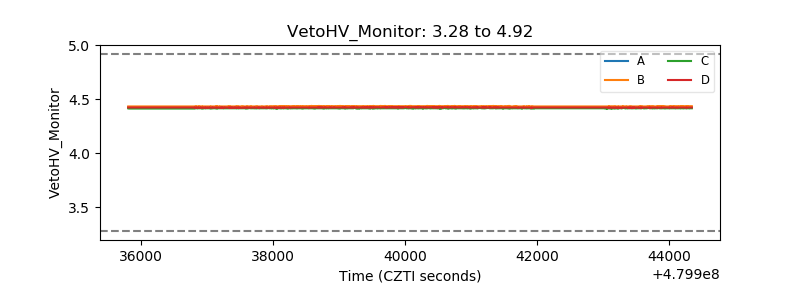 |
| Veto LLD | 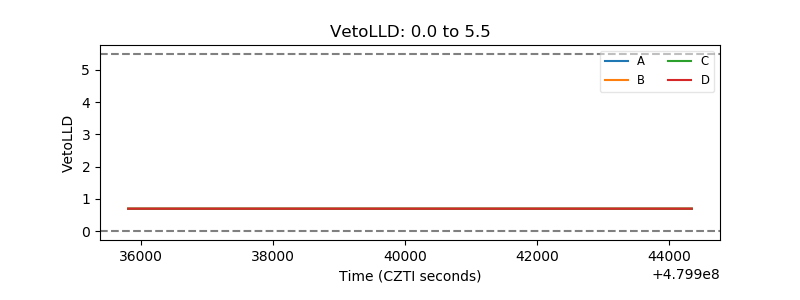 |
| Alpha Counter | 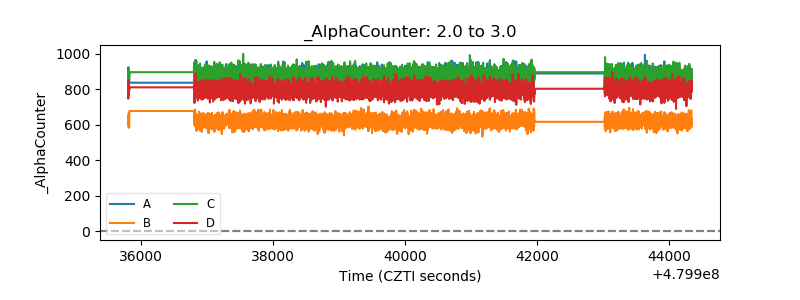 |
| _CPM_Rate | 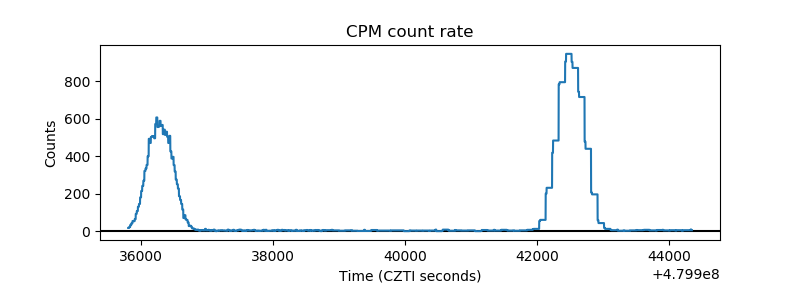 |
| CZT Counter | 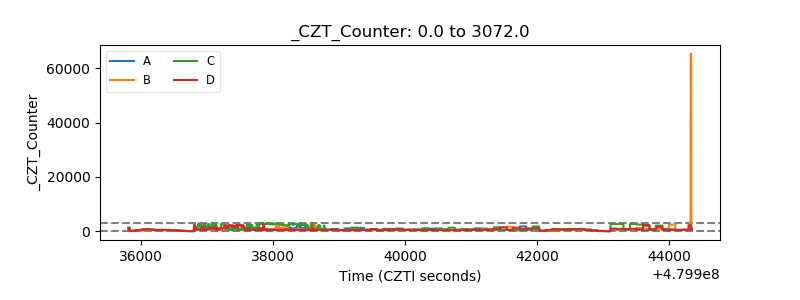 |
| +2.5 Volts monitor | 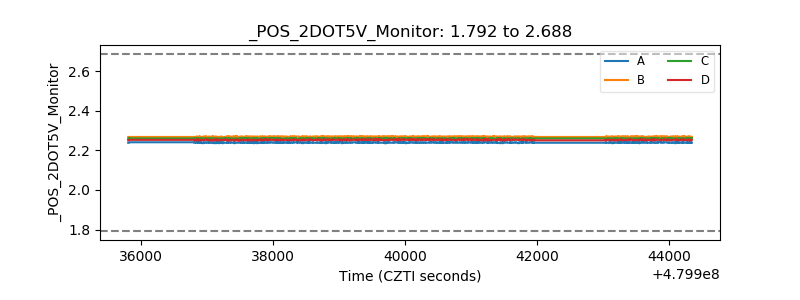 |
| +5 Volts monitor | 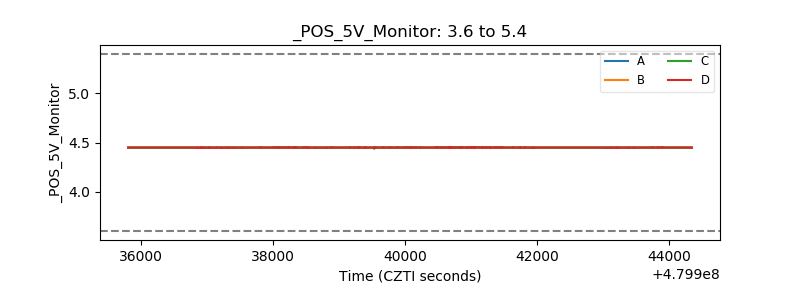 |
| _ROLL_ROT | 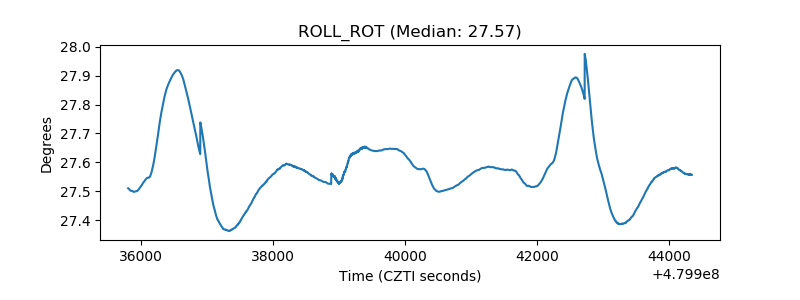 |
| _Roll_DEC | 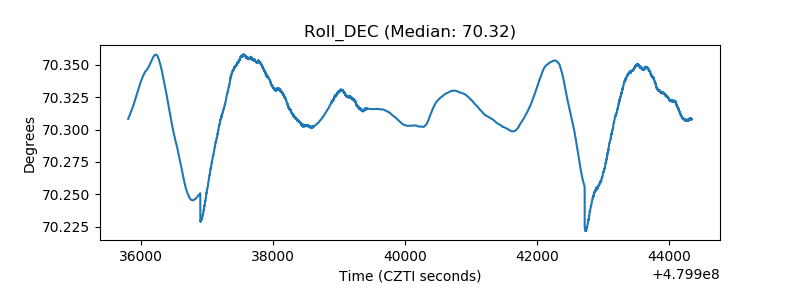 |
| _Roll_RA | 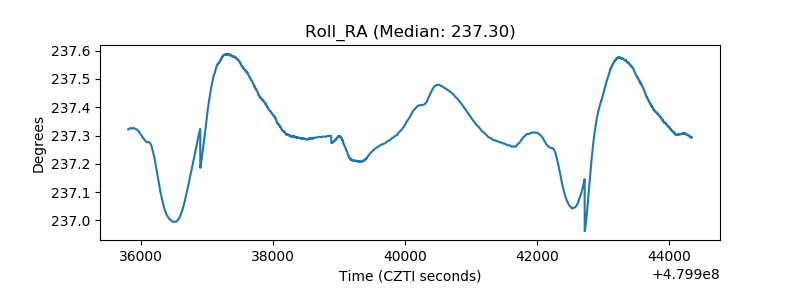 |
| Veto Counter | 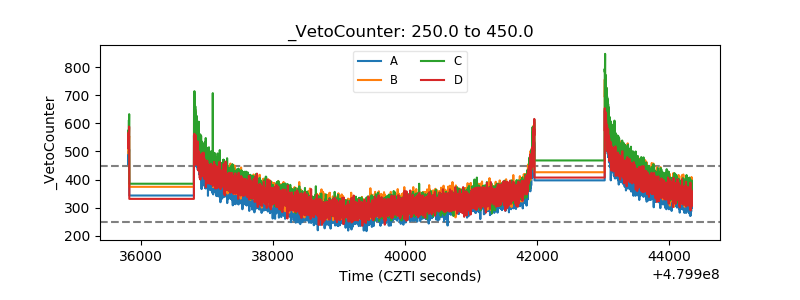 |