| Param | Original file | Final file |
|---|---|---|
| Filename | modeM0/AS1C07_001T01_9000006454_51218cztM0_level2.fits | modeM0/AS1C07_001T01_9000006454_51218cztM0_level2_quad_clean.evt |
| Size (bytes) | 519,845,760 | 93,142,080 |
| Size | 495.8 MB | 88.8 MB |
| Events in quadrant A | 3,661,095 | 622,779 |
| Events in quadrant B | 4,335,700 | 665,693 |
| Events in quadrant C | 6,879,631 | 520,715 |
| Events in quadrant D | 3,869,947 | 564,726 |
| Mode M0 | |||
|---|---|---|---|
| Quadrant | BADHDUFLAG | Total packets | Discarded packets |
| A | 0 | 15428 | 2 |
| B | 0 | 17458 | 2 |
| C | 0 | 24869 | 2 |
| D | 0 | 16248 | 2 |
| Mode SS | |||
|---|---|---|---|
| Quadrant | BADHDUFLAG | Total packets | Discarded packets |
| A | 0 | 130 | 0 |
| B | 0 | 130 | 0 |
| C | 0 | 130 | 0 |
| D | 0 | 130 | 0 |
| Mode M9 | |||
|---|---|---|---|
| Quadrant | BADHDUFLAG | Total packets | Discarded packets |
| A | 0 | 16 | 0 |
| B | 0 | 17 | 0 |
| C | 0 | 17 | 0 |
| D | 0 | 17 | 0 |
| Quadrant | Total seconds | Saturated seconds | Saturation percentage |
|---|---|---|---|
| A | 6396 | 110 | 1.719825% |
| B | 6396 | 302 | 4.721701% |
| C | 6396 | 1214 | 18.980613% |
| D | 6396 | 213 | 3.330206% |
Noise dominated data is calculated using 1-second bins in cleaned event files. If a bin has >2000 counts, and if more than 50% of those come from <1% of pixels, then it is considered to be noise-dominated and hence unusable.
| Quadrant | # 1 sec bins | Bins with >0 counts | Bins with >2000 counts | High rate bins dominated by noise | Noise dominated (total time) | Noise dominated (detector-on time) | Marked lightcurve |
|---|---|---|---|---|---|---|---|
| A | 7556 | 6397 | 66 | 66 | 0.87% | 1.03% | 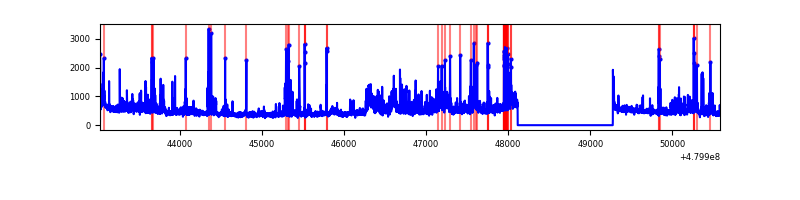 |
| B | 7556 | 6396 | 121 | 121 | 1.60% | 1.89% | 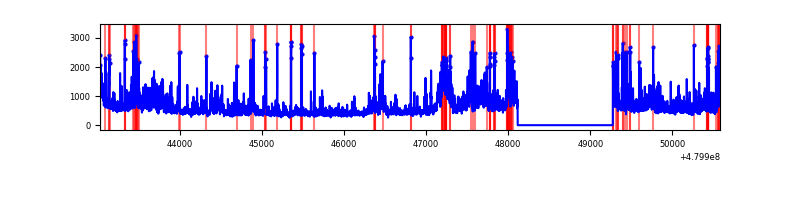 |
| C | 7556 | 6396 | 1169 | 1169 | 15.47% | 18.28% | 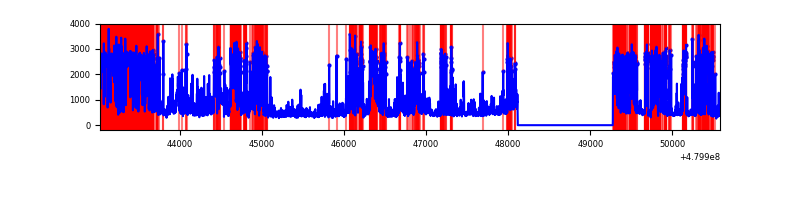 |
| D | 7556 | 6397 | 172 | 172 | 2.28% | 2.69% | 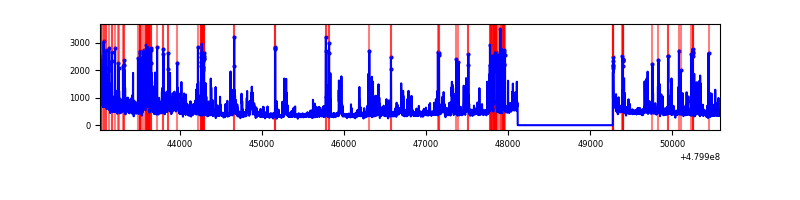 |
Top three noisy pixels from each quadrant. If the there are fewer than three noisy pixels in the level2.evt file, extra rows are filled as -1
| Pixel properties | Quadrant properties | ||||||
|---|---|---|---|---|---|---|---|
| Quadrant | DetID | PixID | Counts | Sigma | Mean | Median | Sigma |
| A | 12 | 3 | 288129 | 1711.22 | 679 | 662 | 168.0 |
| A | 8 | 26 | 146445 | 867.81 | 679 | 662 | 168.0 |
| A | 5 | 240 | 104571 | 618.55 | 679 | 662 | 168.0 |
| B | 10 | 254 | 365128 | 2522.29 | 678 | 655 | 144.5 |
| B | 5 | 172 | 341704 | 2360.19 | 678 | 655 | 144.5 |
| B | 4 | 170 | 179106 | 1234.95 | 678 | 655 | 144.5 |
| C | 4 | 12 | 3281849 | 19337.44 | 612 | 607 | 169.7 |
| C | 13 | 3 | 314379 | 1849.16 | 612 | 607 | 169.7 |
| C | 10 | 252 | 308130 | 1812.33 | 612 | 607 | 169.7 |
| D | 3 | 12 | 291436 | 1581.82 | 651 | 626 | 183.8 |
| D | 11 | 176 | 189214 | 1025.8 | 651 | 626 | 183.8 |
| D | 8 | 176 | 168809 | 914.81 | 651 | 626 | 183.8 |
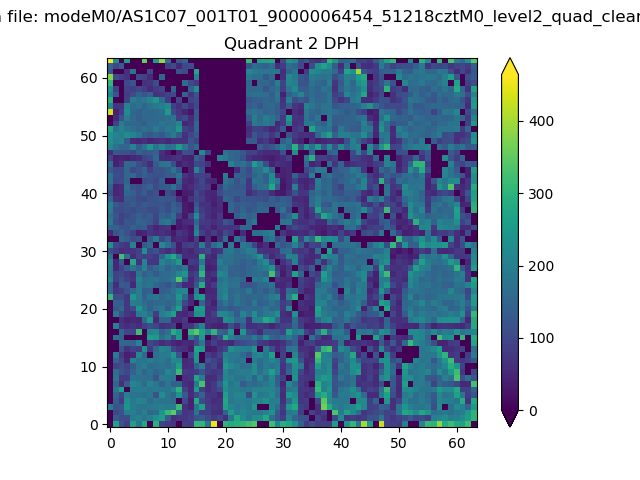
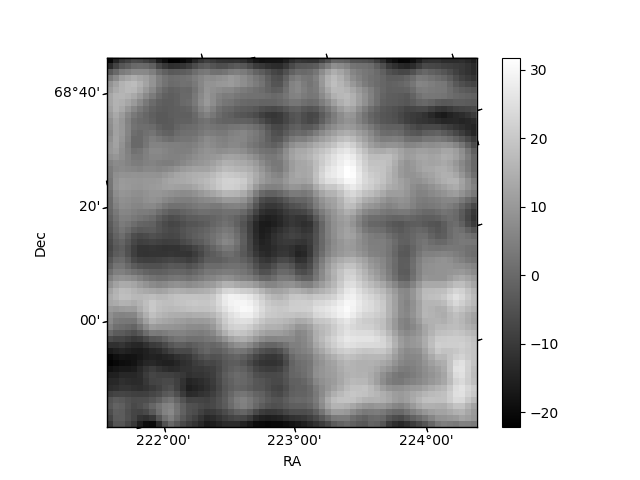
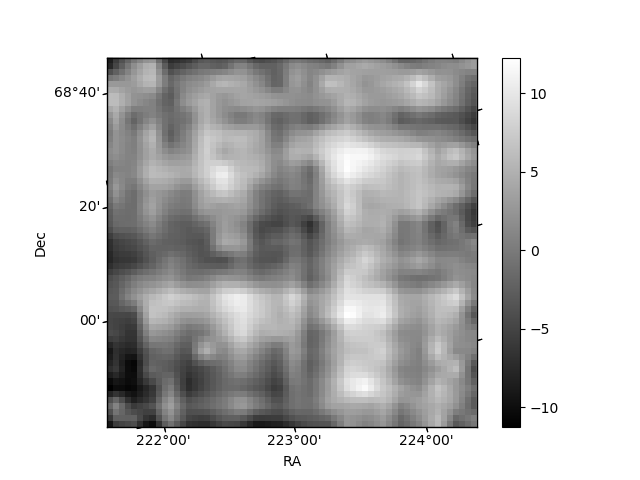
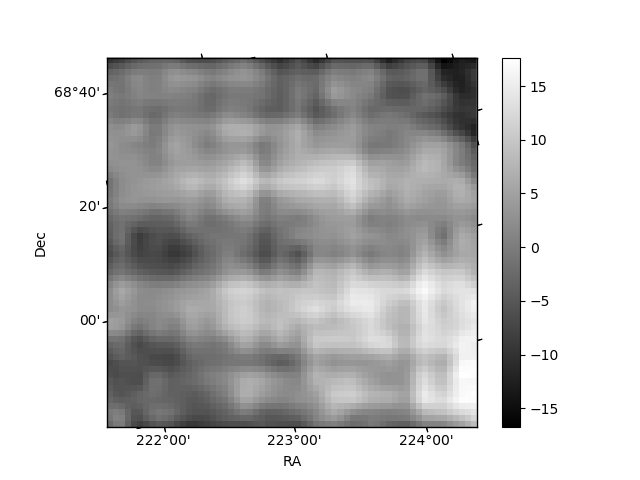
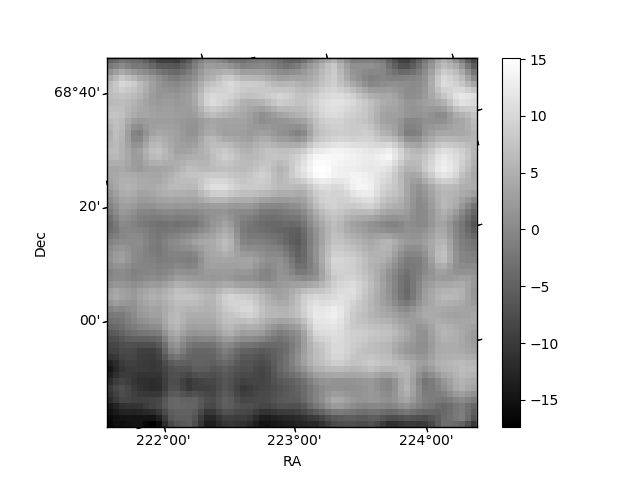
Histogram calculated using DETX and DETY for each event in the final _common_clean file
| Quadrant A | 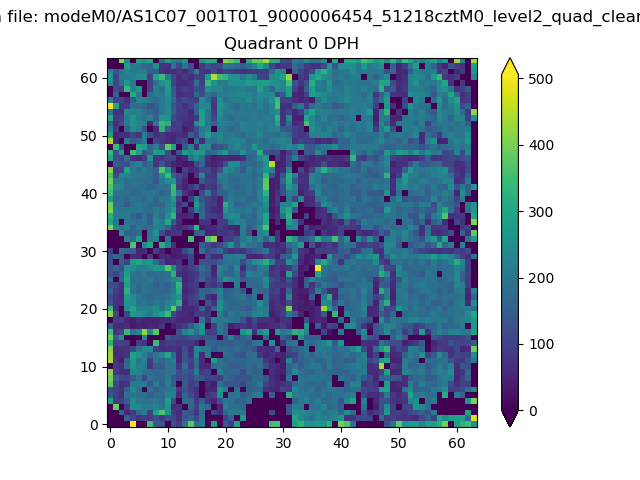 |
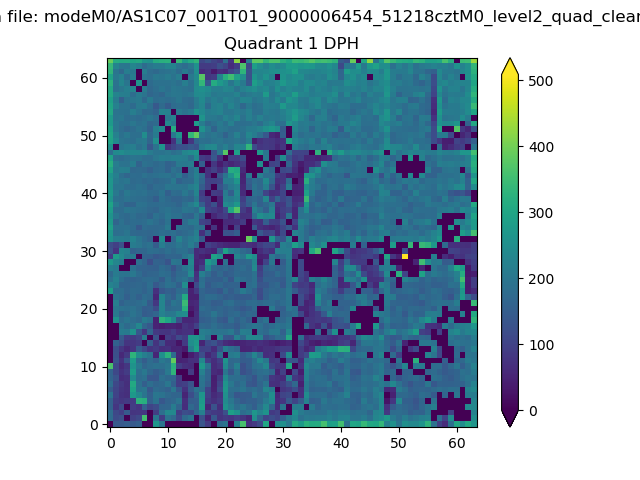 |
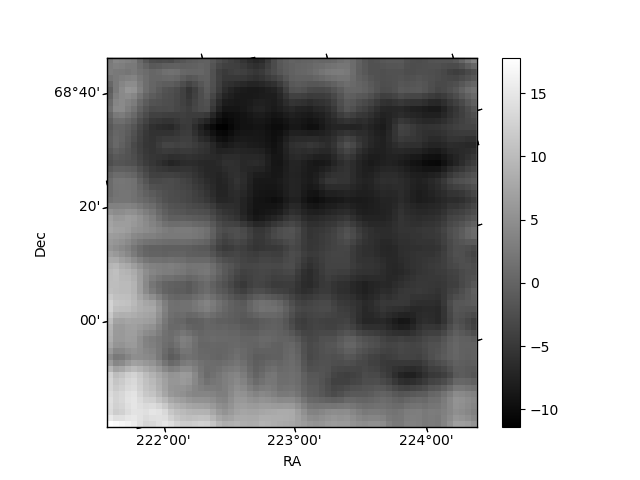
Quadrant B |
|---|---|---|---|
| Quadrant D | 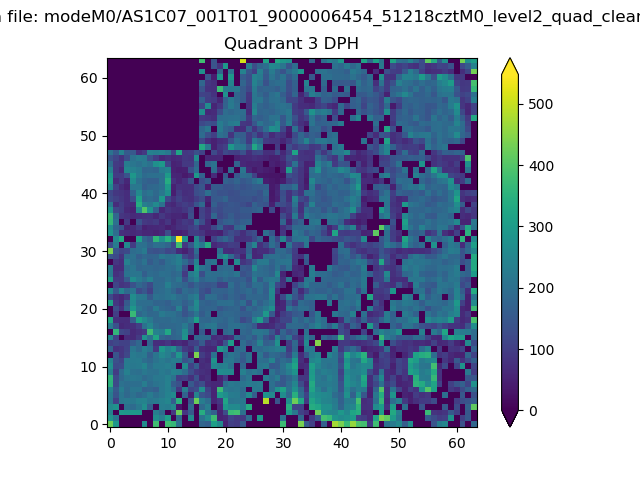 |
 |
Quadrant C |
| Plot type | Count rate plots | Images |
|---|---|---|
| Comparison with Poisson distribution Blue bars denote a histogram of data divided into 1 sec bins. Red curve is a Poisson curve with rate = median count rate of data. |
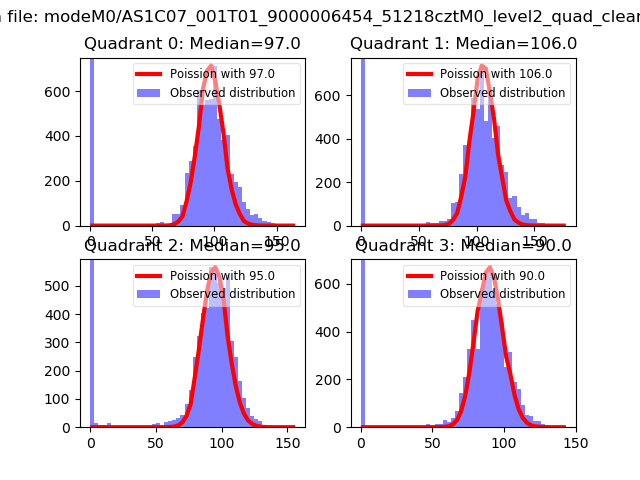 |
 |
| Quadrant-wise count rates Data is divided into 100 sec bins |
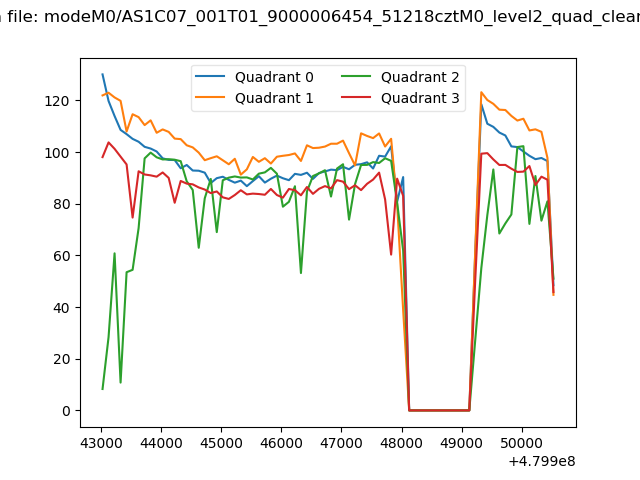 |
|
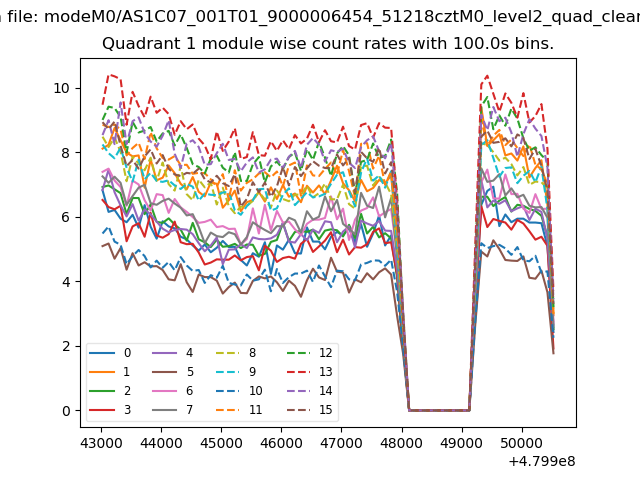
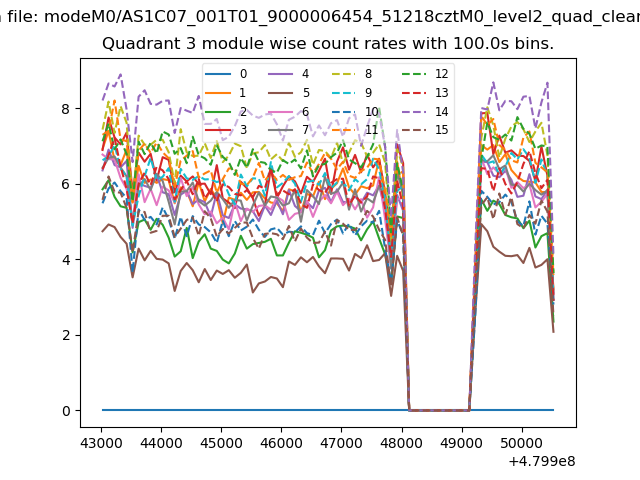
| Module-wise count rates for Quadrant A Data is divided into 100 sec bins |
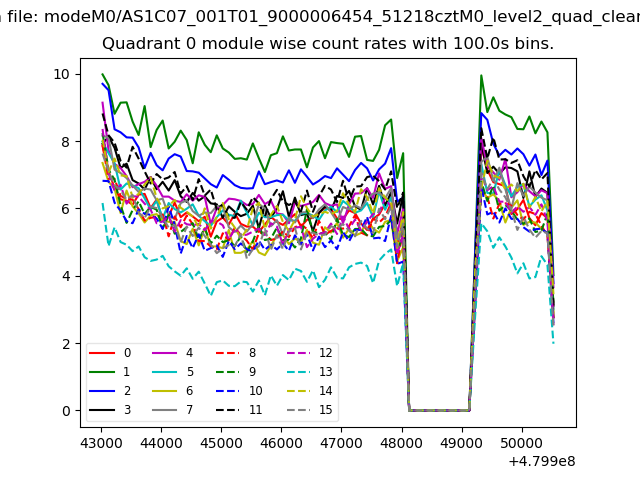 |
 |
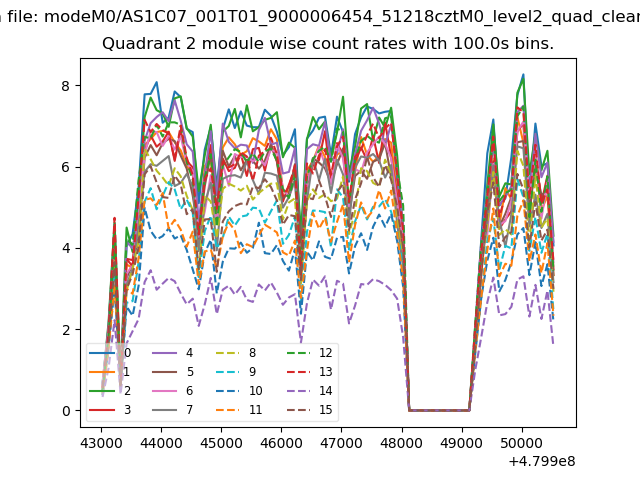
| Module-wise count rates for Quadrant B Data is divided into 100 sec bins |
 |
 |
| Module-wise count rates for Quadrant C Data is divided into 100 sec bins |
 |
 |
| Module-wise count rates for Quadrant D Data is divided into 100 sec bins |
 |
 |
| Parameter | Plot |
|---|---|
| CZT HV Monitor | 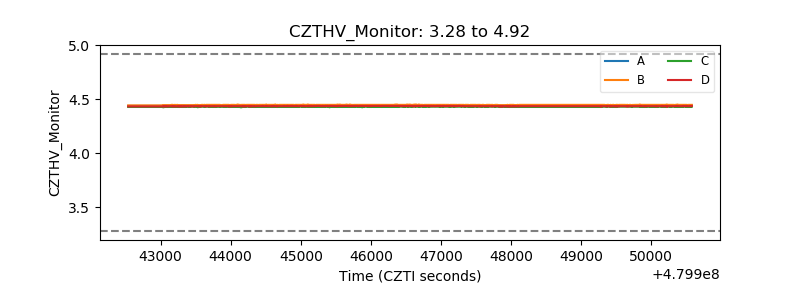 |
| D_VDD | 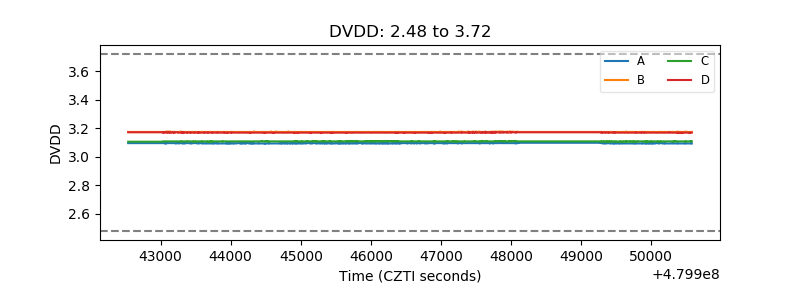 |
| Temperature 1 | 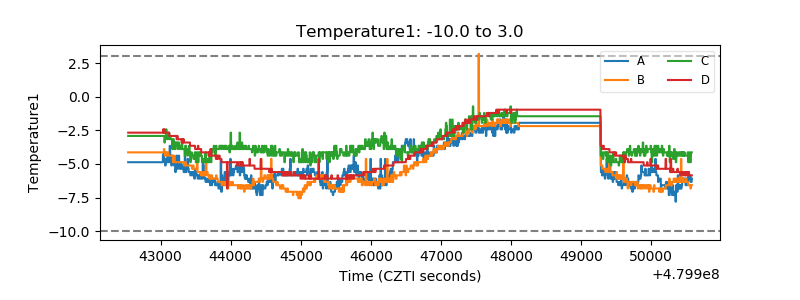 |
| Veto HV Monitor | 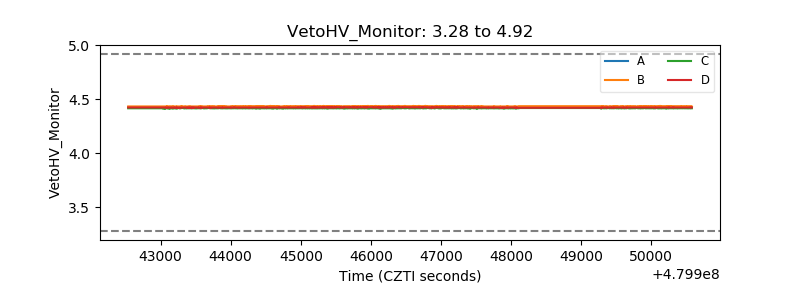 |
| Veto LLD | 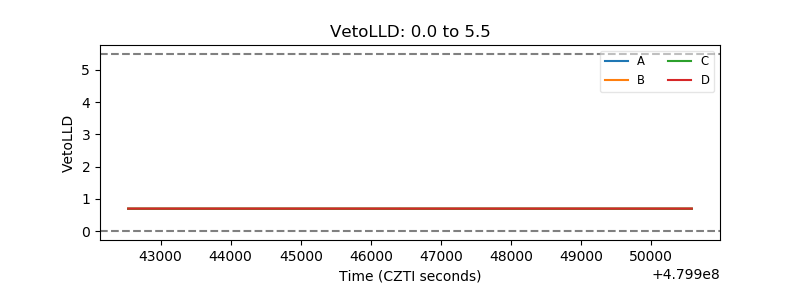 |
| Alpha Counter | 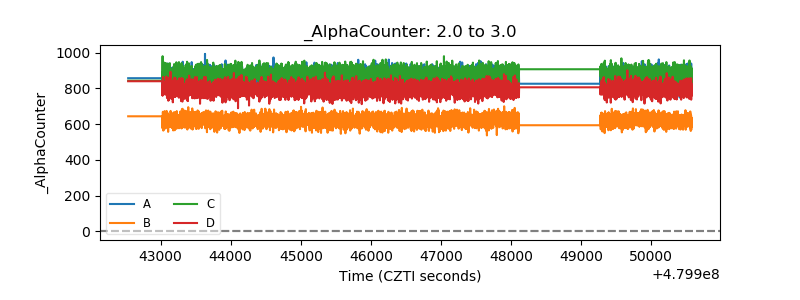 |
| _CPM_Rate | 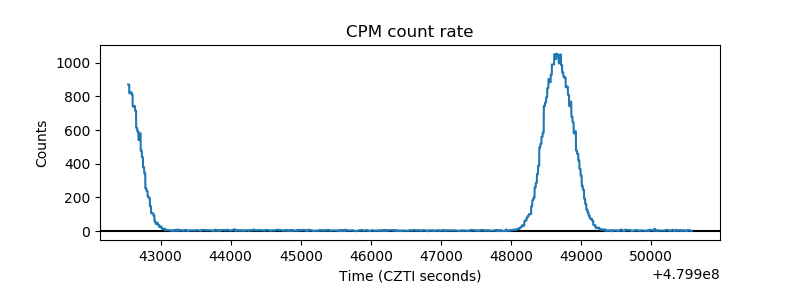 |
| CZT Counter | 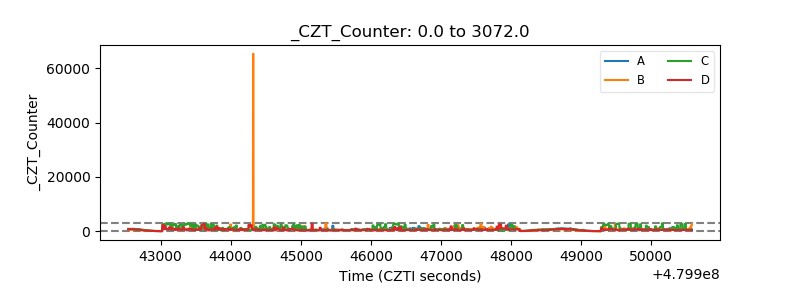 |
| +2.5 Volts monitor | 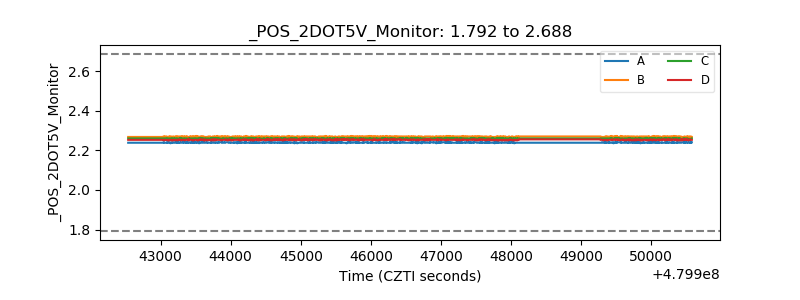 |
| +5 Volts monitor | 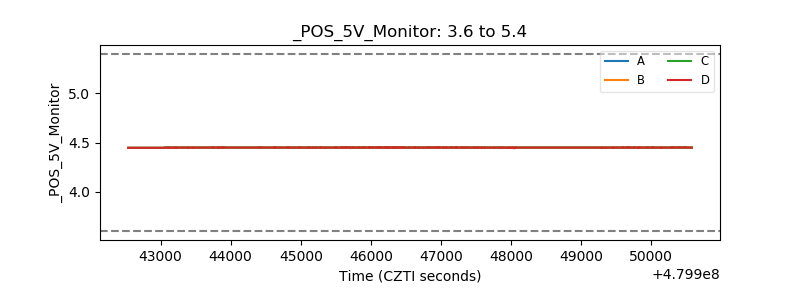 |
| _ROLL_ROT | 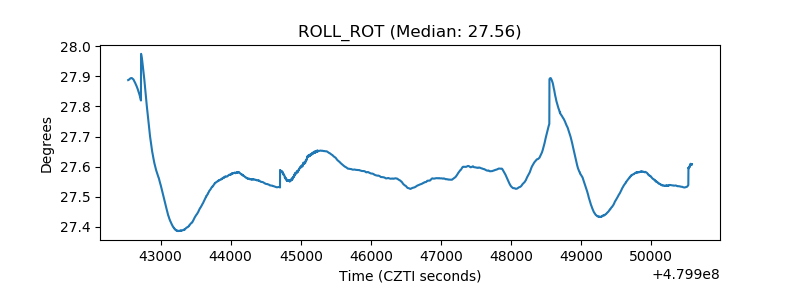 |
| _Roll_DEC | 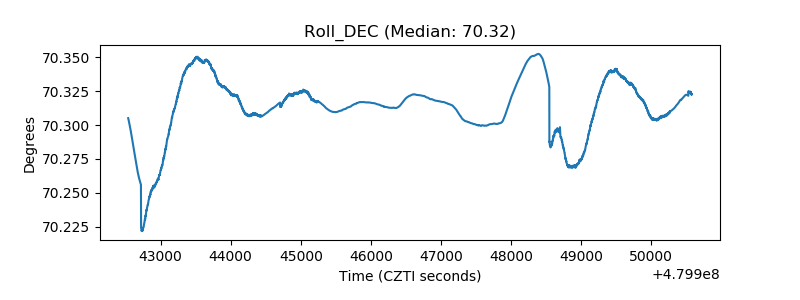 |
| _Roll_RA |  |
| Veto Counter | 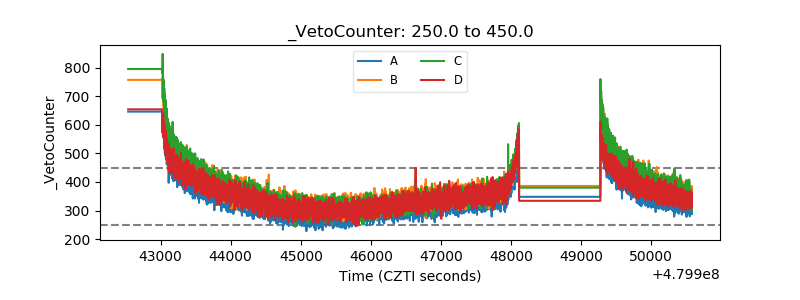 |