| Param | Original file | Final file |
|---|---|---|
| Filename | modeM0/AS1C07_001T01_9000006454_51219cztM0_level2.fits | modeM0/AS1C07_001T01_9000006454_51219cztM0_level2_quad_clean.evt |
| Size (bytes) | 615,375,360 | 101,482,560 |
| Size | 586.9 MB | 96.8 MB |
| Events in quadrant A | 4,688,330 | 677,599 |
| Events in quadrant B | 5,664,341 | 721,899 |
| Events in quadrant C | 7,798,380 | 551,008 |
| Events in quadrant D | 4,075,989 | 626,659 |
| Mode M0 | |||
|---|---|---|---|
| Quadrant | BADHDUFLAG | Total packets | Discarded packets |
| A | 0 | 18923 | 2 |
| B | 0 | 21715 | 2 |
| C | 0 | 28055 | 2 |
| D | 0 | 17445 | 2 |
| Mode SS | |||
|---|---|---|---|
| Quadrant | BADHDUFLAG | Total packets | Discarded packets |
| A | 0 | 146 | 0 |
| B | 0 | 146 | 0 |
| C | 0 | 146 | 0 |
| D | 0 | 146 | 0 |
| Mode M9 | |||
|---|---|---|---|
| Quadrant | BADHDUFLAG | Total packets | Discarded packets |
| A | 0 | 24 | 0 |
| B | 0 | 24 | 0 |
| C | 0 | 24 | 0 |
| D | 0 | 24 | 0 |
| Quadrant | Total seconds | Saturated seconds | Saturation percentage |
|---|---|---|---|
| A | 7117 | 282 | 3.962344% |
| B | 7117 | 569 | 7.994942% |
| C | 7118 | 1568 | 22.028660% |
| D | 7118 | 205 | 2.880022% |
Noise dominated data is calculated using 1-second bins in cleaned event files. If a bin has >2000 counts, and if more than 50% of those come from <1% of pixels, then it is considered to be noise-dominated and hence unusable.
| Quadrant | # 1 sec bins | Bins with >0 counts | Bins with >2000 counts | High rate bins dominated by noise | Noise dominated (total time) | Noise dominated (detector-on time) | Marked lightcurve |
|---|---|---|---|---|---|---|---|
| A | 9452 | 7119 | 224 | 224 | 2.37% | 3.15% | 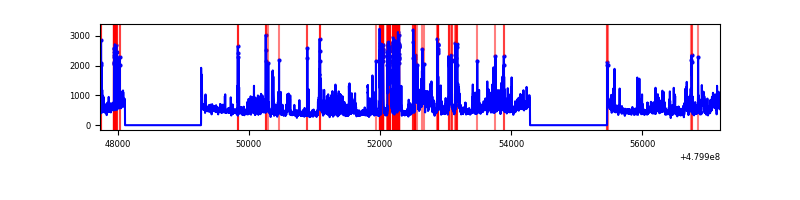 |
| B | 9452 | 7117 | 304 | 304 | 3.22% | 4.27% | 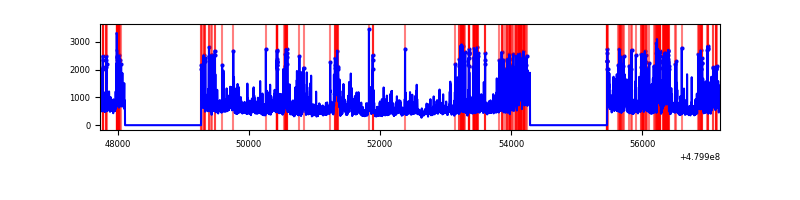 |
| C | 9452 | 7118 | 1458 | 1458 | 15.43% | 20.48% | 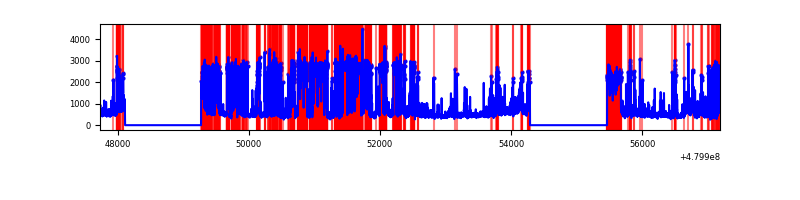 |
| D | 9453 | 7120 | 150 | 150 | 1.59% | 2.11% | 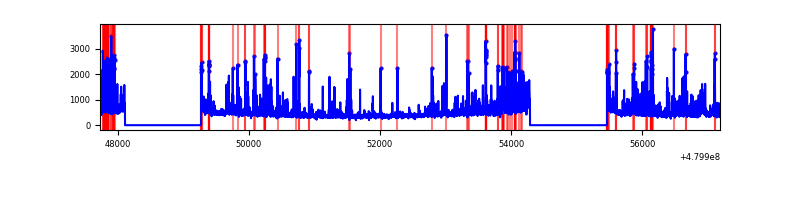 |
Top three noisy pixels from each quadrant. If the there are fewer than three noisy pixels in the level2.evt file, extra rows are filled as -1
| Pixel properties | Quadrant properties | ||||||
|---|---|---|---|---|---|---|---|
| Quadrant | DetID | PixID | Counts | Sigma | Mean | Median | Sigma |
| A | 8 | 26 | 598848 | 3227.65 | 747 | 731 | 185.3 |
| A | 12 | 3 | 474073 | 2554.32 | 747 | 731 | 185.3 |
| A | 13 | 164 | 271200 | 1459.55 | 747 | 731 | 185.3 |
| B | 5 | 185 | 677961 | 4289.4 | 744 | 718 | 157.9 |
| B | 10 | 254 | 492605 | 3115.43 | 744 | 718 | 157.9 |
| B | 8 | 128 | 322398 | 2037.4 | 744 | 718 | 157.9 |
| C | 4 | 12 | 3657716 | 19609.21 | 674 | 667 | 186.5 |
| C | 10 | 252 | 559680 | 2997.44 | 674 | 667 | 186.5 |
| C | 9 | 38 | 337753 | 1807.47 | 674 | 667 | 186.5 |
| D | 3 | 12 | 201285 | 987.1 | 721 | 695 | 203.2 |
| D | 8 | 176 | 177003 | 867.61 | 721 | 695 | 203.2 |
| D | 2 | 153 | 157460 | 771.44 | 721 | 695 | 203.2 |
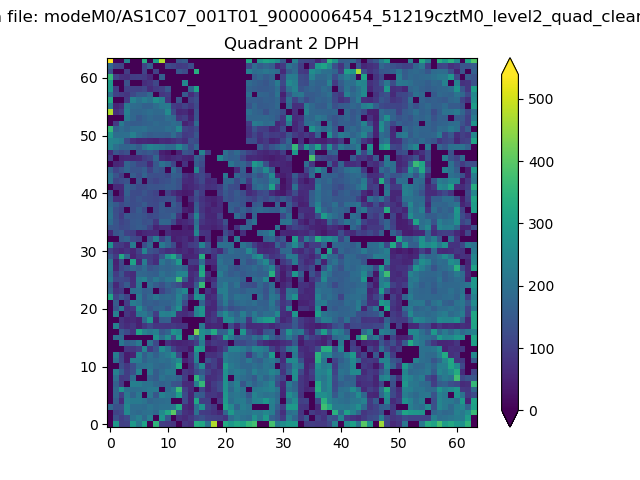
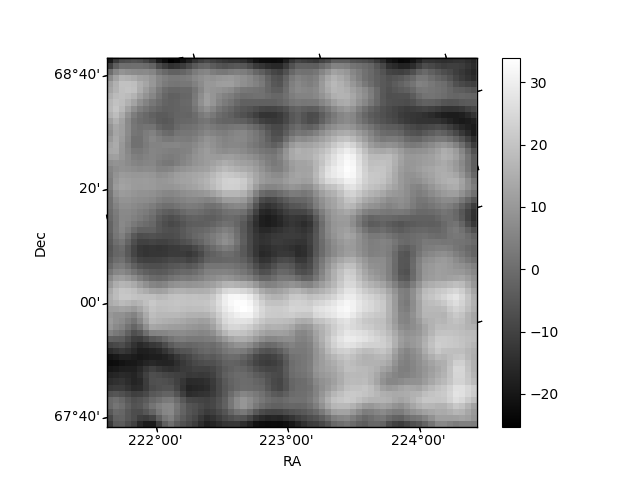
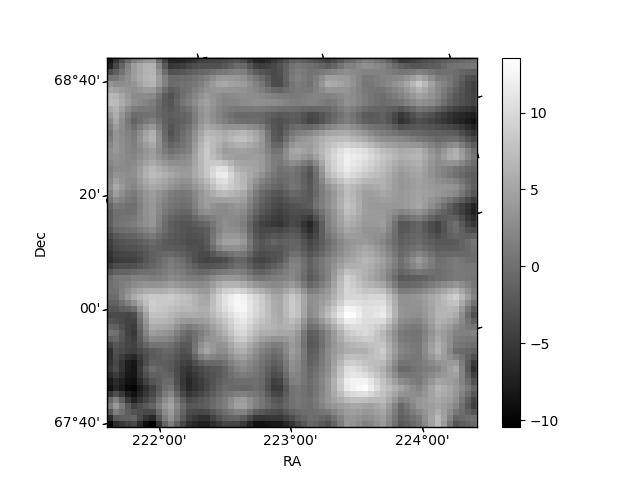
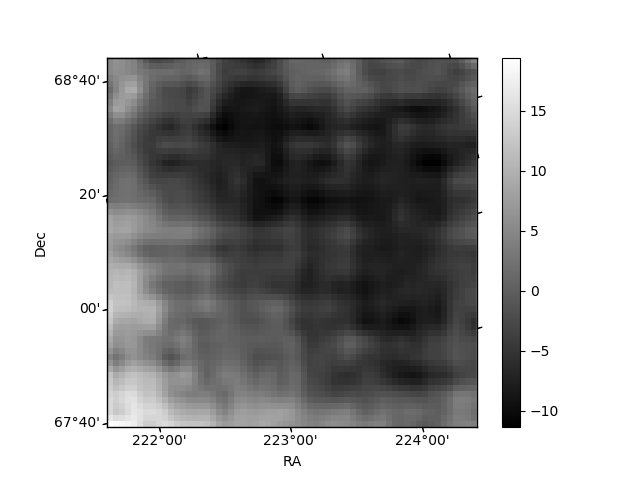
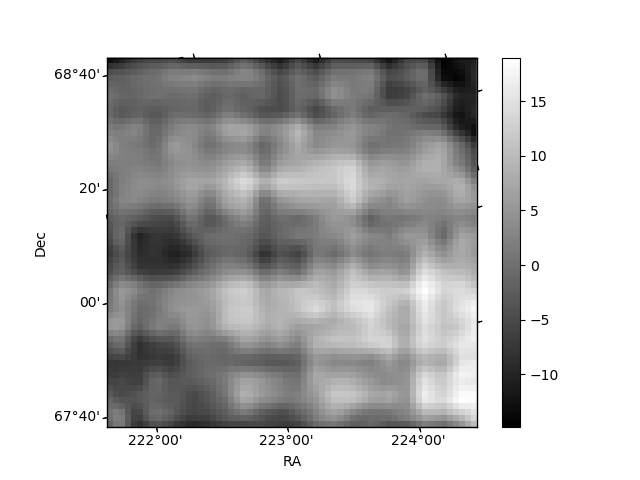
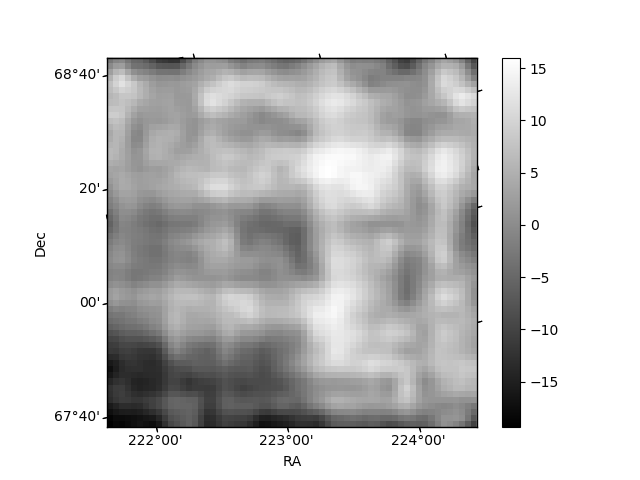
Histogram calculated using DETX and DETY for each event in the final _common_clean file
| Quadrant A | 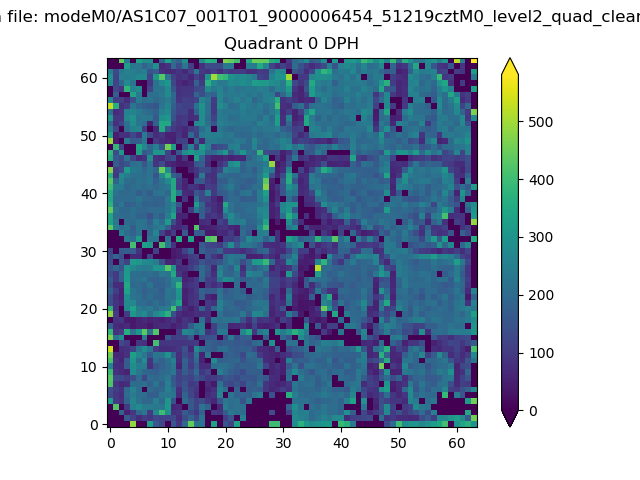 |
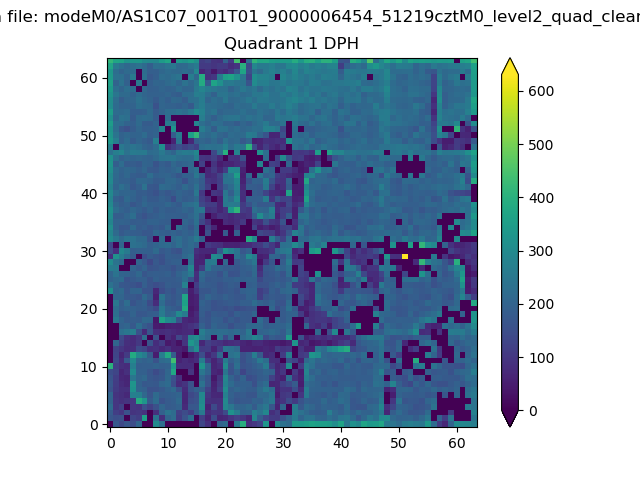 |
Quadrant B |
|---|---|---|---|
| Quadrant D | 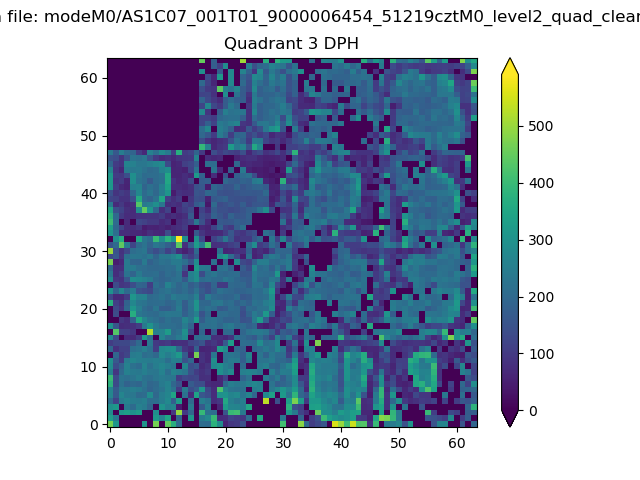 |
 |
Quadrant C |
| Plot type | Count rate plots | Images |
|---|---|---|
| Comparison with Poisson distribution Blue bars denote a histogram of data divided into 1 sec bins. Red curve is a Poisson curve with rate = median count rate of data. |
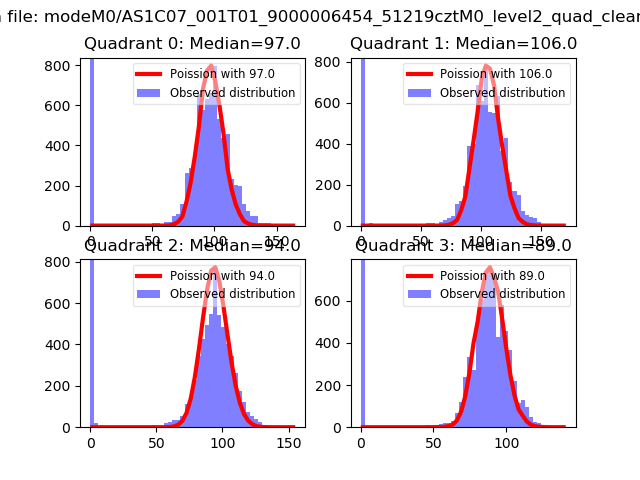 |
 |
| Quadrant-wise count rates Data is divided into 100 sec bins |
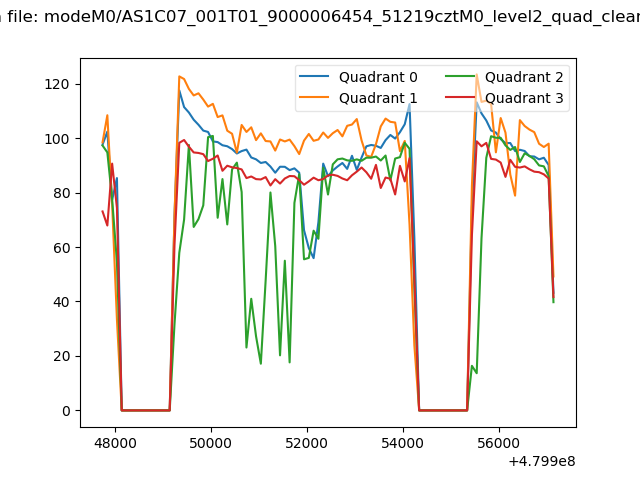 |
|
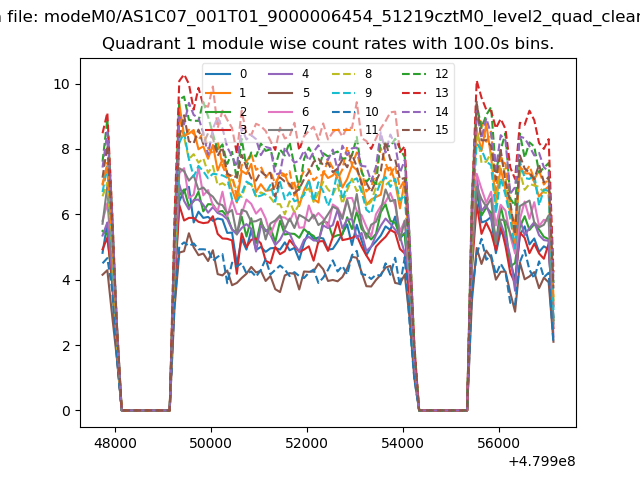
| Module-wise count rates for Quadrant A Data is divided into 100 sec bins |
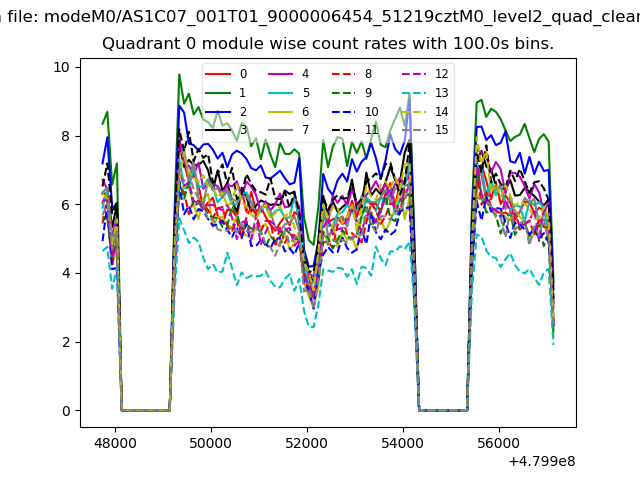 |
 |
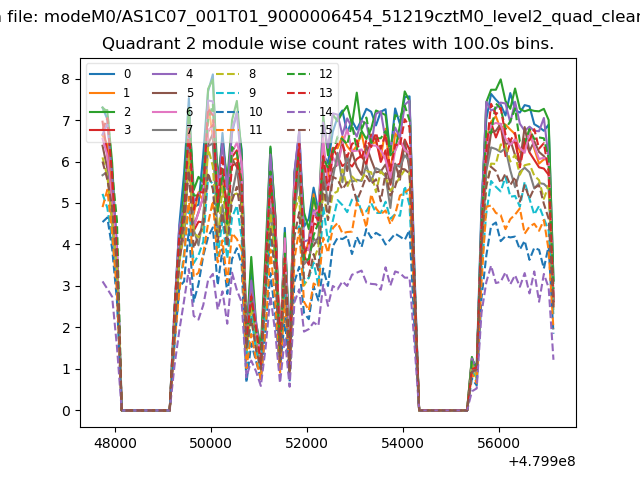
| Module-wise count rates for Quadrant B Data is divided into 100 sec bins |
 |
 |
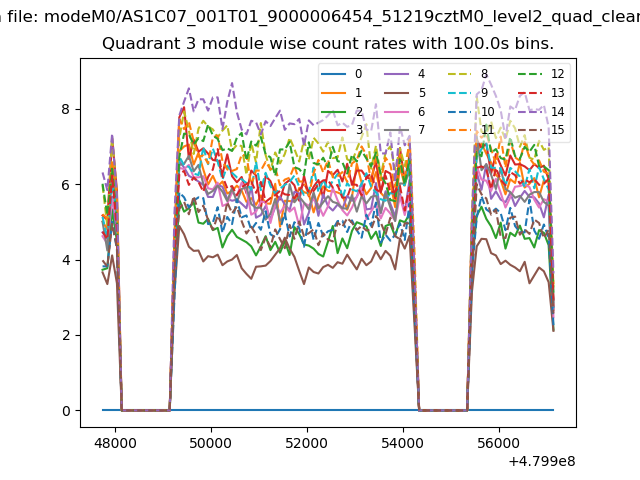
| Module-wise count rates for Quadrant C Data is divided into 100 sec bins |
 |
 |
| Module-wise count rates for Quadrant D Data is divided into 100 sec bins |
 |
 |
| Parameter | Plot |
|---|---|
| CZT HV Monitor | 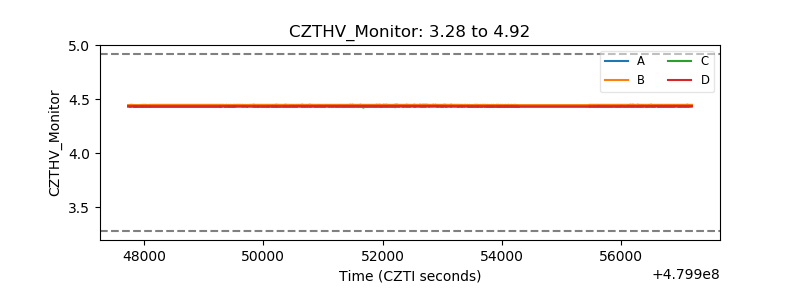 |
| D_VDD | 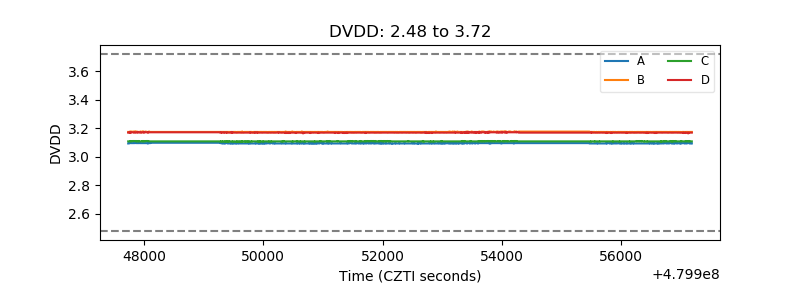 |
| Temperature 1 | 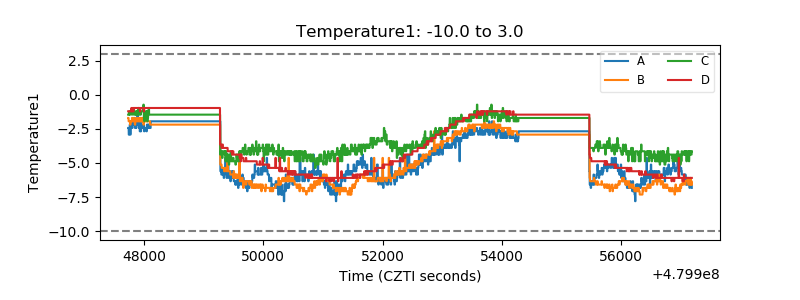 |
| Veto HV Monitor |  |
| Veto LLD | 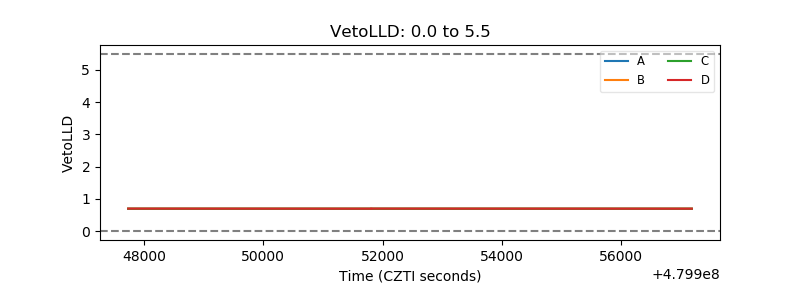 |
| Alpha Counter | 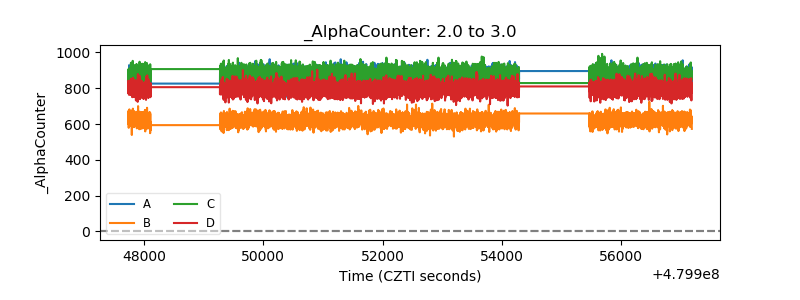 |
| _CPM_Rate | 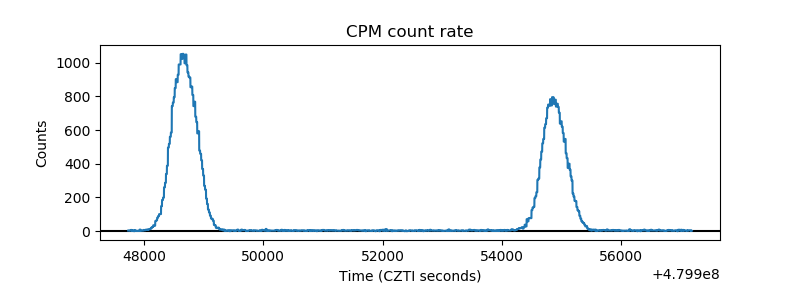 |
| CZT Counter | 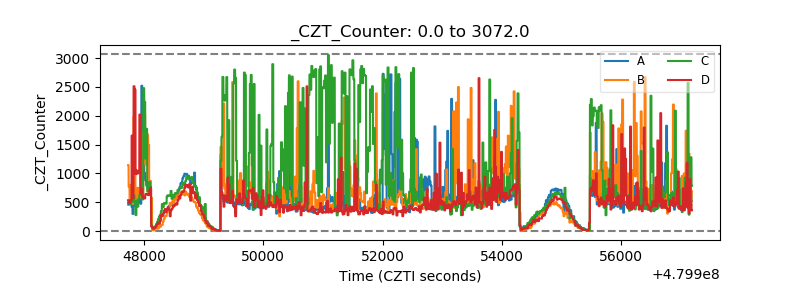 |
| +2.5 Volts monitor | 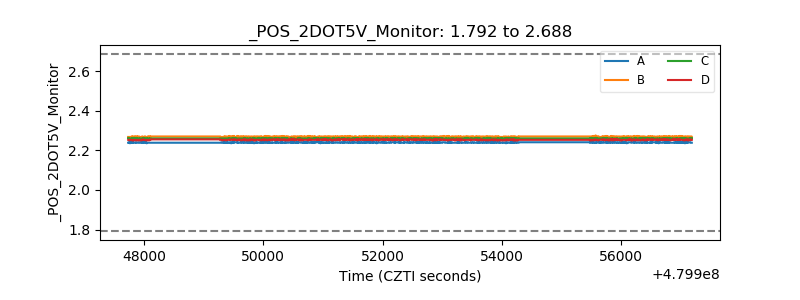 |
| +5 Volts monitor | 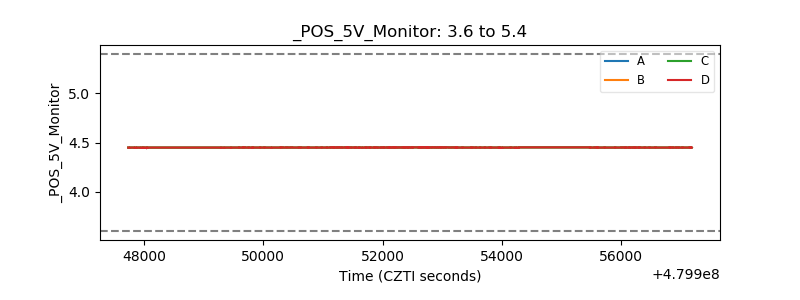 |
| _ROLL_ROT | 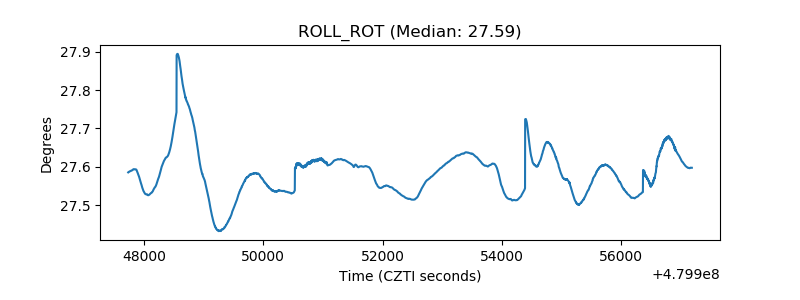 |
| _Roll_DEC | 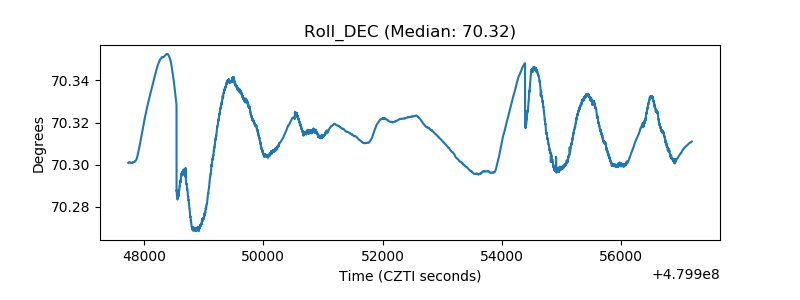 |
| _Roll_RA | 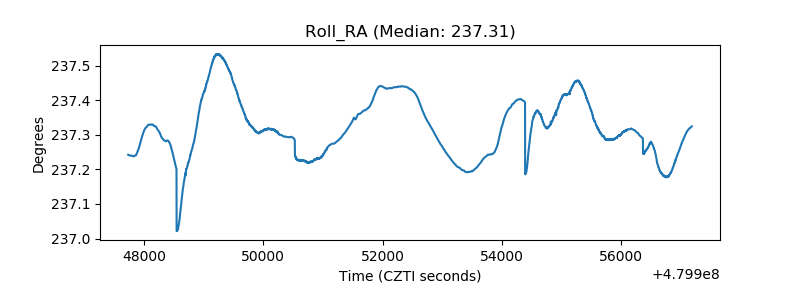 |
| Veto Counter | 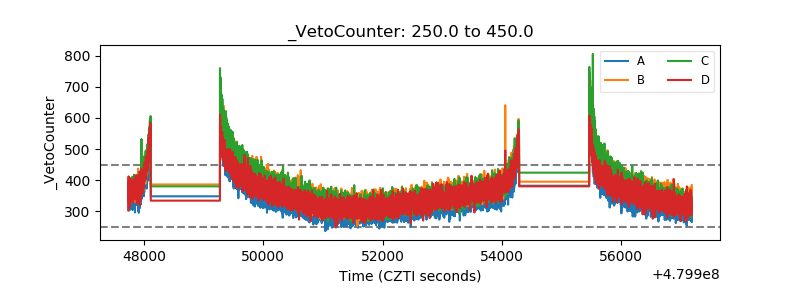 |