| Param | Original file | Final file |
|---|---|---|
| Filename | modeM0/AS1C07_001T01_9000006454_51220cztM0_level2.fits | modeM0/AS1C07_001T01_9000006454_51220cztM0_level2_quad_clean.evt |
| Size (bytes) | 626,440,320 | 88,758,720 |
| Size | 597.4 MB | 84.6 MB |
| Events in quadrant A | 4,184,987 | 616,572 |
| Events in quadrant B | 5,490,754 | 635,833 |
| Events in quadrant C | 9,132,157 | 424,741 |
| Events in quadrant D | 3,876,534 | 556,705 |
| Mode M0 | |||
|---|---|---|---|
| Quadrant | BADHDUFLAG | Total packets | Discarded packets |
| A | 0 | 16954 | 1 |
| B | 0 | 20861 | 1 |
| C | 0 | 31611 | 1 |
| D | 0 | 16269 | 1 |
| Mode SS | |||
|---|---|---|---|
| Quadrant | BADHDUFLAG | Total packets | Discarded packets |
| A | 0 | 132 | 0 |
| B | 0 | 132 | 0 |
| C | 0 | 132 | 0 |
| D | 0 | 132 | 0 |
| Mode M9 | |||
|---|---|---|---|
| Quadrant | BADHDUFLAG | Total packets | Discarded packets |
| A | 0 | 11 | 0 |
| B | 0 | 11 | 0 |
| C | 0 | 11 | 0 |
| D | 0 | 11 | 0 |
| Quadrant | Total seconds | Saturated seconds | Saturation percentage |
|---|---|---|---|
| A | 6505 | 63 | 0.968486% |
| B | 6505 | 617 | 9.485012% |
| C | 6505 | 2246 | 34.527287% |
| D | 6506 | 199 | 3.058715% |
Noise dominated data is calculated using 1-second bins in cleaned event files. If a bin has >2000 counts, and if more than 50% of those come from <1% of pixels, then it is considered to be noise-dominated and hence unusable.
| Quadrant | # 1 sec bins | Bins with >0 counts | Bins with >2000 counts | High rate bins dominated by noise | Noise dominated (total time) | Noise dominated (detector-on time) | Marked lightcurve |
|---|---|---|---|---|---|---|---|
| A | 7595 | 6506 | 45 | 45 | 0.59% | 0.69% | 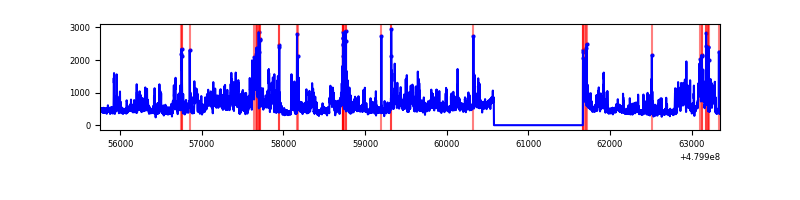 |
| B | 7595 | 6506 | 433 | 433 | 5.70% | 6.66% | 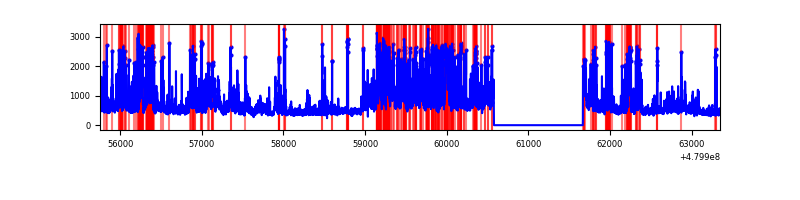 |
| C | 7595 | 6505 | 2173 | 2173 | 28.61% | 33.41% | 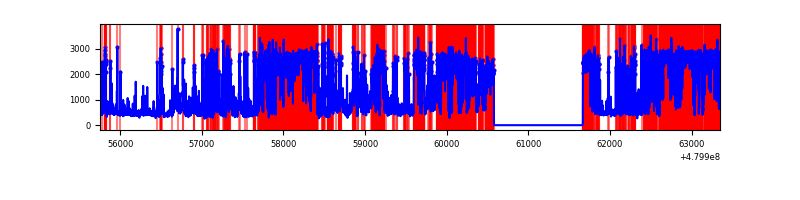 |
| D | 7595 | 6506 | 176 | 176 | 2.32% | 2.71% | 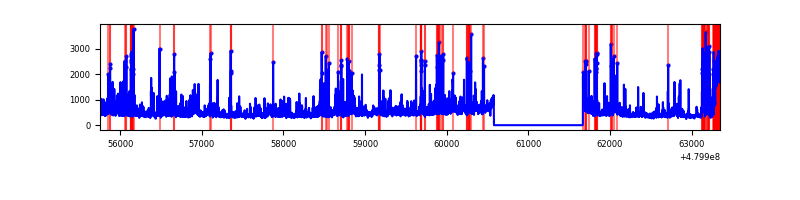 |
Top three noisy pixels from each quadrant. If the there are fewer than three noisy pixels in the level2.evt file, extra rows are filled as -1
| Pixel properties | Quadrant properties | ||||||
|---|---|---|---|---|---|---|---|
| Quadrant | DetID | PixID | Counts | Sigma | Mean | Median | Sigma |
| A | 12 | 3 | 930015 | 5540.46 | 670 | 653 | 167.7 |
| A | 12 | 194 | 111275 | 659.48 | 670 | 653 | 167.7 |
| A | 9 | 160 | 93879 | 555.77 | 670 | 653 | 167.7 |
| B | 5 | 185 | 917612 | 6697.72 | 651 | 628 | 136.9 |
| B | 10 | 254 | 497991 | 3632.77 | 651 | 628 | 136.9 |
| B | 5 | 172 | 439226 | 3203.55 | 651 | 628 | 136.9 |
| C | 4 | 12 | 4977576 | 34049.91 | 532 | 528 | 146.2 |
| C | 0 | 145 | 1289018 | 8815.06 | 532 | 528 | 146.2 |
| C | 10 | 252 | 312209 | 2132.33 | 532 | 528 | 146.2 |
| D | 3 | 12 | 335951 | 1849.86 | 635 | 611 | 181.3 |
| D | 10 | 172 | 280361 | 1543.21 | 635 | 611 | 181.3 |
| D | 2 | 207 | 169837 | 933.51 | 635 | 611 | 181.3 |
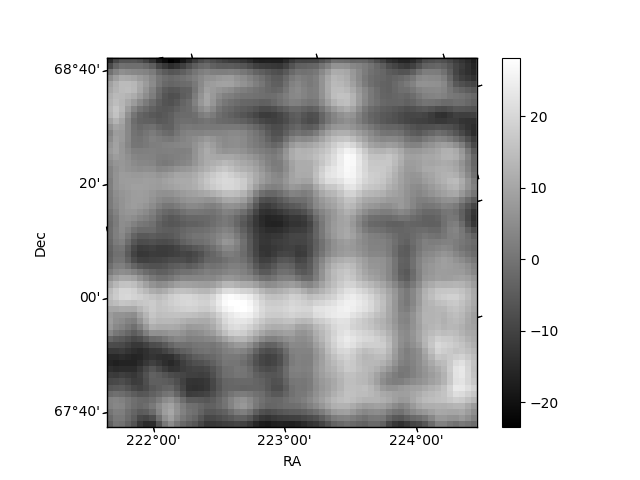
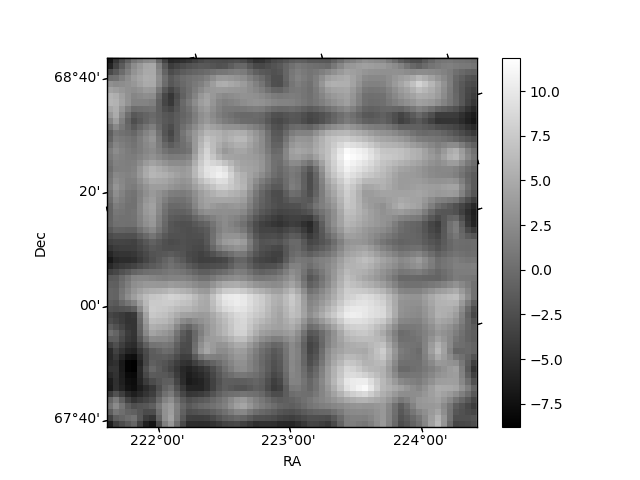
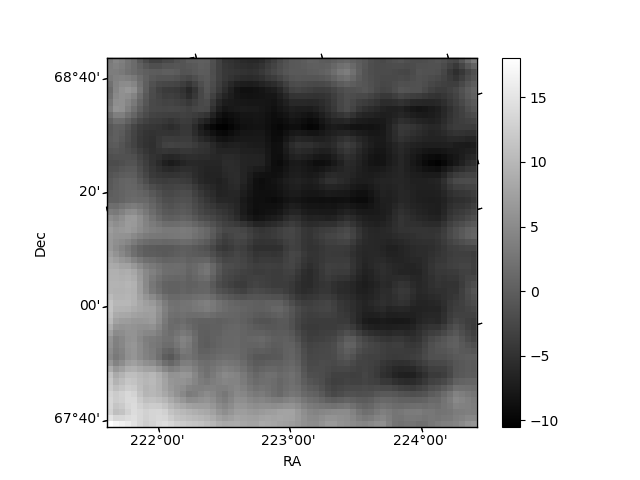
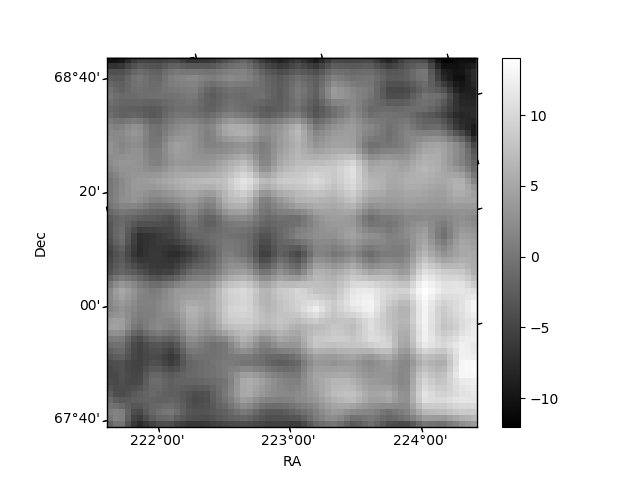
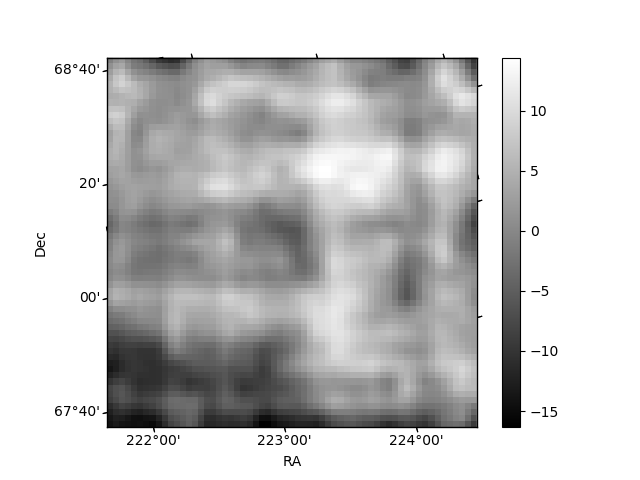
Histogram calculated using DETX and DETY for each event in the final _common_clean file
| Quadrant A | 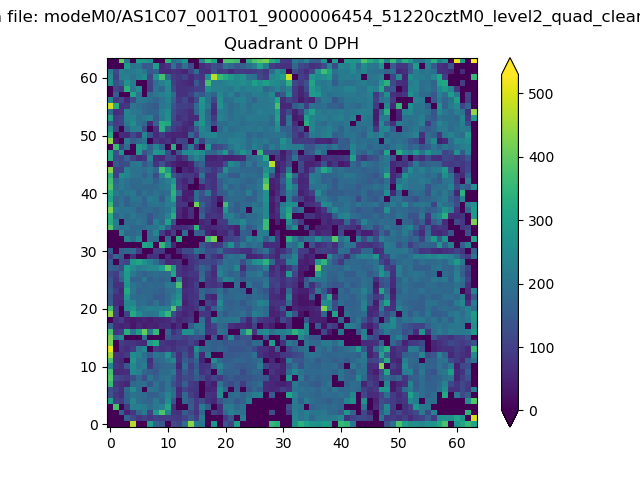 |
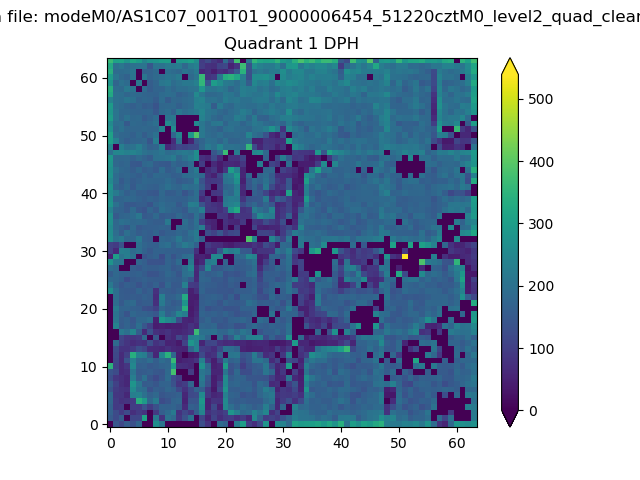 |
Quadrant B |
|---|---|---|---|
| Quadrant D | 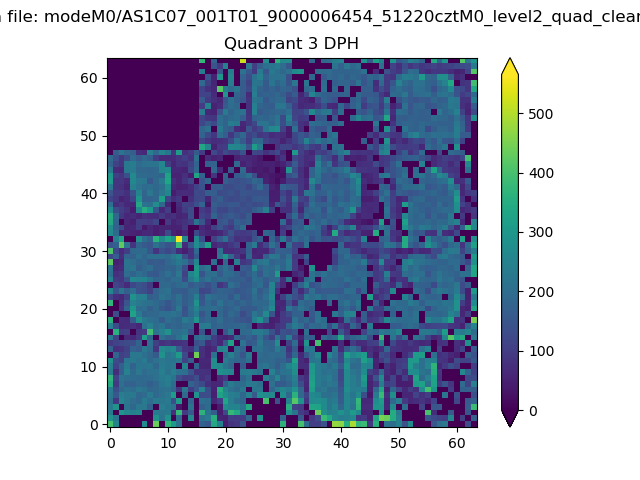 |
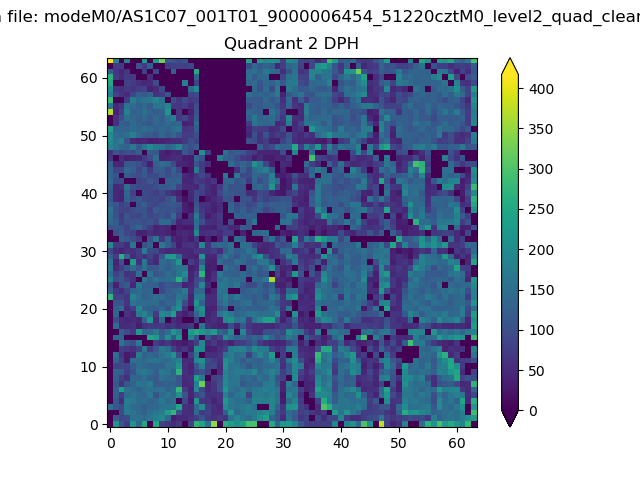 |
Quadrant C |
| Plot type | Count rate plots | Images |
|---|---|---|
| Comparison with Poisson distribution Blue bars denote a histogram of data divided into 1 sec bins. Red curve is a Poisson curve with rate = median count rate of data. |
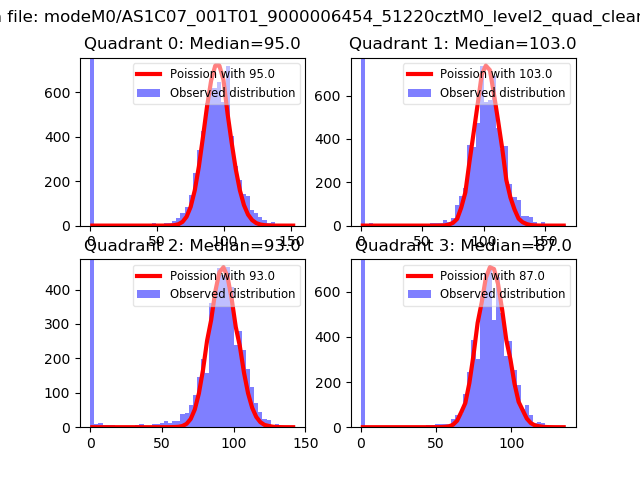 |
 |
| Quadrant-wise count rates Data is divided into 100 sec bins |
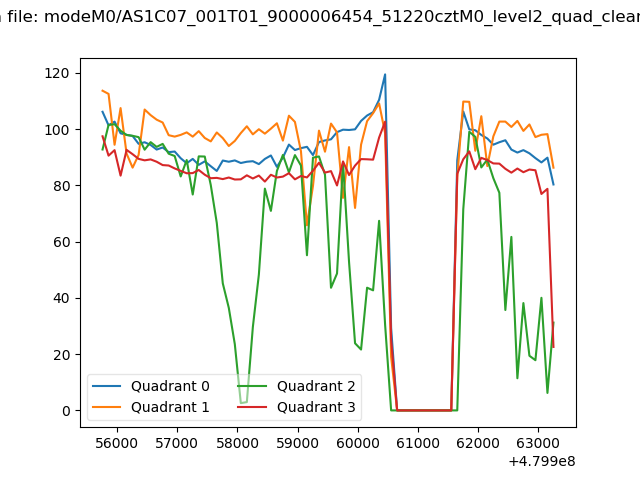 |
|
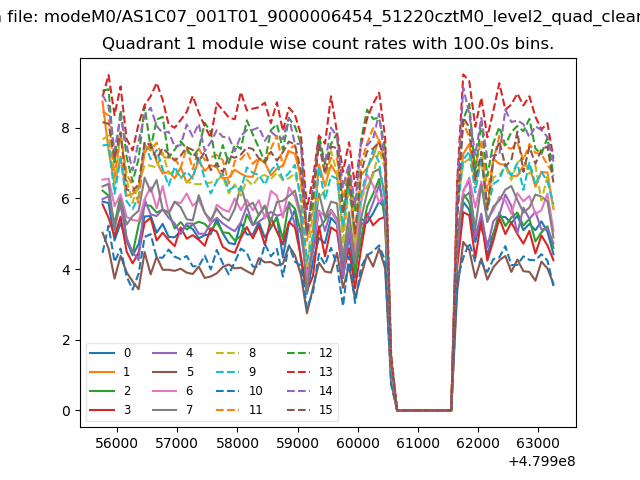
| Module-wise count rates for Quadrant A Data is divided into 100 sec bins |
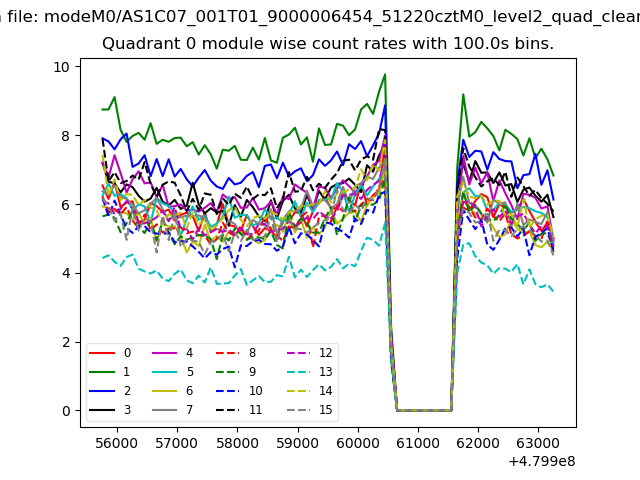 |
 |
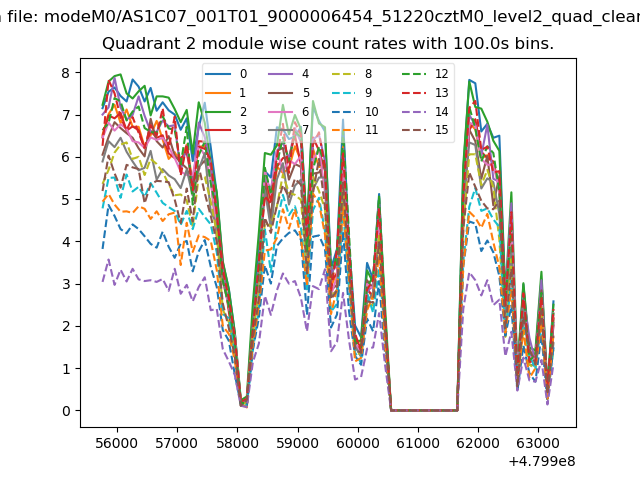
| Module-wise count rates for Quadrant B Data is divided into 100 sec bins |
 |
 |
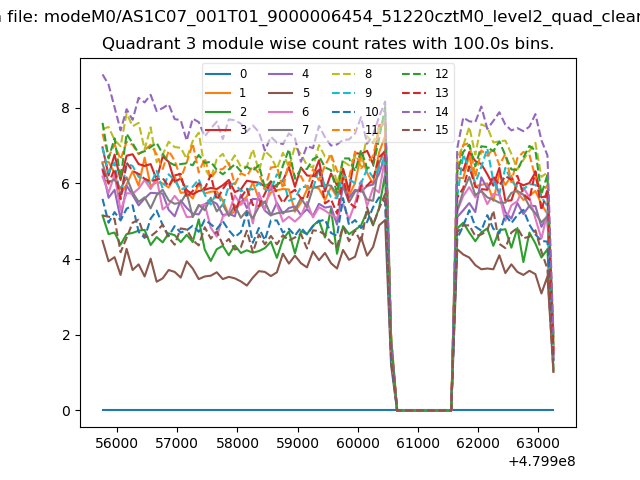
| Module-wise count rates for Quadrant C Data is divided into 100 sec bins |
 |
 |
| Module-wise count rates for Quadrant D Data is divided into 100 sec bins |
 |
 |
| Parameter | Plot |
|---|---|
| CZT HV Monitor | 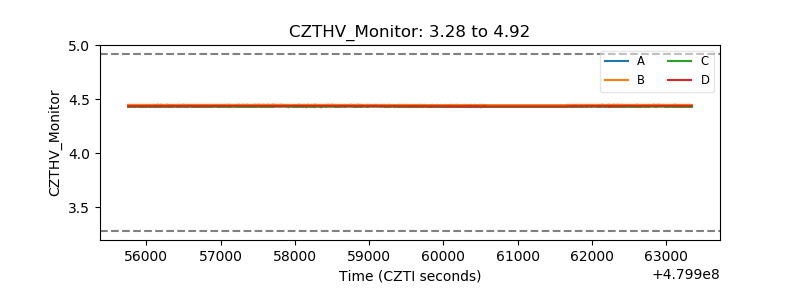 |
| D_VDD | 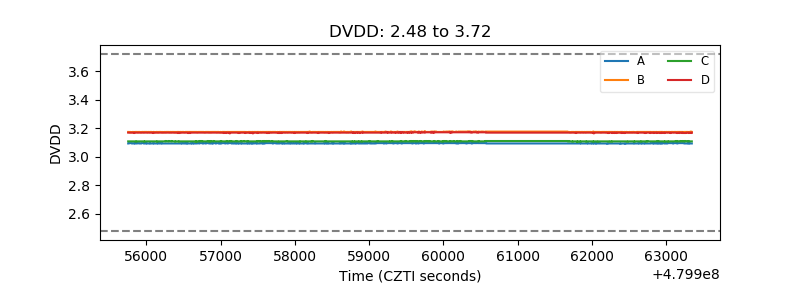 |
| Temperature 1 | 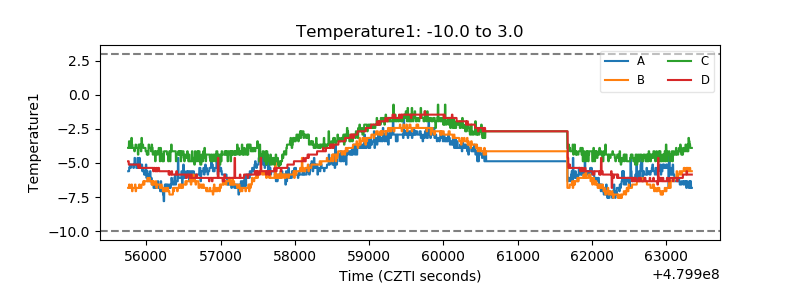 |
| Veto HV Monitor | 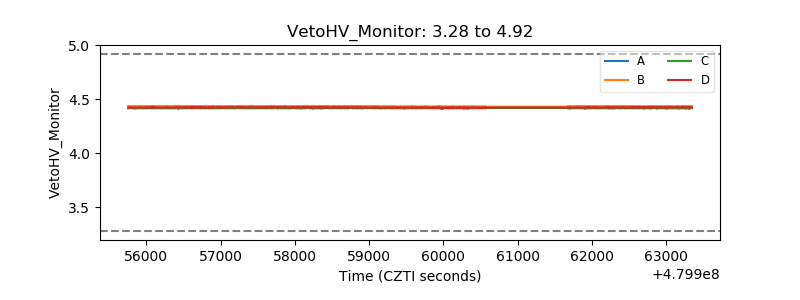 |
| Veto LLD | 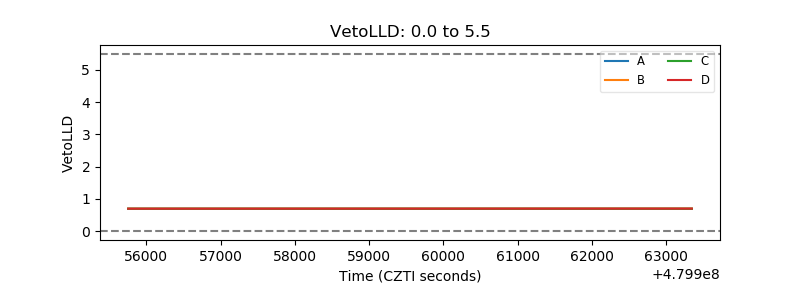 |
| Alpha Counter | 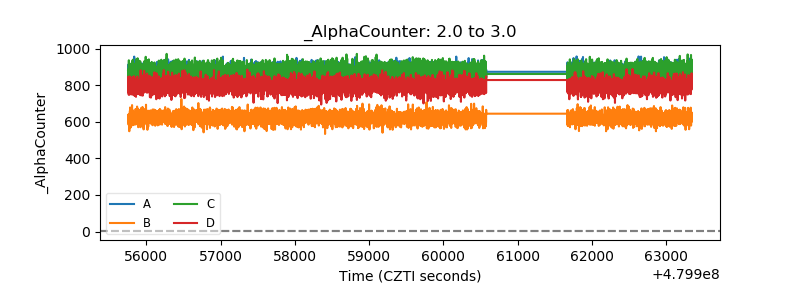 |
| _CPM_Rate | 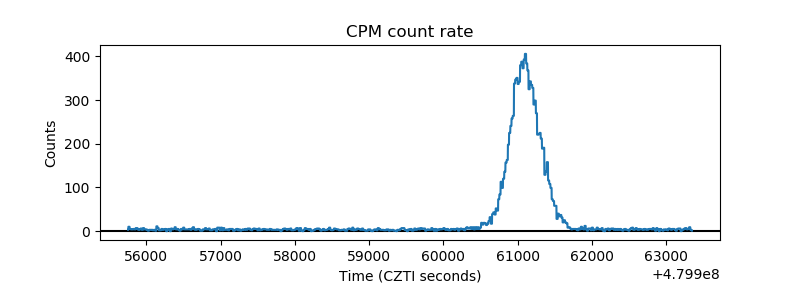 |
| CZT Counter | 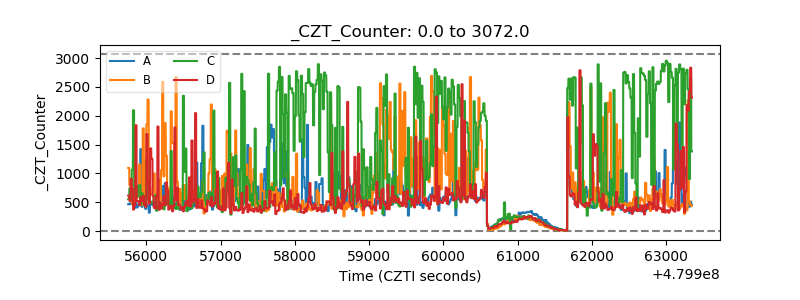 |
| +2.5 Volts monitor | 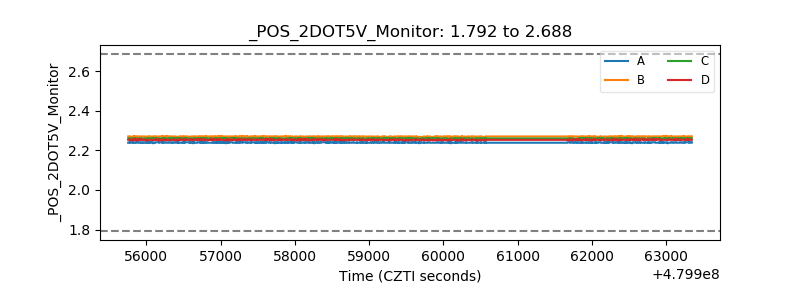 |
| +5 Volts monitor | 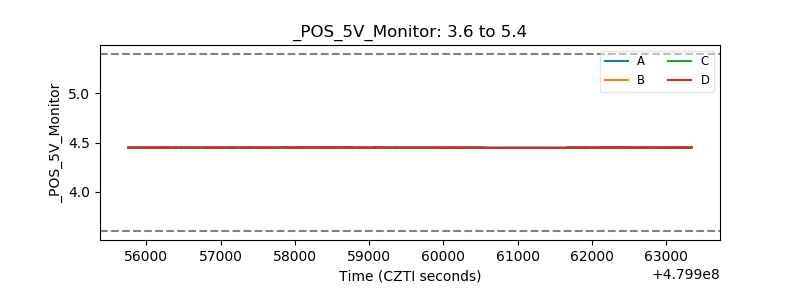 |
| _ROLL_ROT | 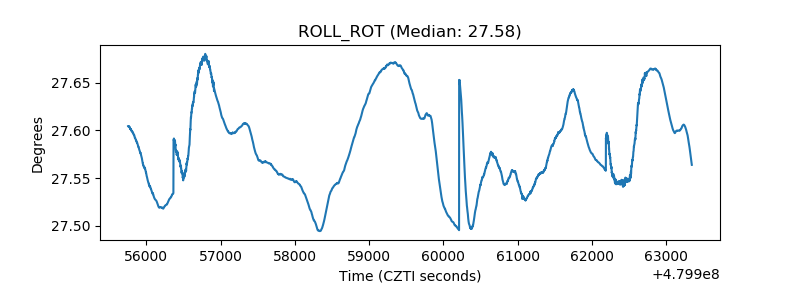 |
| _Roll_DEC | 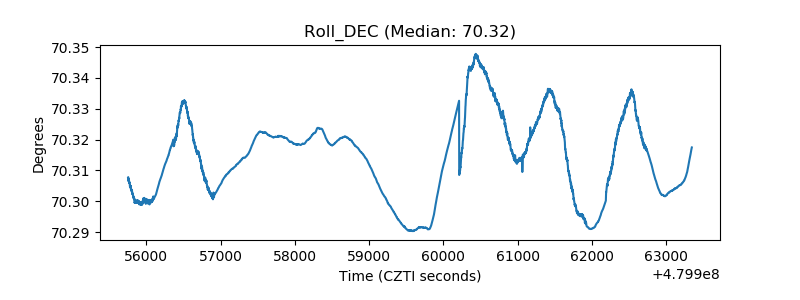 |
| _Roll_RA | 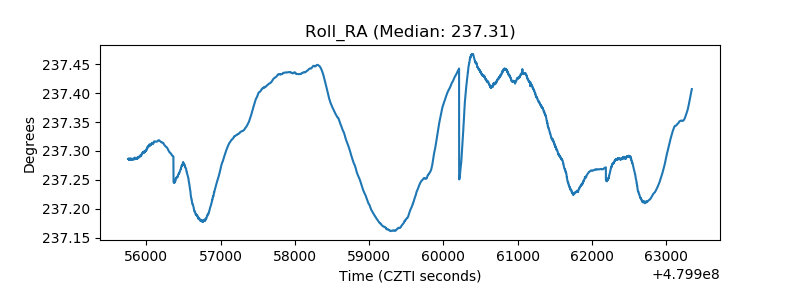 |
| Veto Counter | 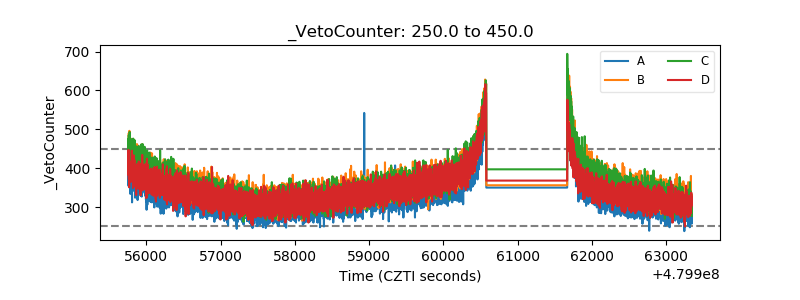 |