| Param | Original file | Final file |
|---|---|---|
| Filename | modeM0/AS1C07_001T01_9000006454_51221cztM0_level2.fits | modeM0/AS1C07_001T01_9000006454_51221cztM0_level2_quad_clean.evt |
| Size (bytes) | 611,723,520 | 81,518,400 |
| Size | 583.4 MB | 77.7 MB |
| Events in quadrant A | 3,866,756 | 569,348 |
| Events in quadrant B | 5,137,001 | 583,584 |
| Events in quadrant C | 8,553,494 | 406,632 |
| Events in quadrant D | 4,607,613 | 477,216 |
| Mode M0 | |||
|---|---|---|---|
| Quadrant | BADHDUFLAG | Total packets | Discarded packets |
| A | 0 | 16003 | 96 |
| B | 0 | 19827 | 206 |
| C | 0 | 29980 | 301 |
| D | 0 | 18373 | 115 |
| Mode SS | |||
|---|---|---|---|
| Quadrant | BADHDUFLAG | Total packets | Discarded packets |
| A | 0 | 126 | 0 |
| B | 0 | 126 | 0 |
| C | 0 | 126 | 0 |
| D | 0 | 126 | 0 |
| Mode M9 | |||
|---|---|---|---|
| Quadrant | BADHDUFLAG | Total packets | Discarded packets |
| A | 0 | 9 | 0 |
| B | 0 | 9 | 0 |
| C | 0 | 9 | 0 |
| D | 0 | 9 | 0 |
| Quadrant | Total seconds | Saturated seconds | Saturation percentage |
|---|---|---|---|
| A | 6190 | 92 | 1.486268% |
| B | 6173 | 573 | 9.282359% |
| C | 6167 | 1994 | 32.333387% |
| D | 6179 | 593 | 9.597022% |
Noise dominated data is calculated using 1-second bins in cleaned event files. If a bin has >2000 counts, and if more than 50% of those come from <1% of pixels, then it is considered to be noise-dominated and hence unusable.
| Quadrant | # 1 sec bins | Bins with >0 counts | Bins with >2000 counts | High rate bins dominated by noise | Noise dominated (total time) | Noise dominated (detector-on time) | Marked lightcurve |
|---|---|---|---|---|---|---|---|
| A | 7132 | 6208 | 39 | 39 | 0.55% | 0.63% | 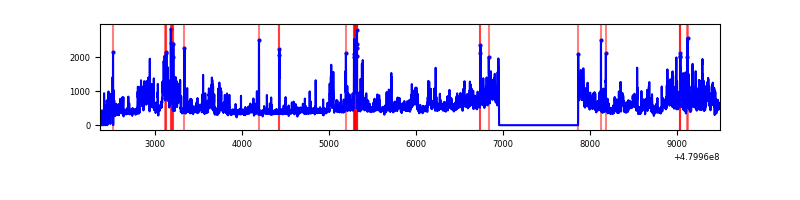 |
| B | 7117 | 6189 | 390 | 390 | 5.48% | 6.30% | 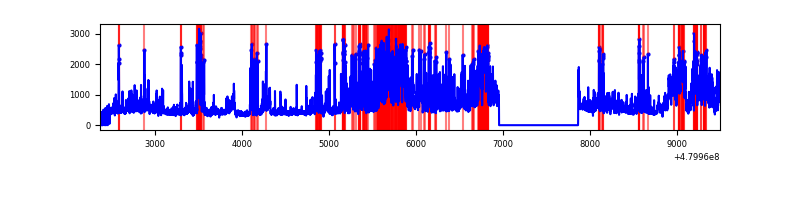 |
| C | 7123 | 6185 | 1961 | 1961 | 27.53% | 31.71% | 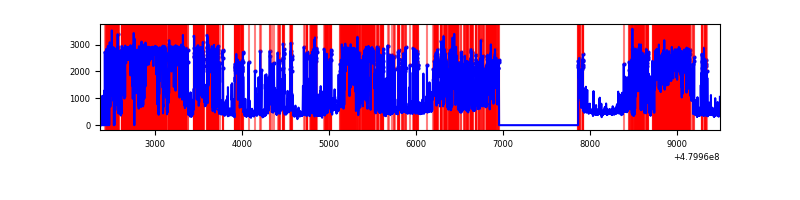 |
| D | 7129 | 6196 | 528 | 528 | 7.41% | 8.52% | 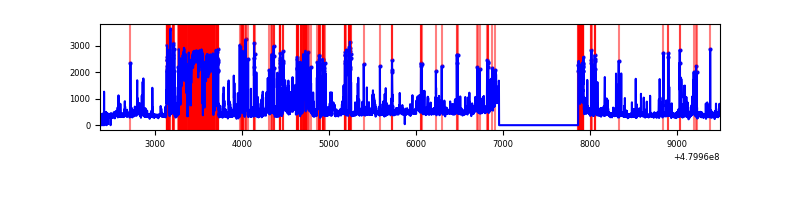 |
Top three noisy pixels from each quadrant. If the there are fewer than three noisy pixels in the level2.evt file, extra rows are filled as -1
| Pixel properties | Quadrant properties | ||||||
|---|---|---|---|---|---|---|---|
| Quadrant | DetID | PixID | Counts | Sigma | Mean | Median | Sigma |
| A | 12 | 3 | 857689 | 5415.43 | 634 | 618 | 158.3 |
| A | 12 | 194 | 100591 | 631.68 | 634 | 618 | 158.3 |
| A | 4 | 3 | 91097 | 571.69 | 634 | 618 | 158.3 |
| B | 5 | 185 | 929260 | 7125.43 | 614 | 594 | 130.3 |
| B | 10 | 254 | 637066 | 4883.49 | 614 | 594 | 130.3 |
| B | 5 | 172 | 213293 | 1631.99 | 614 | 594 | 130.3 |
| C | 4 | 12 | 3530369 | 24170.19 | 526 | 521 | 146.0 |
| C | 9 | 38 | 1011563 | 6922.98 | 526 | 521 | 146.0 |
| C | 10 | 252 | 443696 | 3034.58 | 526 | 521 | 146.0 |
| D | 10 | 172 | 1433792 | 8612.88 | 581 | 560 | 166.4 |
| D | 8 | 176 | 247122 | 1481.69 | 581 | 560 | 166.4 |
| D | 15 | 42 | 93575 | 558.97 | 581 | 560 | 166.4 |
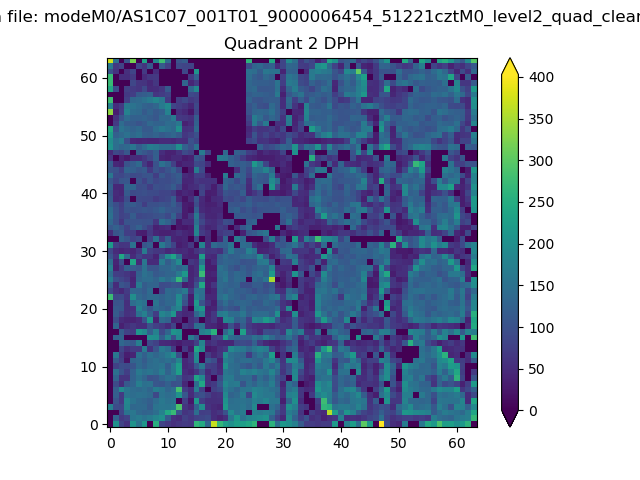
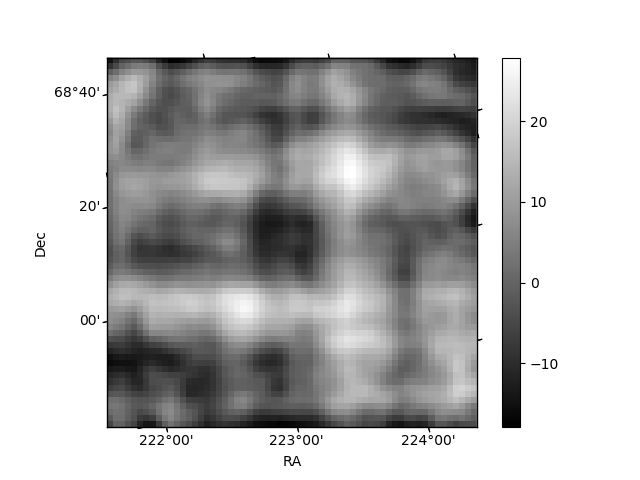
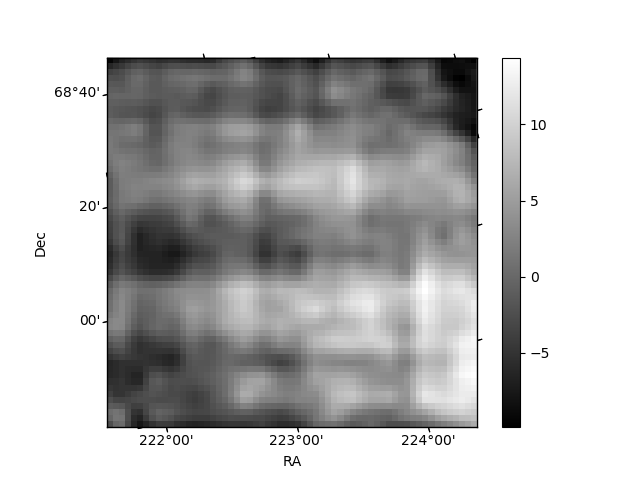
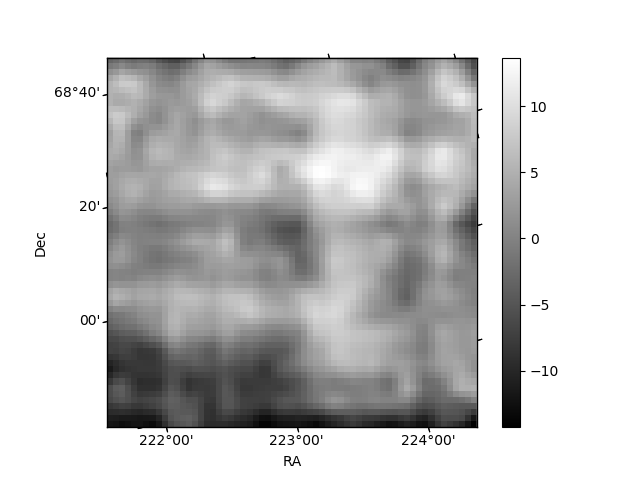
Histogram calculated using DETX and DETY for each event in the final _common_clean file
| Quadrant A | 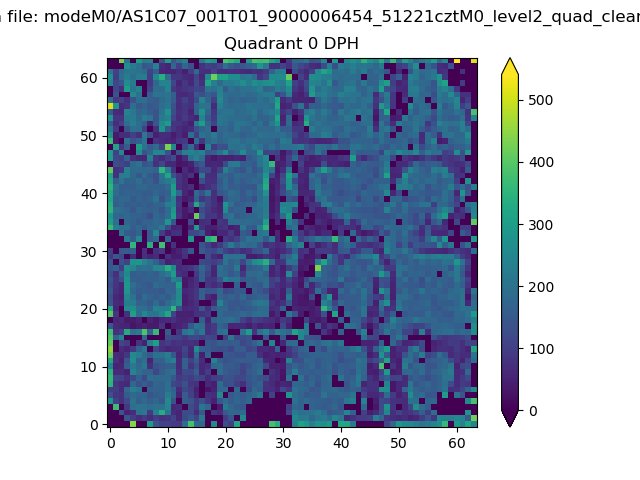 |
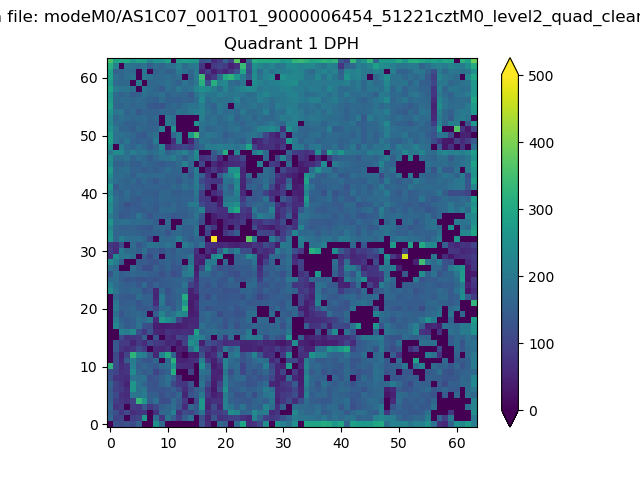 |
Quadrant B |
|---|---|---|---|
| Quadrant D | 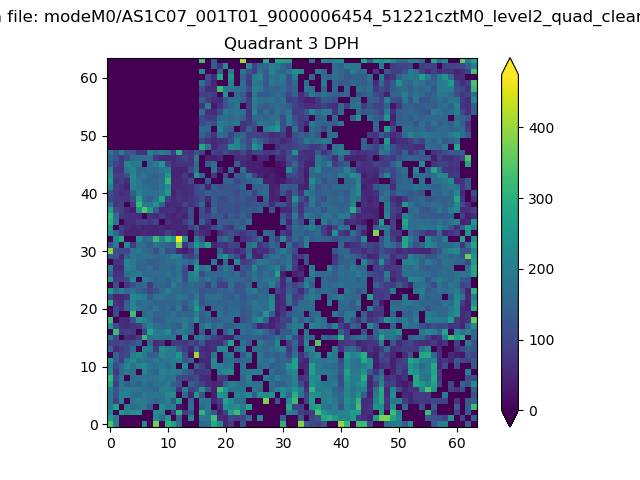 |
 |
Quadrant C |
| Plot type | Count rate plots | Images |
|---|---|---|
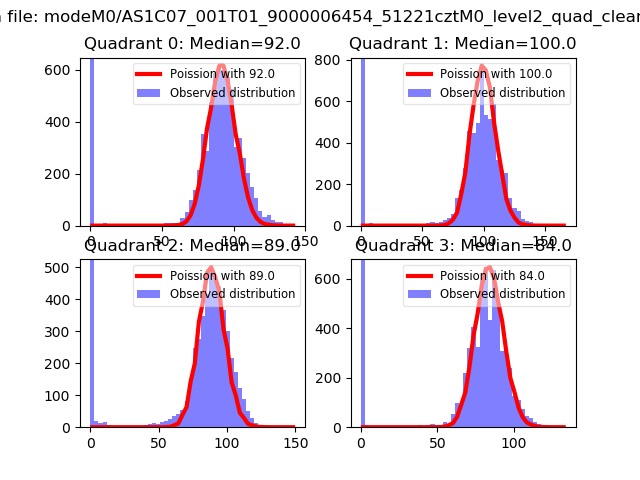
| Comparison with Poisson distribution Blue bars denote a histogram of data divided into 1 sec bins. Red curve is a Poisson curve with rate = median count rate of data. |
 |
 |
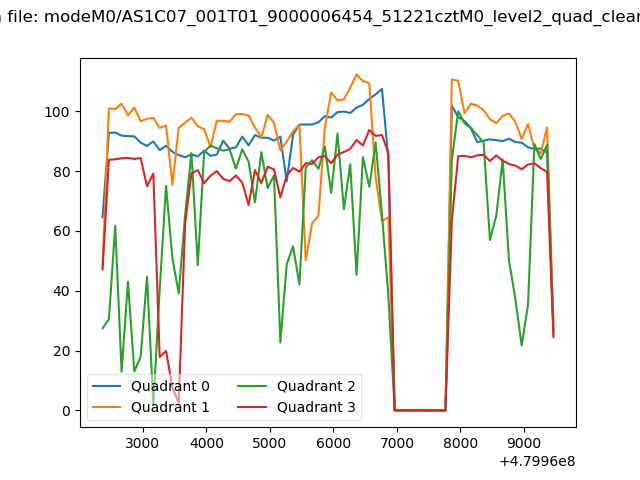
| Quadrant-wise count rates Data is divided into 100 sec bins |
 |
|
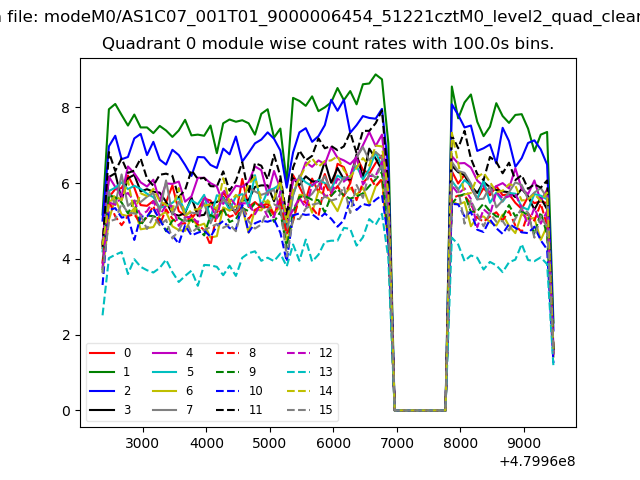
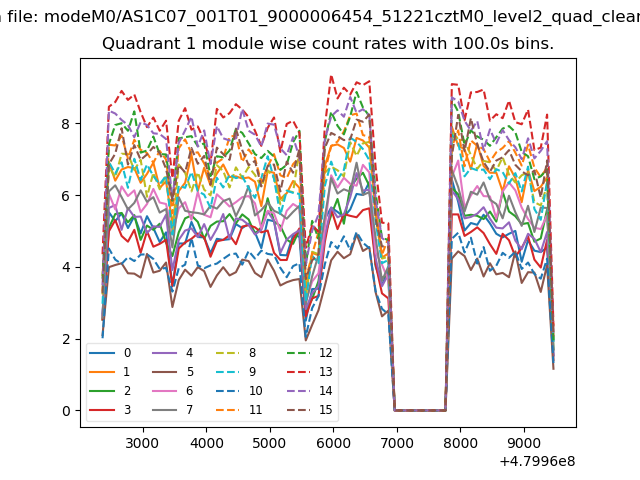
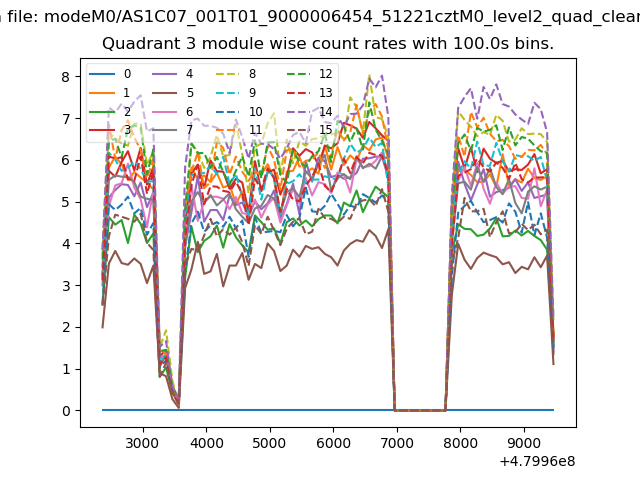
| Module-wise count rates for Quadrant A Data is divided into 100 sec bins |
 |
 |
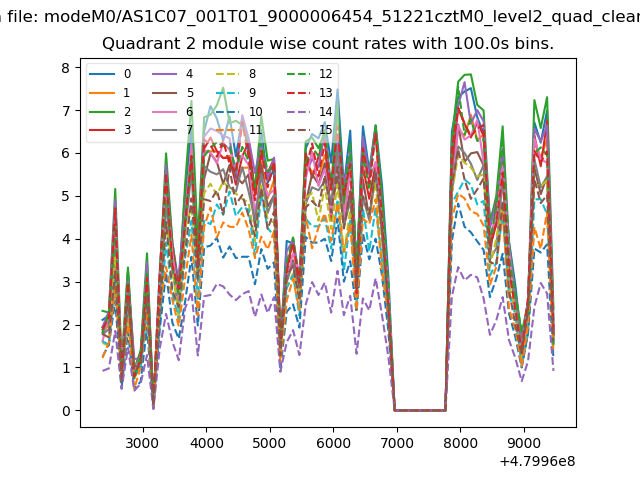
| Module-wise count rates for Quadrant B Data is divided into 100 sec bins |
 |
 |
| Module-wise count rates for Quadrant C Data is divided into 100 sec bins |
 |
 |
| Module-wise count rates for Quadrant D Data is divided into 100 sec bins |
 |
 |
| Parameter | Plot |
|---|---|
| CZT HV Monitor | 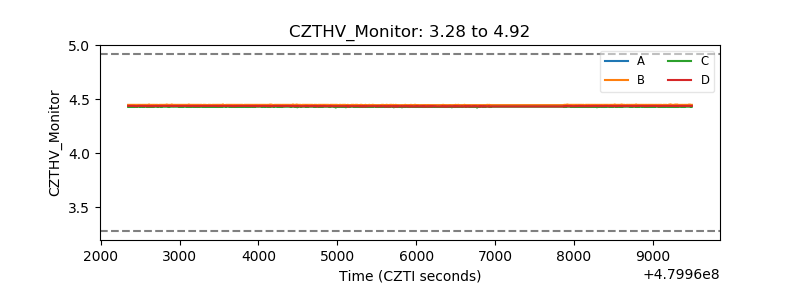 |
| D_VDD | 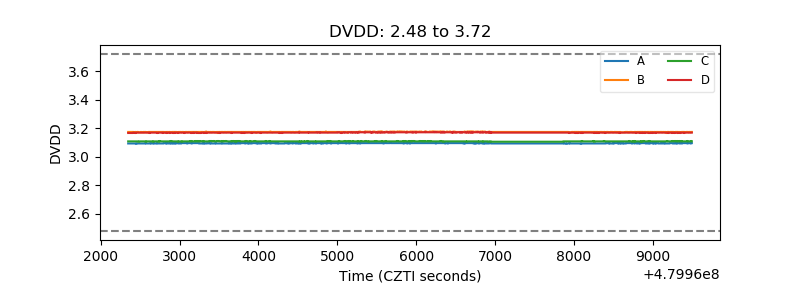 |
| Temperature 1 | 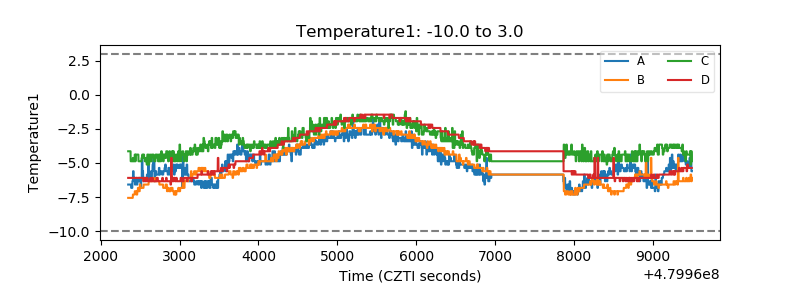 |
| Veto HV Monitor | 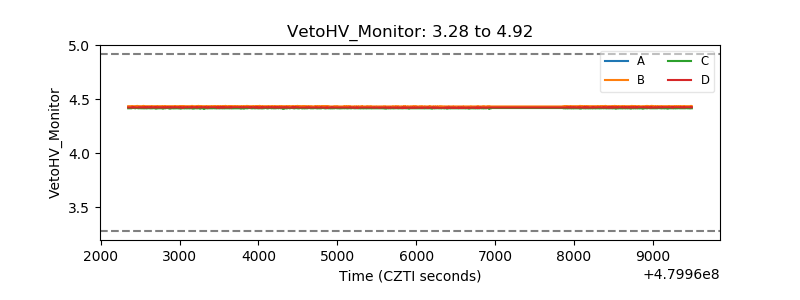 |
| Veto LLD | 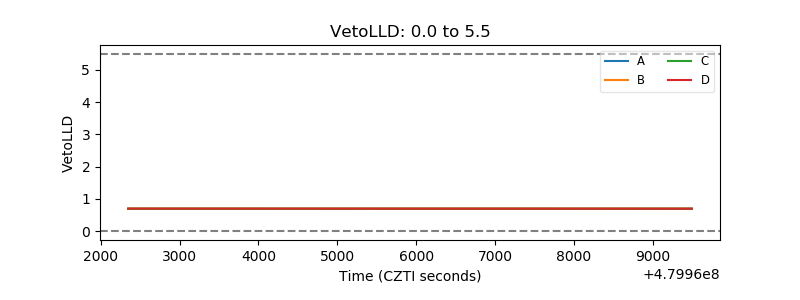 |
| Alpha Counter | 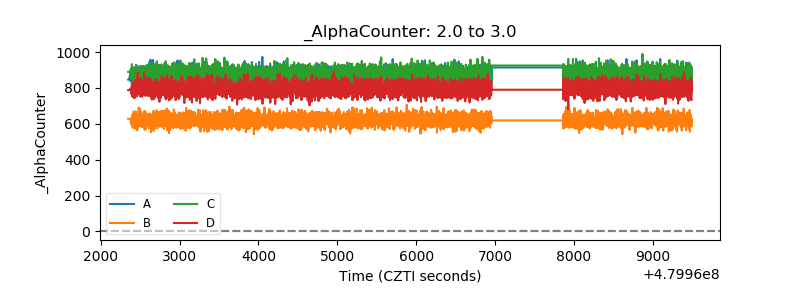 |
| _CPM_Rate | 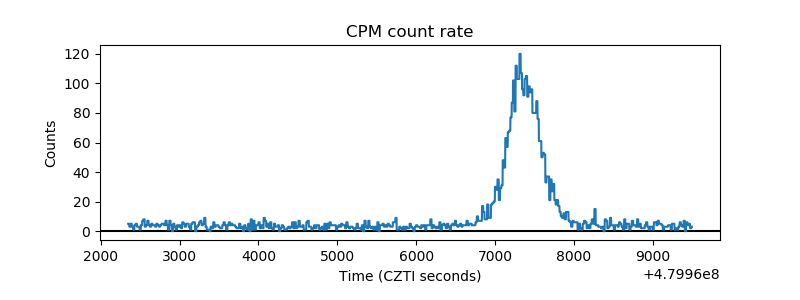 |
| CZT Counter | 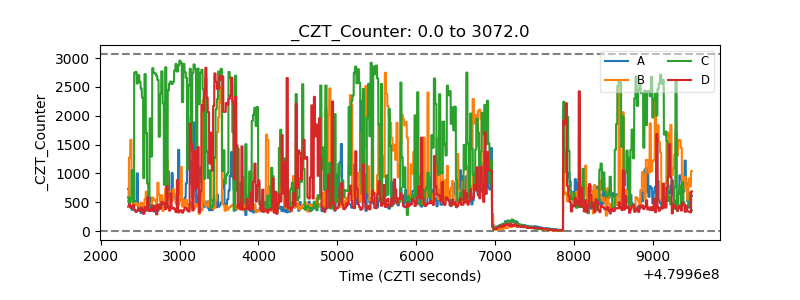 |
| +2.5 Volts monitor |  |
| +5 Volts monitor | 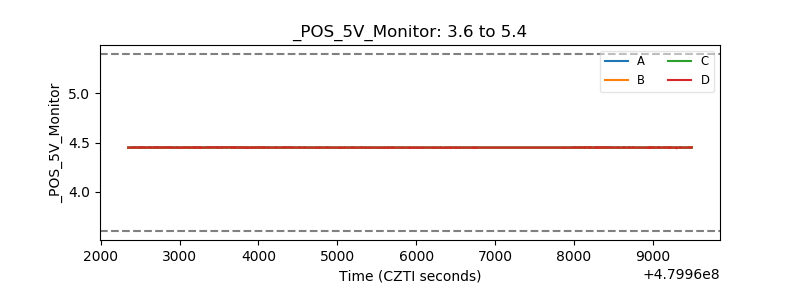 |
| _ROLL_ROT | 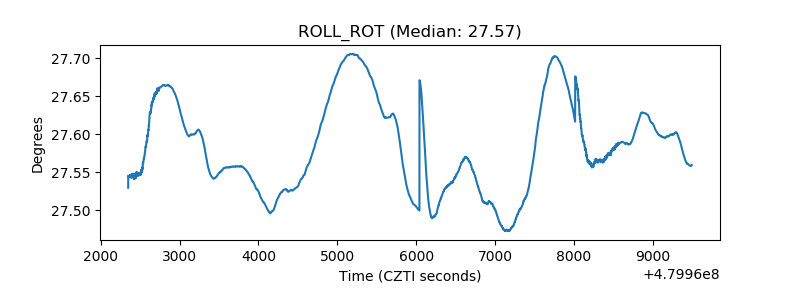 |
| _Roll_DEC | 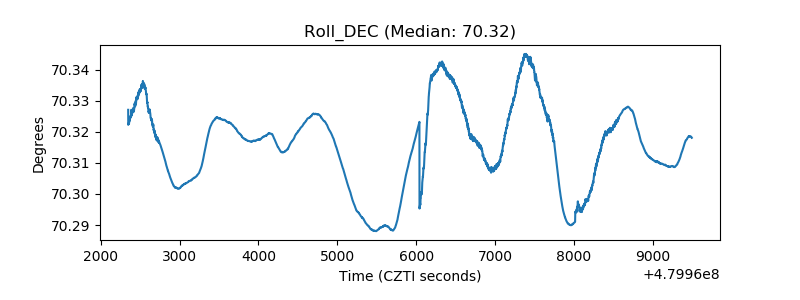 |
| _Roll_RA | 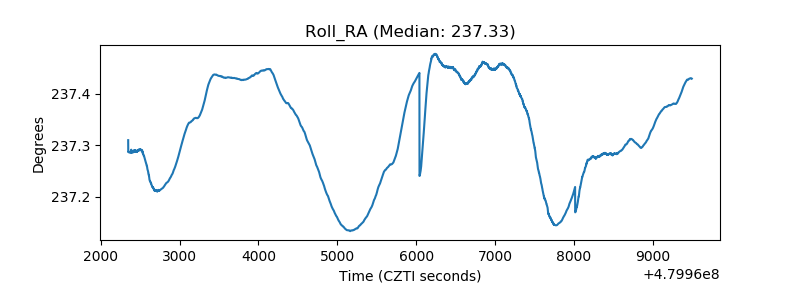 |
| Veto Counter | 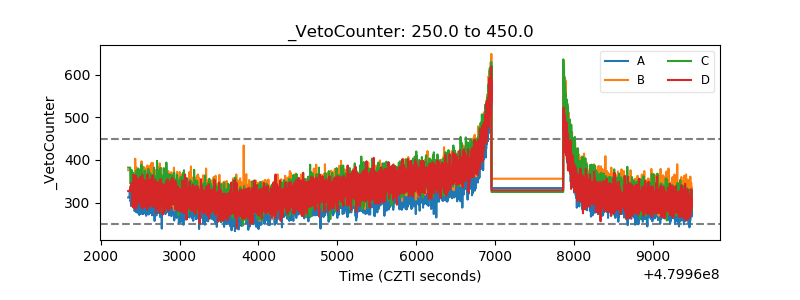 |