| Param | Original file | Final file |
|---|---|---|
| Filename | modeM0/AS1C07_001T01_9000006454_51228cztM0_level2.fits | modeM0/AS1C07_001T01_9000006454_51228cztM0_level2_quad_clean.evt |
| Size (bytes) | 3,642,986,880 | 565,191,360 |
| Size | 3.4 GB | 539.0 MB |
| Events in quadrant A | 30,824,430 | 3,705,215 |
| Events in quadrant B | 34,715,479 | 3,815,299 |
| Events in quadrant C | 38,395,716 | 3,290,737 |
| Events in quadrant D | 27,677,774 | 3,417,086 |
| Mode M0 | |||
|---|---|---|---|
| Quadrant | BADHDUFLAG | Total packets | Discarded packets |
| A | 0 | 120363 | 4 |
| B | 0 | 132279 | 5 |
| C | 0 | 143178 | 4 |
| D | 0 | 112089 | 4 |
| Mode SS | |||
|---|---|---|---|
| Quadrant | BADHDUFLAG | Total packets | Discarded packets |
| A | 0 | 848 | 0 |
| B | 0 | 846 | 0 |
| C | 0 | 846 | 0 |
| D | 0 | 846 | 0 |
| Mode M9 | |||
|---|---|---|---|
| Quadrant | BADHDUFLAG | Total packets | Discarded packets |
| A | 0 | 20 | 0 |
| B | 0 | 20 | 0 |
| C | 0 | 20 | 0 |
| D | 0 | 20 | 0 |
| Quadrant | Total seconds | Saturated seconds | Saturation percentage |
|---|---|---|---|
| A | 41986 | 2172 | 5.173153% |
| B | 41986 | 4998 | 11.903968% |
| C | 41986 | 6262 | 14.914495% |
| D | 41986 | 1704 | 4.058496% |
Noise dominated data is calculated using 1-second bins in cleaned event files. If a bin has >2000 counts, and if more than 50% of those come from <1% of pixels, then it is considered to be noise-dominated and hence unusable.
| Quadrant | # 1 sec bins | Bins with >0 counts | Bins with >2000 counts | High rate bins dominated by noise | Noise dominated (total time) | Noise dominated (detector-on time) | Marked lightcurve |
|---|---|---|---|---|---|---|---|
| A | 43930 | 41987 | 1395 | 1395 | 3.18% | 3.32% | 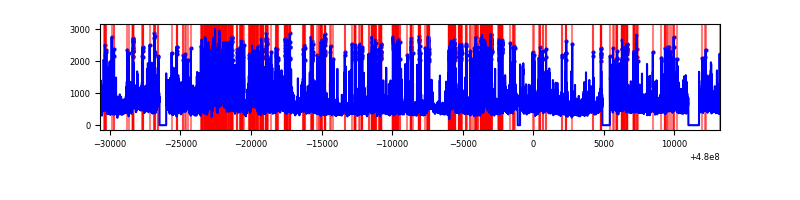 |
| B | 43930 | 41987 | 3461 | 3461 | 7.88% | 8.24% | 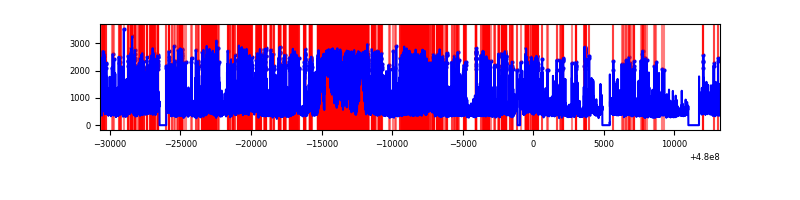 |
| C | 43930 | 41988 | 5678 | 5678 | 12.93% | 13.52% | 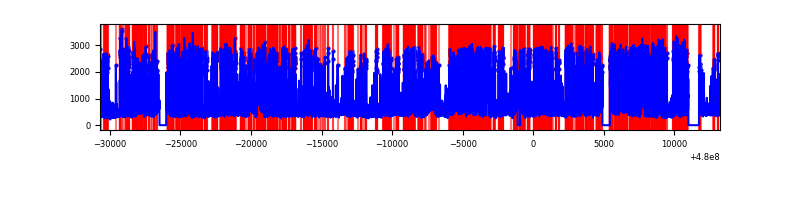 |
| D | 43930 | 41988 | 1573 | 1573 | 3.58% | 3.75% | 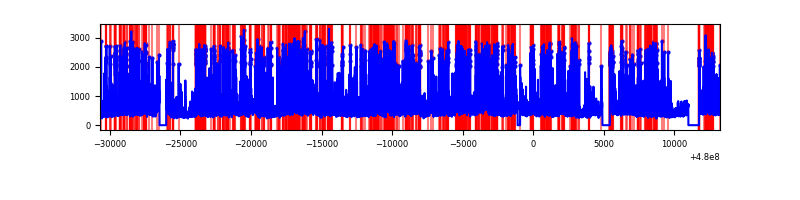 |
Top three noisy pixels from each quadrant. If the there are fewer than three noisy pixels in the level2.evt file, extra rows are filled as -1
| Pixel properties | Quadrant properties | ||||||
|---|---|---|---|---|---|---|---|
| Quadrant | DetID | PixID | Counts | Sigma | Mean | Median | Sigma |
| A | 12 | 3 | 4376415 | 4100.73 | 4337 | 4237 | 1066.2 |
| A | 9 | 160 | 1762252 | 1648.87 | 4337 | 4237 | 1066.2 |
| A | 8 | 26 | 1445094 | 1351.4 | 4337 | 4237 | 1066.2 |
| B | 5 | 185 | 5773783 | 6530.78 | 4186 | 4041 | 883.5 |
| B | 6 | 255 | 2801659 | 3166.63 | 4186 | 4041 | 883.5 |
| B | 12 | 32 | 2181295 | 2464.44 | 4186 | 4041 | 883.5 |
| C | 4 | 12 | 13755587 | 12576.36 | 3968 | 3942 | 1093.5 |
| C | 1 | 60 | 1583511 | 1444.57 | 3968 | 3942 | 1093.5 |
| C | 4 | 13 | 1547406 | 1411.55 | 3968 | 3942 | 1093.5 |
| D | 3 | 12 | 1597760 | 1355.18 | 4195 | 4052 | 1176.0 |
| D | 8 | 176 | 1373131 | 1164.17 | 4195 | 4052 | 1176.0 |
| D | 10 | 172 | 1170869 | 992.18 | 4195 | 4052 | 1176.0 |
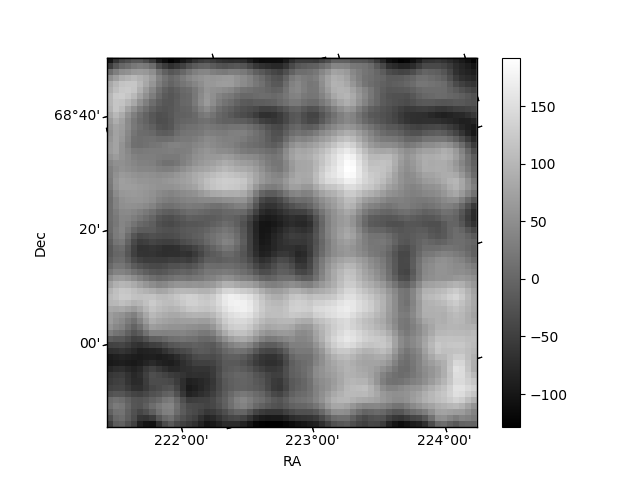
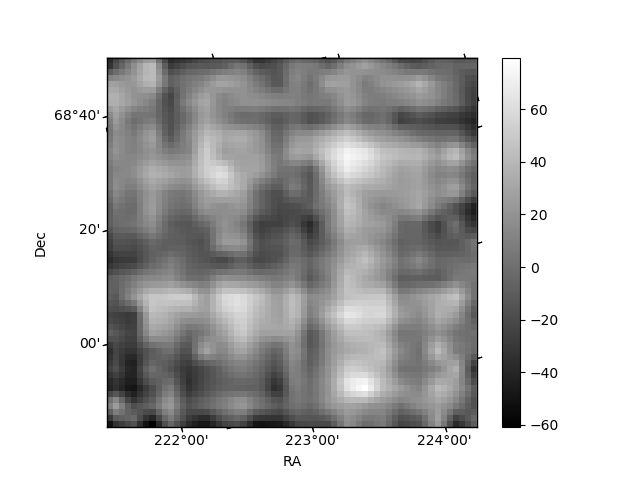
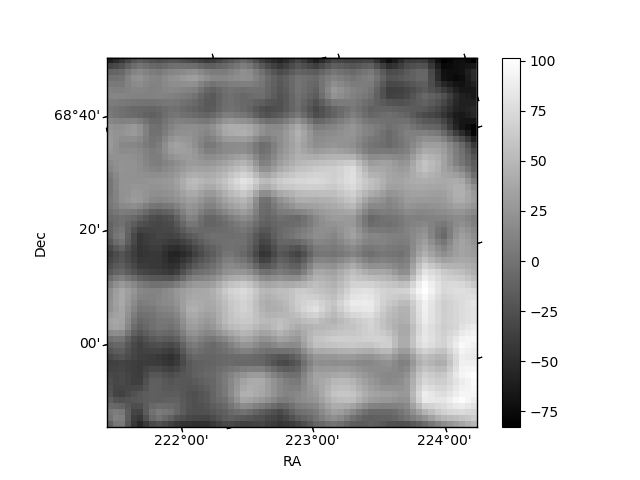
Histogram calculated using DETX and DETY for each event in the final _common_clean file
| Quadrant A | 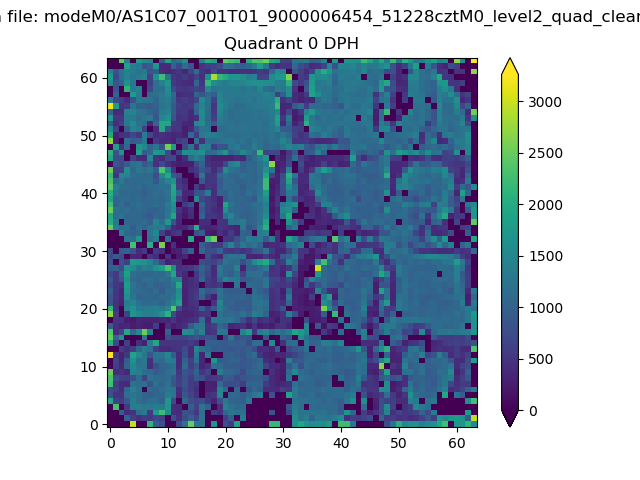 |
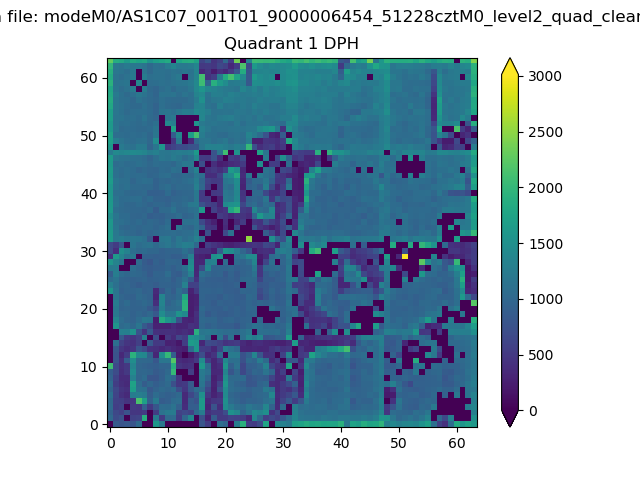 |
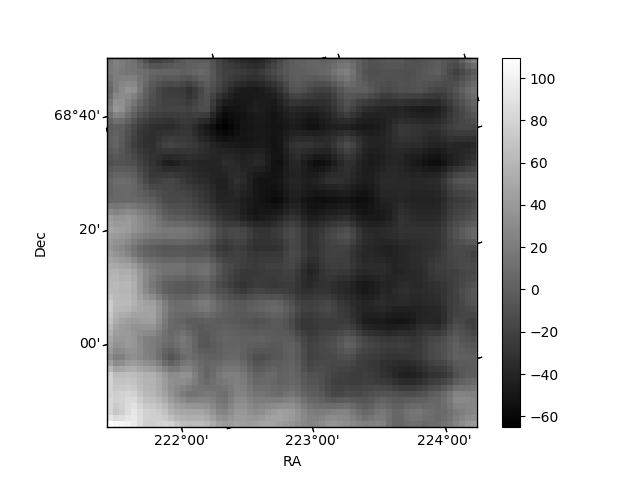
Quadrant B |
|---|---|---|---|
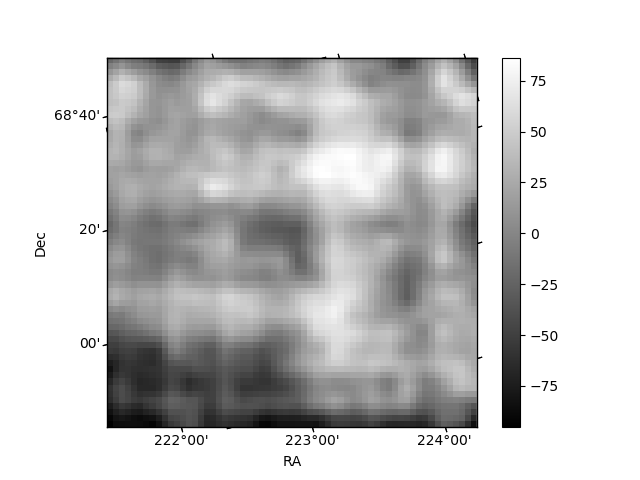
| Quadrant D | 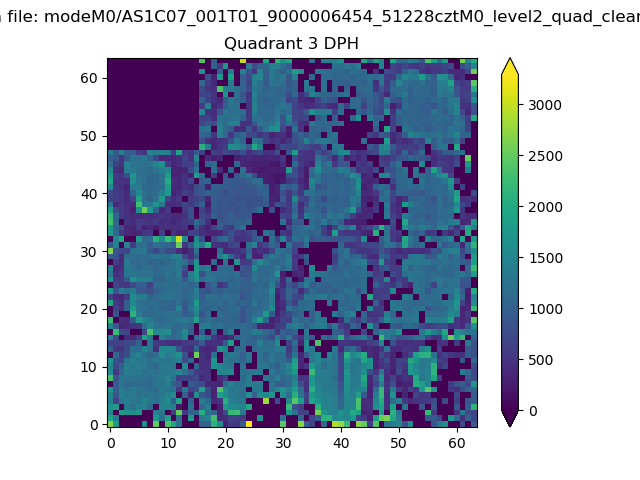 |
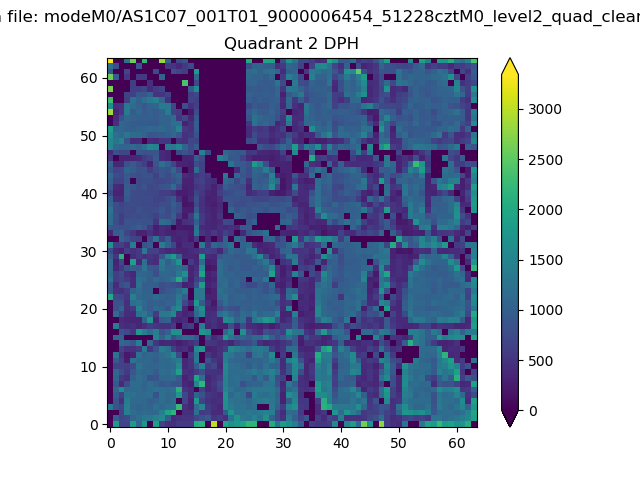 |
Quadrant C |
| Plot type | Count rate plots | Images |
|---|---|---|
| Comparison with Poisson distribution Blue bars denote a histogram of data divided into 1 sec bins. Red curve is a Poisson curve with rate = median count rate of data. |
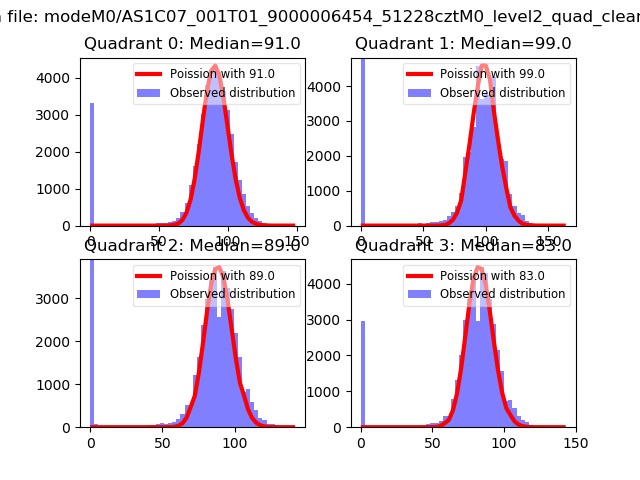 |
 |
| Quadrant-wise count rates Data is divided into 100 sec bins |
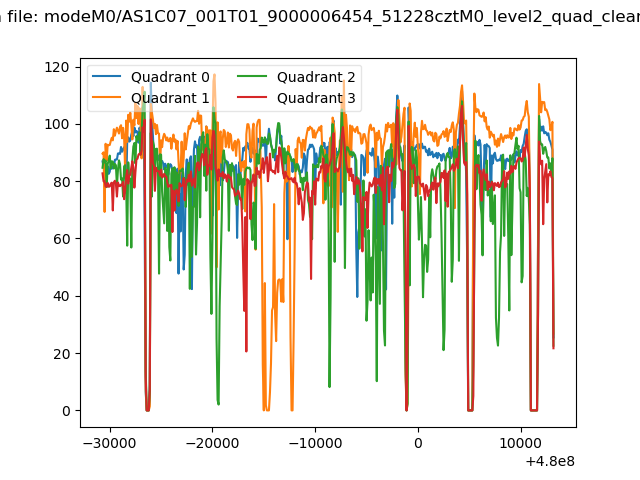 |
|
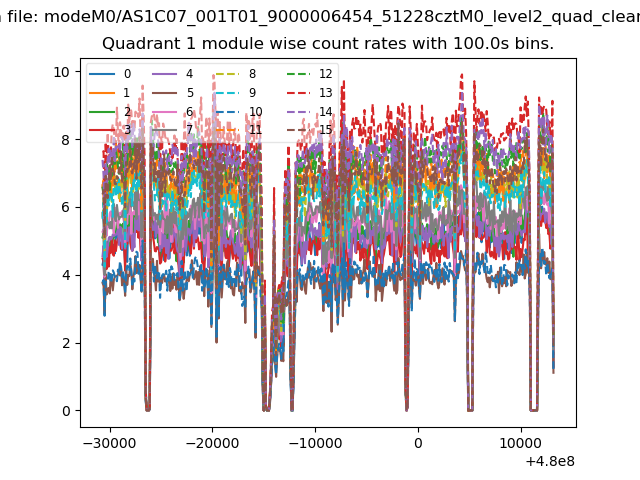
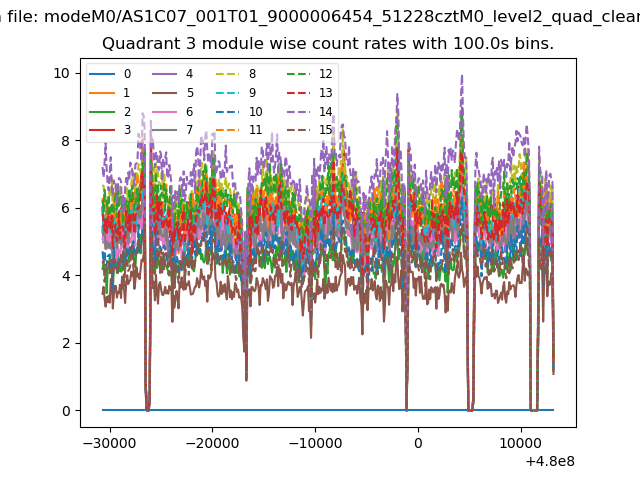
| Module-wise count rates for Quadrant A Data is divided into 100 sec bins |
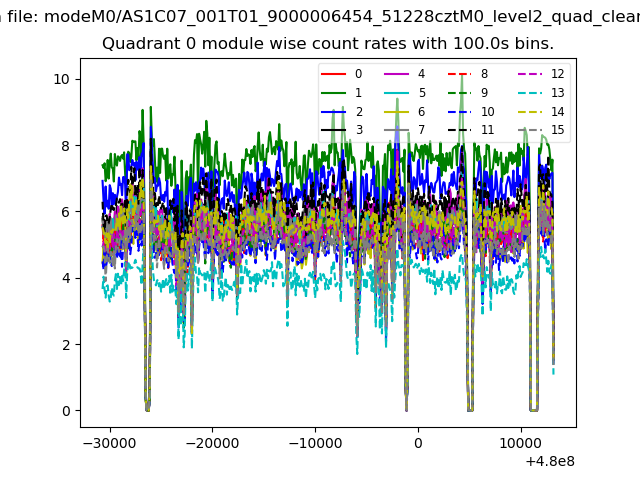 |
 |
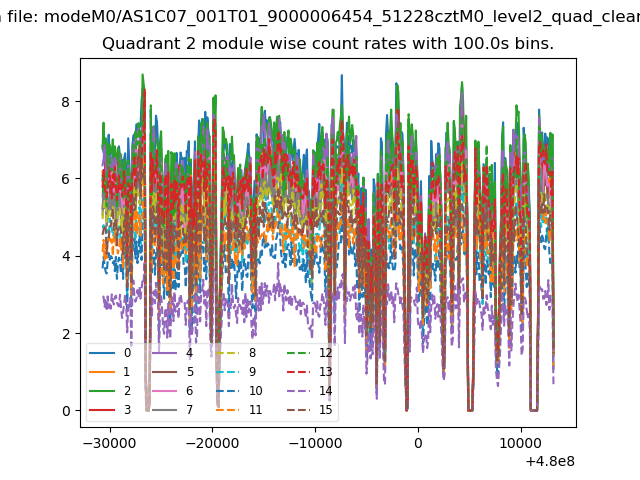
| Module-wise count rates for Quadrant B Data is divided into 100 sec bins |
 |
 |
| Module-wise count rates for Quadrant C Data is divided into 100 sec bins |
 |
 |
| Module-wise count rates for Quadrant D Data is divided into 100 sec bins |
 |
 |
| Parameter | Plot |
|---|---|
| CZT HV Monitor | 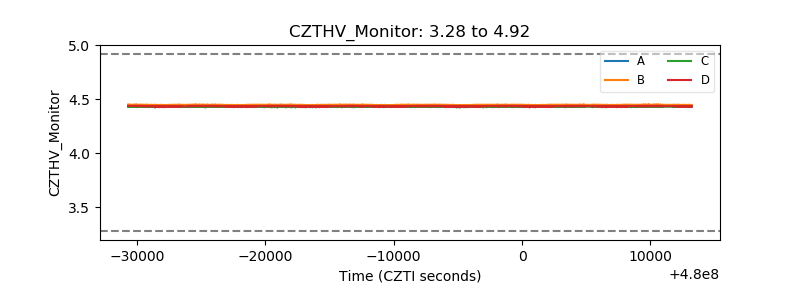 |
| D_VDD | 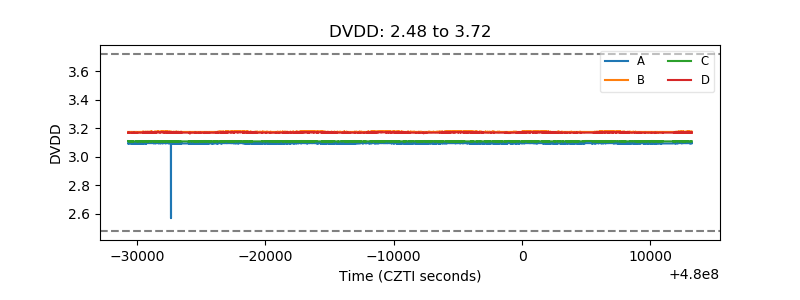 |
| Temperature 1 | 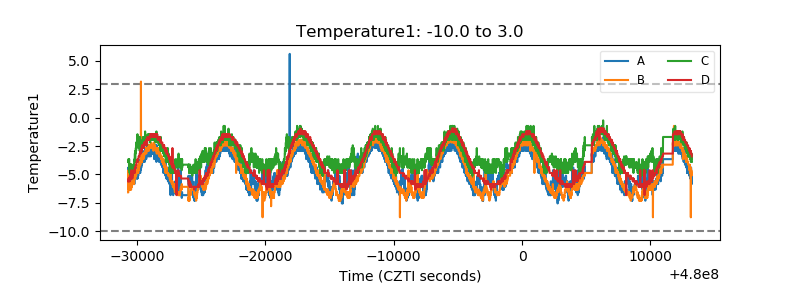 |
| Veto HV Monitor | 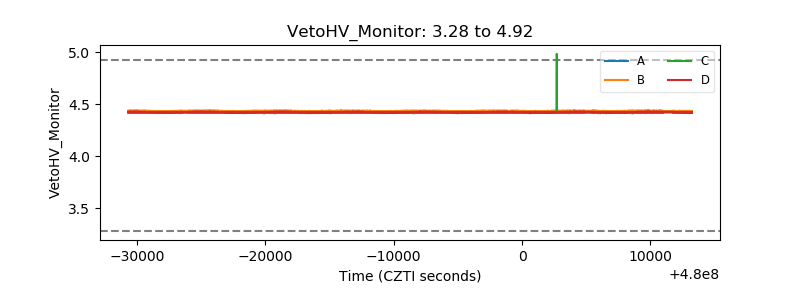 |
| Veto LLD | 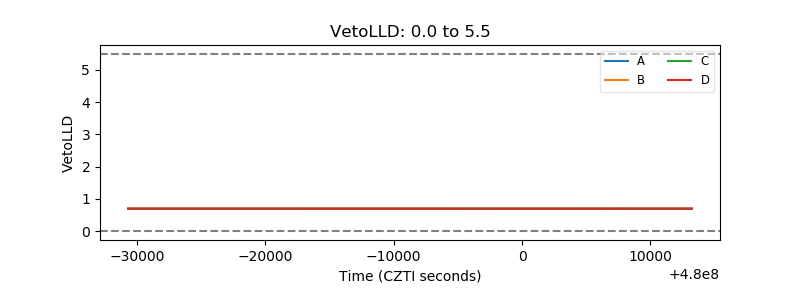 |
| Alpha Counter | 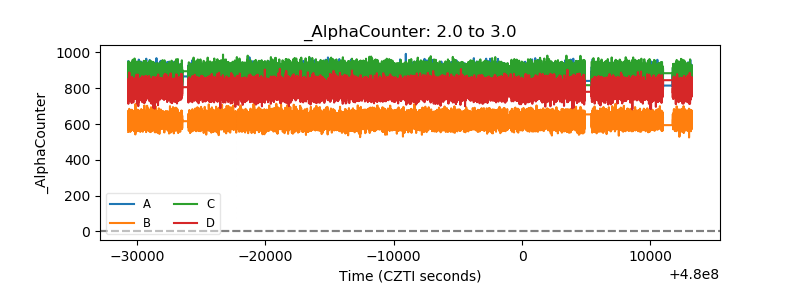 |
| _CPM_Rate | 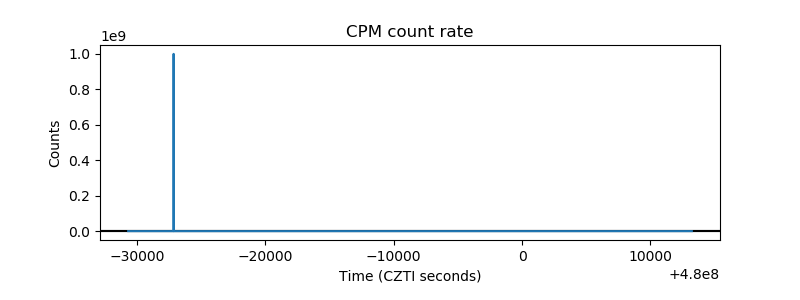 |
| CZT Counter | 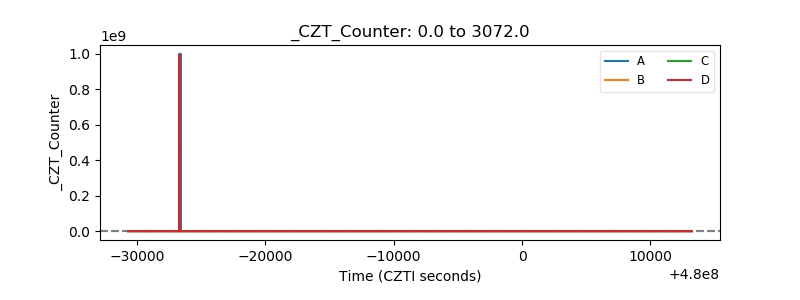 |
| +2.5 Volts monitor | 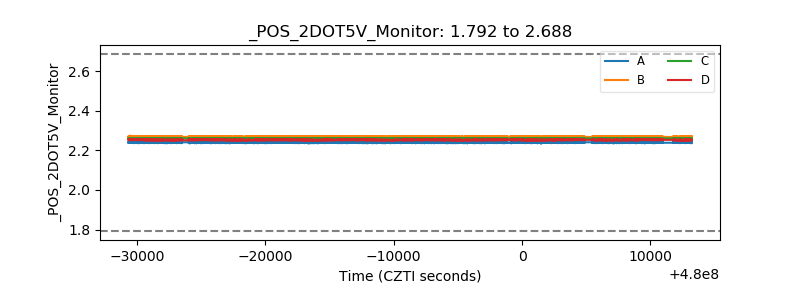 |
| +5 Volts monitor | 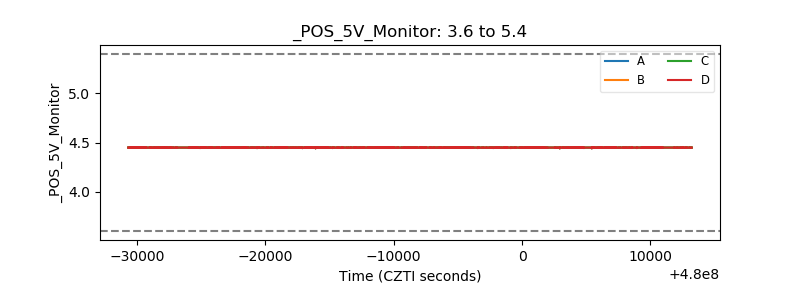 |
| _ROLL_ROT | 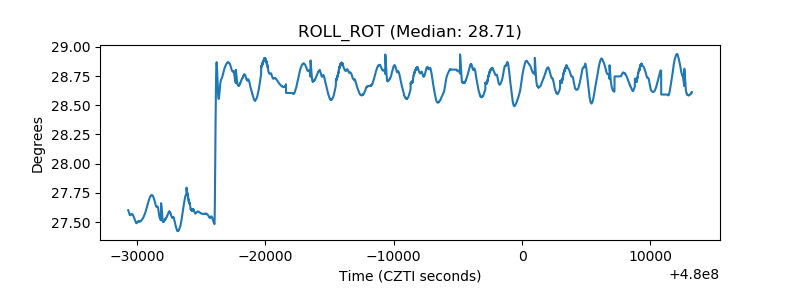 |
| _Roll_DEC | 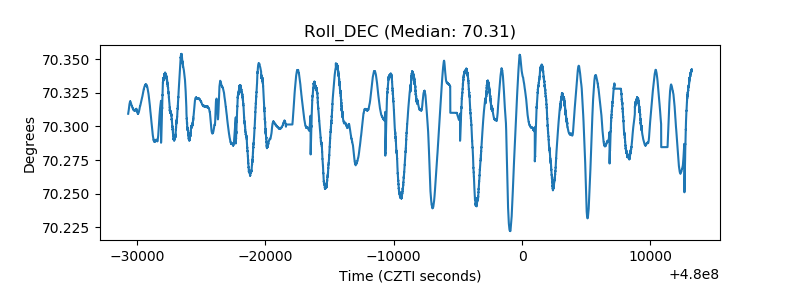 |
| _Roll_RA | 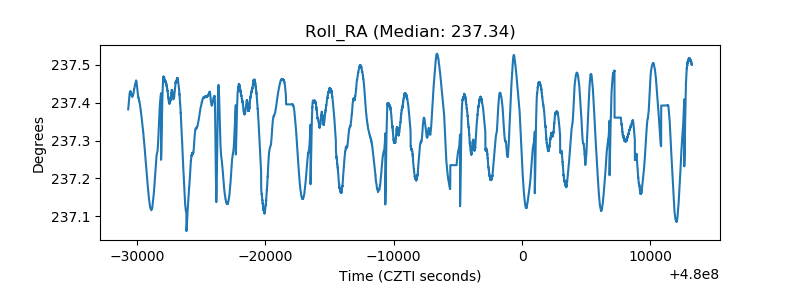 |
| Veto Counter | 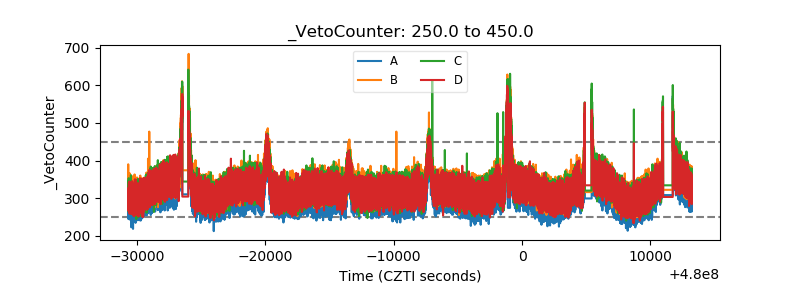 |