| Param | Original file | Final file |
|---|---|---|
| Filename | modeM0/AS1C07_001T01_9000006454_51229cztM0_level2.fits | modeM0/AS1C07_001T01_9000006454_51229cztM0_level2_quad_clean.evt |
| Size (bytes) | 539,758,080 | 94,806,720 |
| Size | 514.8 MB | 90.4 MB |
| Events in quadrant A | 4,760,344 | 627,375 |
| Events in quadrant B | 4,153,916 | 685,992 |
| Events in quadrant C | 6,663,847 | 509,327 |
| Events in quadrant D | 3,875,208 | 574,946 |
| Mode M0 | |||
|---|---|---|---|
| Quadrant | BADHDUFLAG | Total packets | Discarded packets |
| A | 0 | 18733 | 2 |
| B | 0 | 16998 | 2 |
| C | 0 | 24585 | 3 |
| D | 0 | 16374 | 3 |
| Mode SS | |||
|---|---|---|---|
| Quadrant | BADHDUFLAG | Total packets | Discarded packets |
| A | 0 | 138 | 0 |
| B | 0 | 138 | 0 |
| C | 0 | 138 | 0 |
| D | 0 | 138 | 0 |
| Mode M9 | |||
|---|---|---|---|
| Quadrant | BADHDUFLAG | Total packets | Discarded packets |
| A | 0 | 12 | 0 |
| B | 0 | 13 | 0 |
| C | 0 | 13 | 0 |
| D | 0 | 13 | 0 |
| Quadrant | Total seconds | Saturated seconds | Saturation percentage |
|---|---|---|---|
| A | 6784 | 248 | 3.655660% |
| B | 6785 | 148 | 2.181282% |
| C | 6784 | 1377 | 20.297759% |
| D | 6783 | 184 | 2.712664% |
Noise dominated data is calculated using 1-second bins in cleaned event files. If a bin has >2000 counts, and if more than 50% of those come from <1% of pixels, then it is considered to be noise-dominated and hence unusable.
| Quadrant | # 1 sec bins | Bins with >0 counts | Bins with >2000 counts | High rate bins dominated by noise | Noise dominated (total time) | Noise dominated (detector-on time) | Marked lightcurve |
|---|---|---|---|---|---|---|---|
| A | 7705 | 6786 | 145 | 145 | 1.88% | 2.14% | 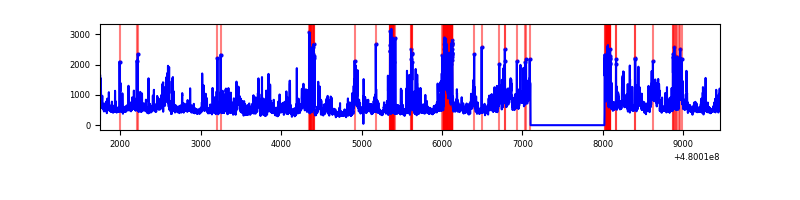 |
| B | 7705 | 6786 | 74 | 74 | 0.96% | 1.09% | 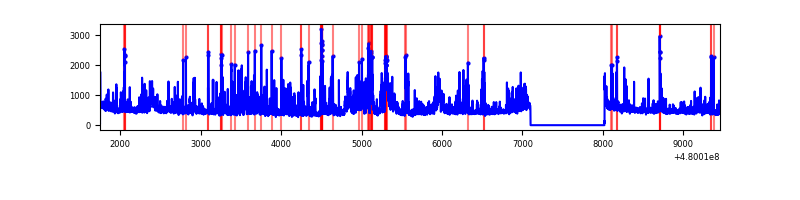 |
| C | 7704 | 6785 | 1060 | 1060 | 13.76% | 15.62% | 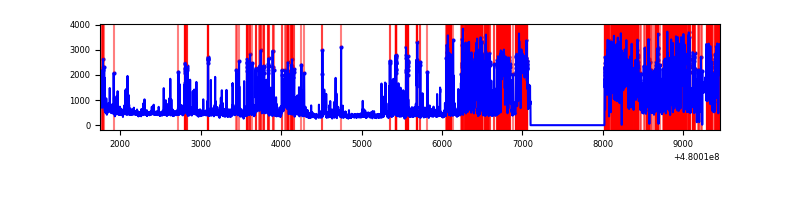 |
| D | 7704 | 6785 | 145 | 145 | 1.88% | 2.14% | 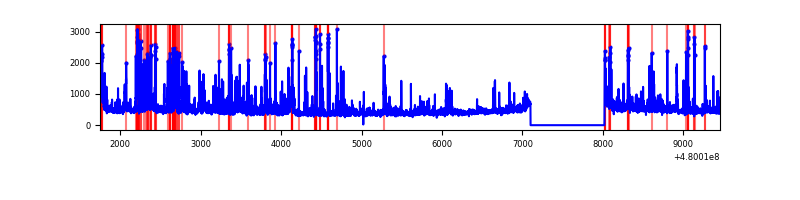 |
Top three noisy pixels from each quadrant. If the there are fewer than three noisy pixels in the level2.evt file, extra rows are filled as -1
| Pixel properties | Quadrant properties | ||||||
|---|---|---|---|---|---|---|---|
| Quadrant | DetID | PixID | Counts | Sigma | Mean | Median | Sigma |
| A | 12 | 3 | 700222 | 3959.11 | 714 | 698 | 176.7 |
| A | 3 | 114 | 223314 | 1259.94 | 714 | 698 | 176.7 |
| A | 9 | 191 | 166176 | 936.56 | 714 | 698 | 176.7 |
| B | 8 | 128 | 365612 | 2358.59 | 717 | 690 | 154.7 |
| B | 10 | 254 | 292370 | 1885.21 | 717 | 690 | 154.7 |
| B | 5 | 185 | 114806 | 737.56 | 717 | 690 | 154.7 |
| C | 4 | 12 | 3186040 | 18558.68 | 620 | 618 | 171.6 |
| C | 13 | 3 | 238244 | 1384.44 | 620 | 618 | 171.6 |
| C | 9 | 95 | 234208 | 1360.92 | 620 | 618 | 171.6 |
| D | 2 | 249 | 198240 | 1003.78 | 697 | 673 | 196.8 |
| D | 8 | 176 | 191403 | 969.04 | 697 | 673 | 196.8 |
| D | 2 | 207 | 150358 | 760.51 | 697 | 673 | 196.8 |
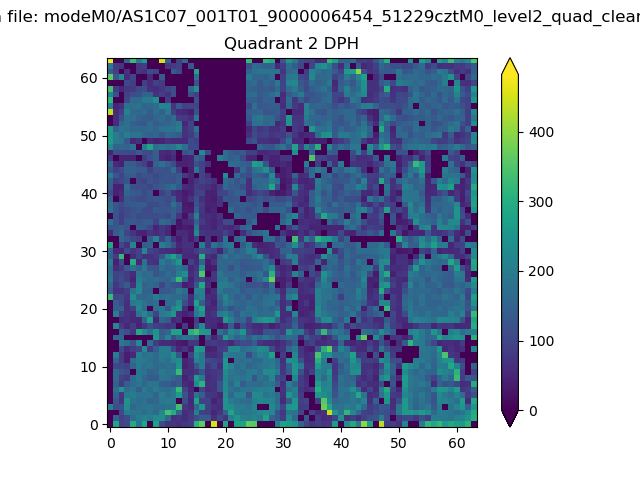
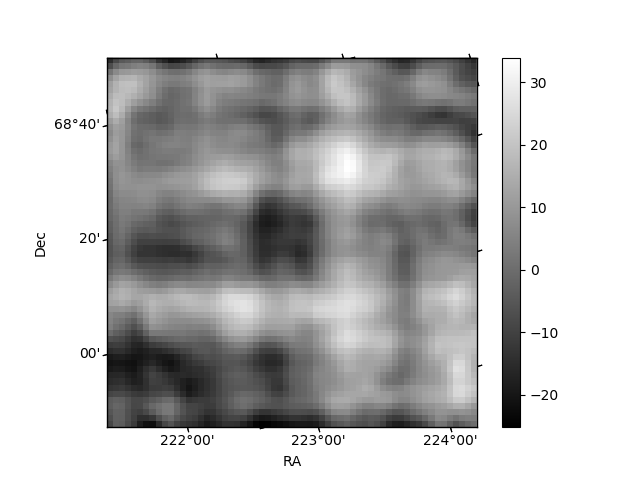
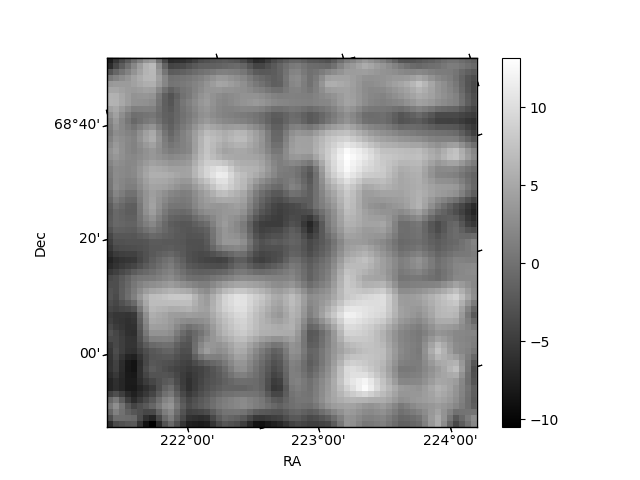
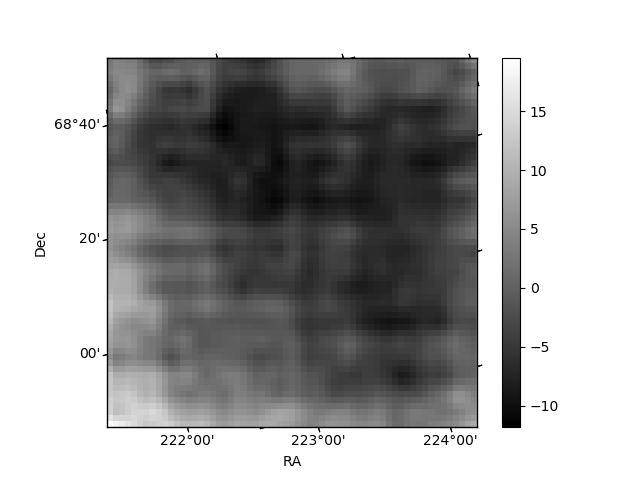
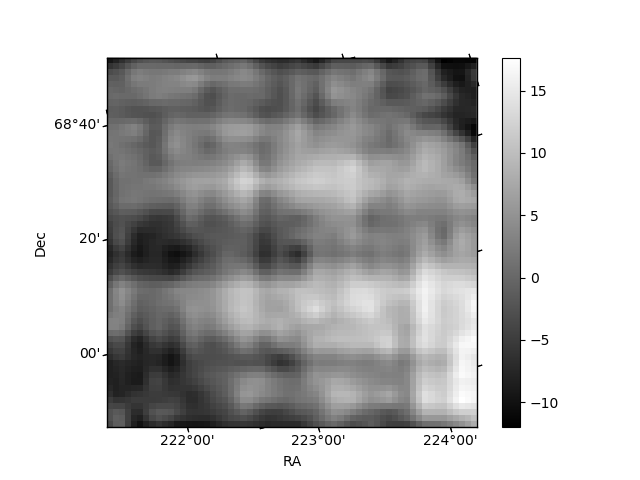
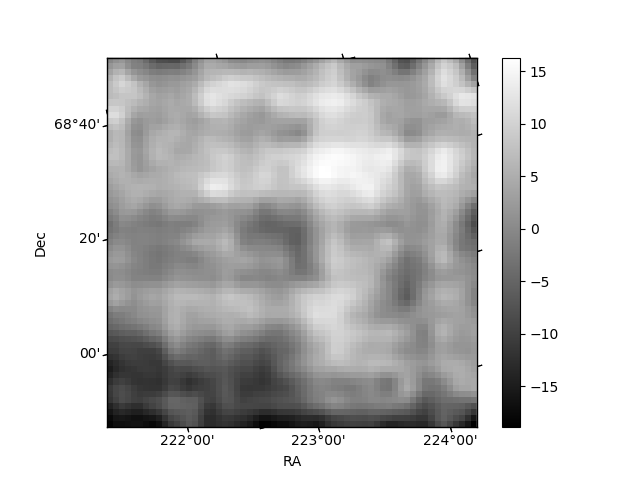
Histogram calculated using DETX and DETY for each event in the final _common_clean file
| Quadrant A | 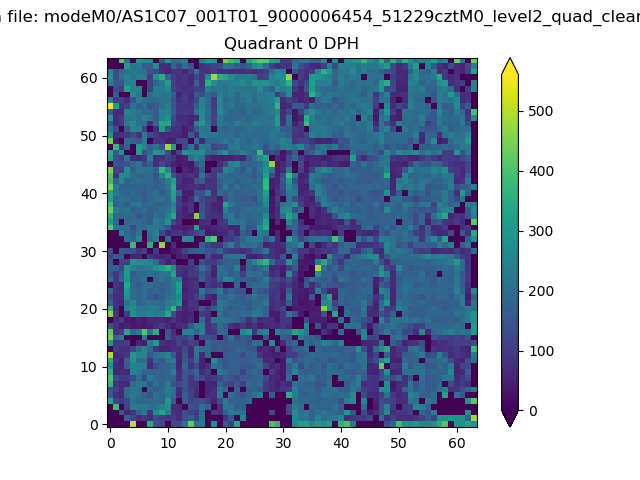 |
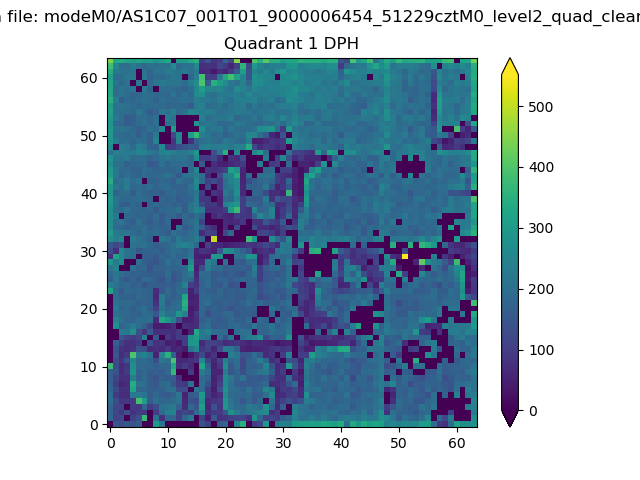 |
Quadrant B |
|---|---|---|---|
| Quadrant D | 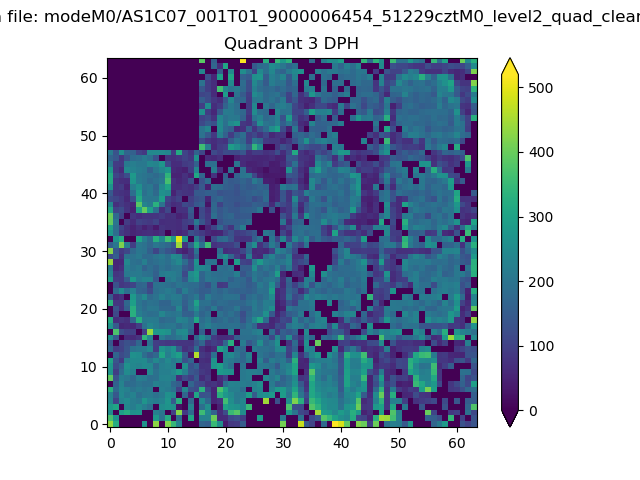 |
 |
Quadrant C |
| Plot type | Count rate plots | Images |
|---|---|---|
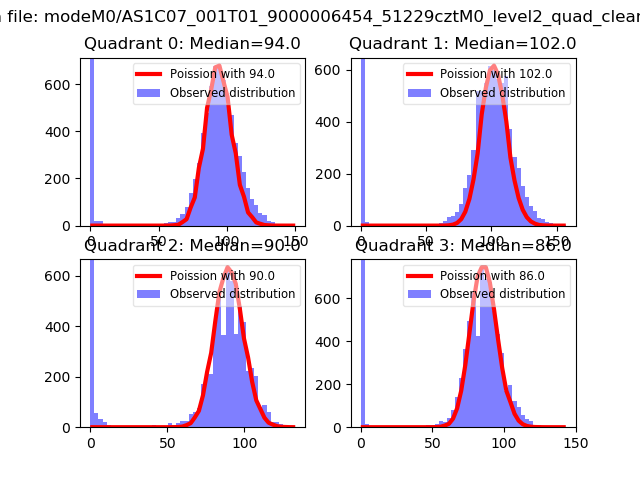
| Comparison with Poisson distribution Blue bars denote a histogram of data divided into 1 sec bins. Red curve is a Poisson curve with rate = median count rate of data. |
 |
 |
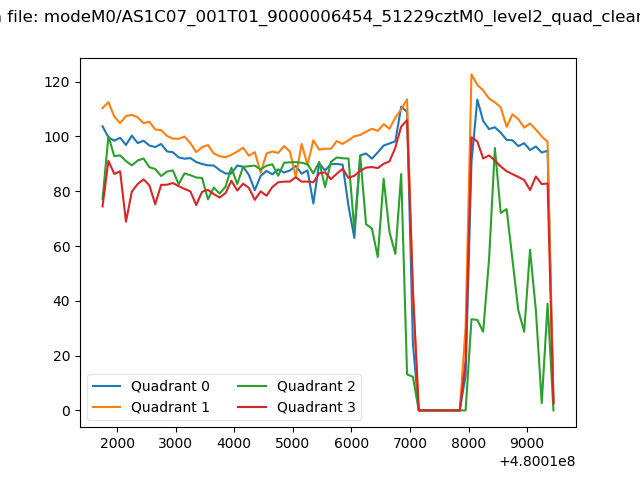
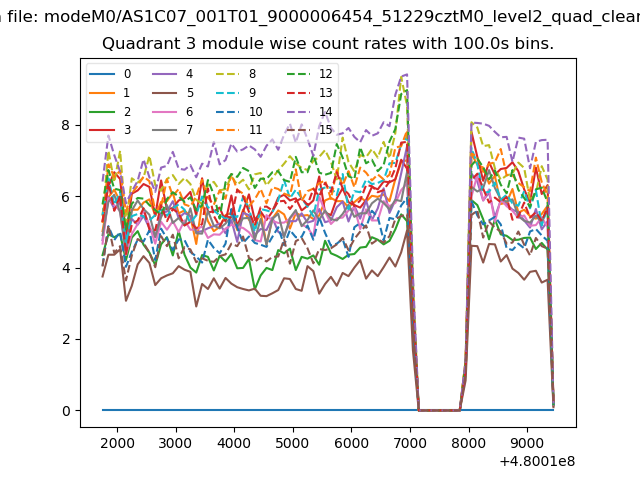
| Quadrant-wise count rates Data is divided into 100 sec bins |
 |
|
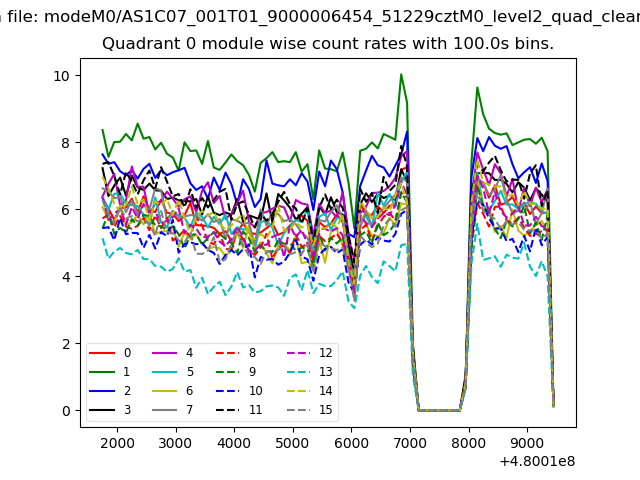
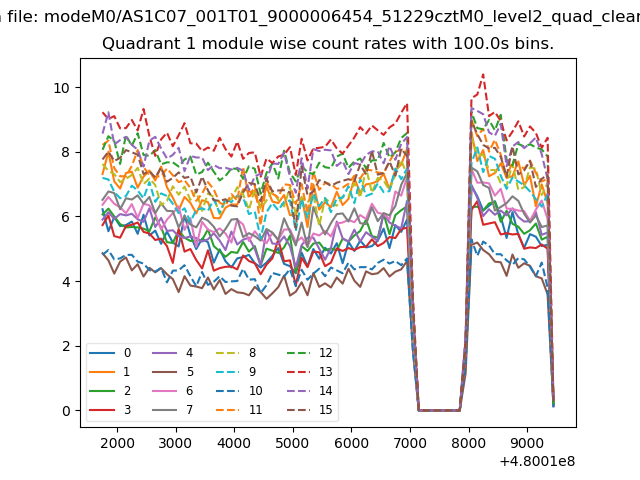
| Module-wise count rates for Quadrant A Data is divided into 100 sec bins |
 |
 |
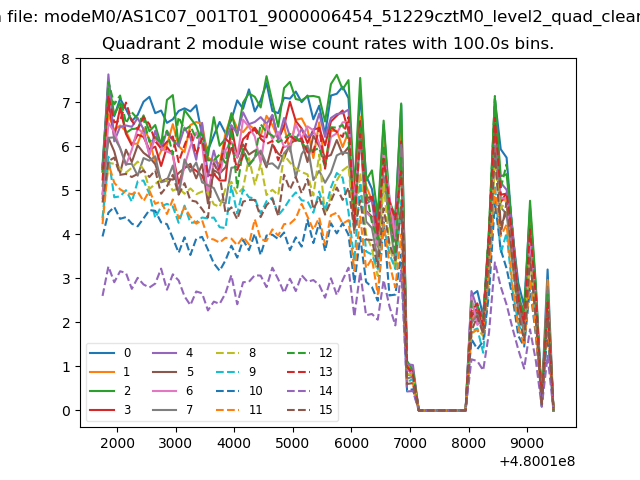
| Module-wise count rates for Quadrant B Data is divided into 100 sec bins |
 |
 |
| Module-wise count rates for Quadrant C Data is divided into 100 sec bins |
 |
 |
| Module-wise count rates for Quadrant D Data is divided into 100 sec bins |
 |
 |
| Parameter | Plot |
|---|---|
| CZT HV Monitor |  |
| D_VDD | 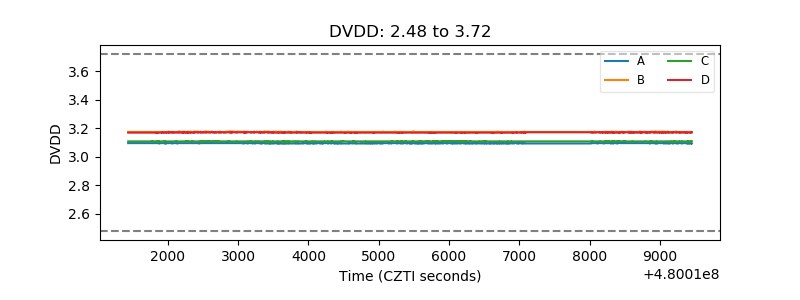 |
| Temperature 1 | 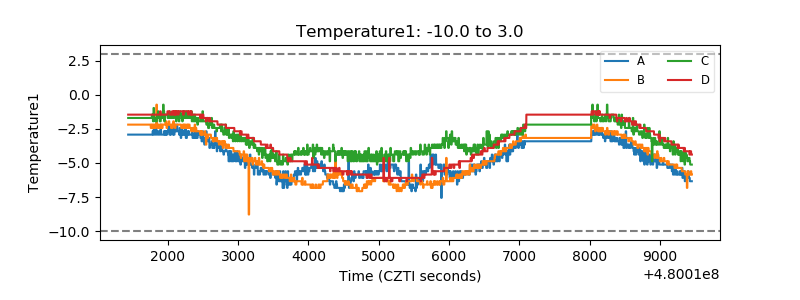 |
| Veto HV Monitor | 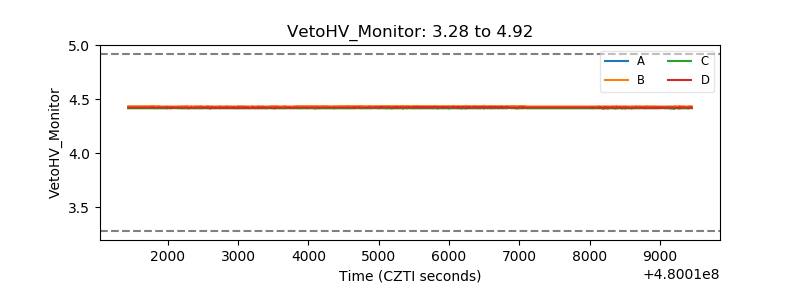 |
| Veto LLD | 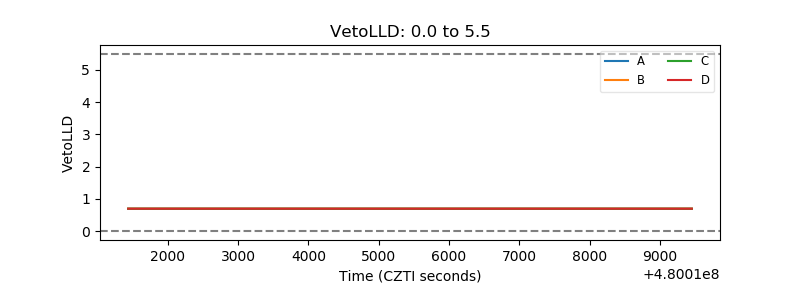 |
| Alpha Counter | 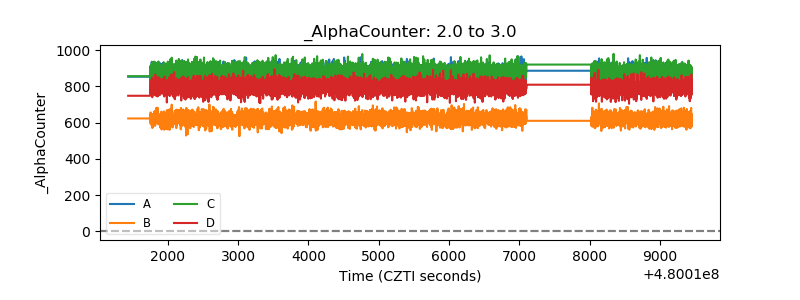 |
| _CPM_Rate | 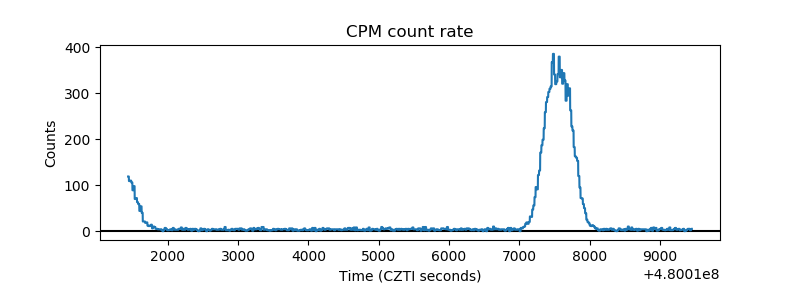 |
| CZT Counter | 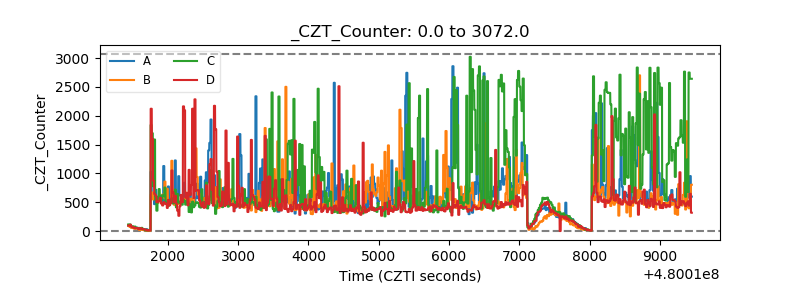 |
| +2.5 Volts monitor | 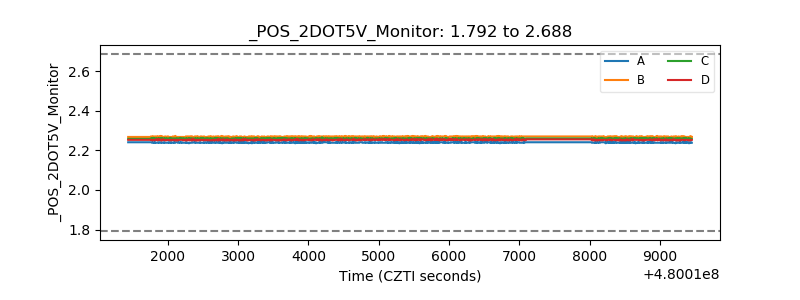 |
| +5 Volts monitor | 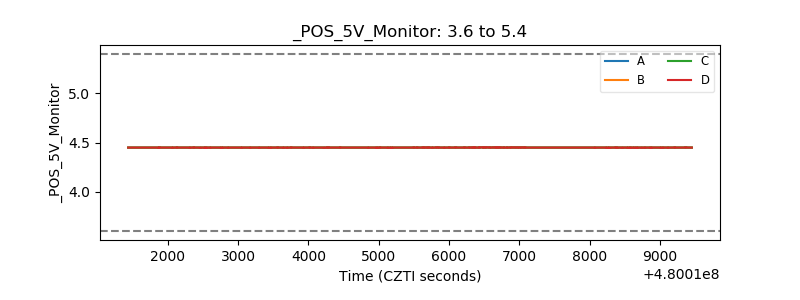 |
| _ROLL_ROT | 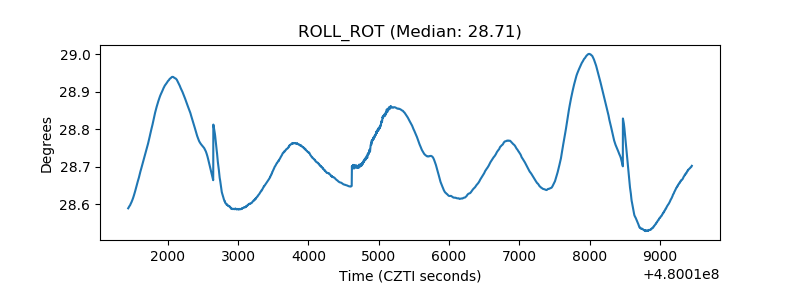 |
| _Roll_DEC | 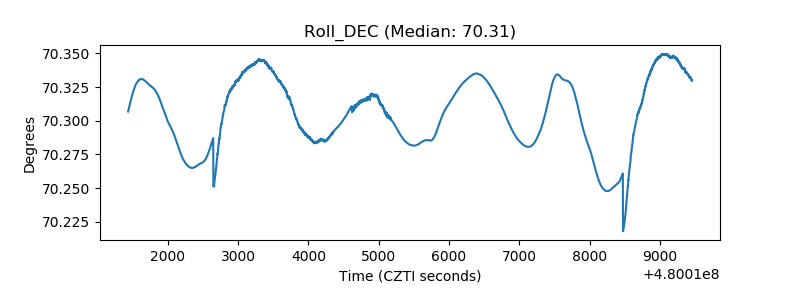 |
| _Roll_RA | 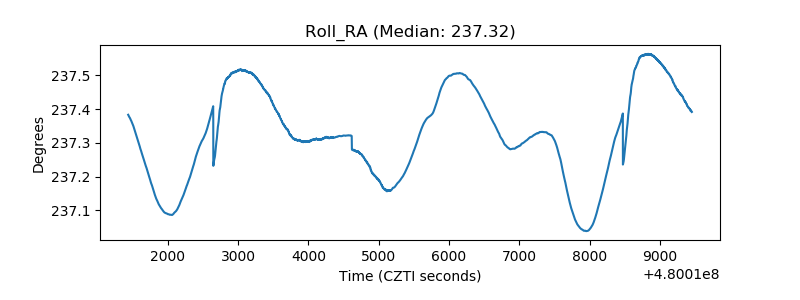 |
| Veto Counter | 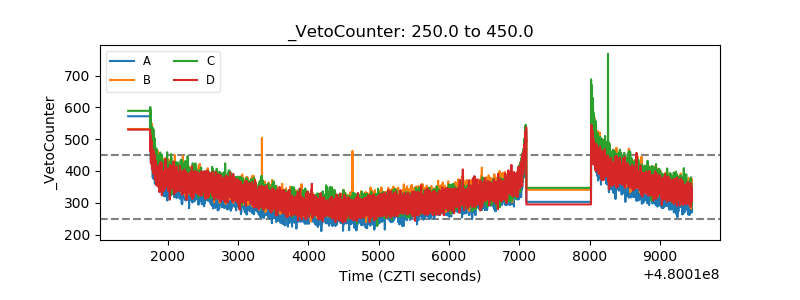 |