| Param | Original file | Final file |
|---|---|---|
| Filename | modeM0/AS1C07_001T01_9000006454_51231cztM0_level2.fits | modeM0/AS1C07_001T01_9000006454_51231cztM0_level2_quad_clean.evt |
| Size (bytes) | 585,426,240 | 84,934,080 |
| Size | 558.3 MB | 81.0 MB |
| Events in quadrant A | 4,612,013 | 579,910 |
| Events in quadrant B | 4,434,134 | 630,514 |
| Events in quadrant C | 8,400,357 | 386,177 |
| Events in quadrant D | 3,738,582 | 539,029 |
| Mode M0 | |||
|---|---|---|---|
| Quadrant | BADHDUFLAG | Total packets | Discarded packets |
| A | 0 | 17977 | 1 |
| B | 0 | 17446 | 1 |
| C | 0 | 29227 | 1 |
| D | 0 | 15629 | 1 |
| Mode SS | |||
|---|---|---|---|
| Quadrant | BADHDUFLAG | Total packets | Discarded packets |
| A | 0 | 126 | 0 |
| B | 0 | 126 | 0 |
| C | 0 | 126 | 0 |
| D | 0 | 126 | 0 |
| Mode M9 | |||
|---|---|---|---|
| Quadrant | BADHDUFLAG | Total packets | Discarded packets |
| A | 0 | 11 | 0 |
| B | 0 | 11 | 0 |
| C | 0 | 11 | 0 |
| D | 0 | 11 | 0 |
| Quadrant | Total seconds | Saturated seconds | Saturation percentage |
|---|---|---|---|
| A | 6251 | 224 | 3.583427% |
| B | 6251 | 290 | 4.639258% |
| C | 6252 | 2320 | 37.108125% |
| D | 6252 | 146 | 2.335253% |
Noise dominated data is calculated using 1-second bins in cleaned event files. If a bin has >2000 counts, and if more than 50% of those come from <1% of pixels, then it is considered to be noise-dominated and hence unusable.
| Quadrant | # 1 sec bins | Bins with >0 counts | Bins with >2000 counts | High rate bins dominated by noise | Noise dominated (total time) | Noise dominated (detector-on time) | Marked lightcurve |
|---|---|---|---|---|---|---|---|
| A | 7296 | 6252 | 138 | 138 | 1.89% | 2.21% | 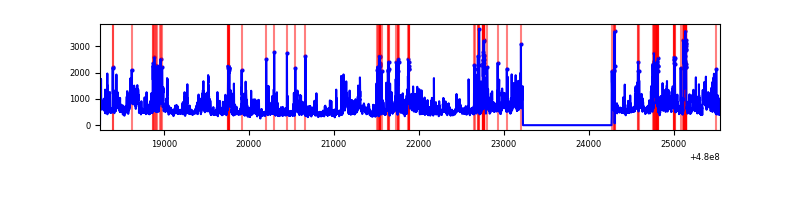 |
| B | 7296 | 6252 | 192 | 192 | 2.63% | 3.07% | 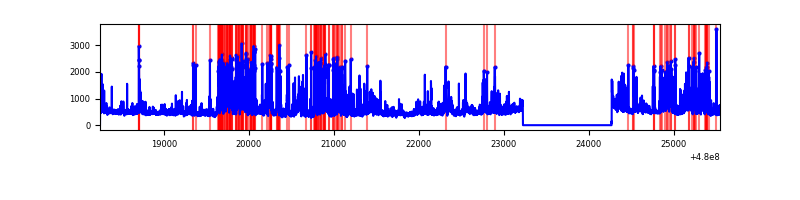 |
| C | 7297 | 6253 | 1788 | 1788 | 24.50% | 28.59% | 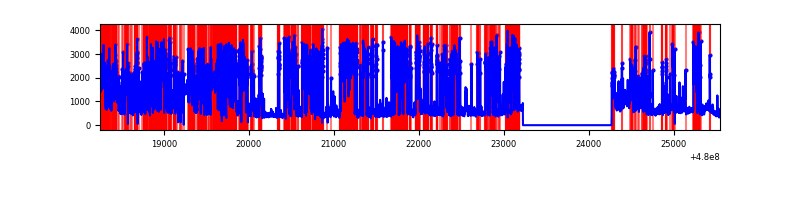 |
| D | 7297 | 6253 | 104 | 104 | 1.43% | 1.66% | 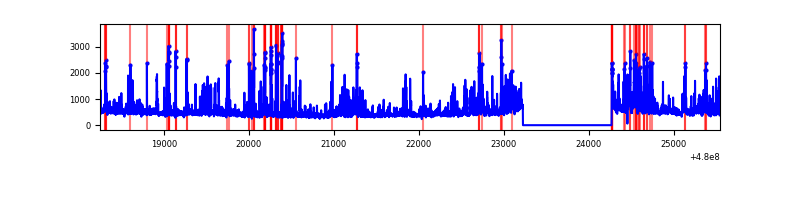 |
Top three noisy pixels from each quadrant. If the there are fewer than three noisy pixels in the level2.evt file, extra rows are filled as -1
| Pixel properties | Quadrant properties | ||||||
|---|---|---|---|---|---|---|---|
| Quadrant | DetID | PixID | Counts | Sigma | Mean | Median | Sigma |
| A | 12 | 3 | 702378 | 4368.69 | 647 | 631 | 160.6 |
| A | 9 | 160 | 280558 | 1742.67 | 647 | 631 | 160.6 |
| A | 8 | 249 | 248310 | 1541.91 | 647 | 631 | 160.6 |
| B | 5 | 185 | 743079 | 5286.13 | 651 | 628 | 140.5 |
| B | 8 | 128 | 529363 | 3764.51 | 651 | 628 | 140.5 |
| B | 10 | 254 | 97349 | 688.64 | 651 | 628 | 140.5 |
| C | 4 | 12 | 5327848 | 39476.04 | 484 | 479 | 135.0 |
| C | 9 | 95 | 247963 | 1833.86 | 484 | 479 | 135.0 |
| C | 12 | 247 | 185215 | 1368.9 | 484 | 479 | 135.0 |
| D | 3 | 12 | 297542 | 1659.27 | 636 | 614 | 179.0 |
| D | 8 | 176 | 159987 | 890.6 | 636 | 614 | 179.0 |
| D | 10 | 181 | 154951 | 862.45 | 636 | 614 | 179.0 |
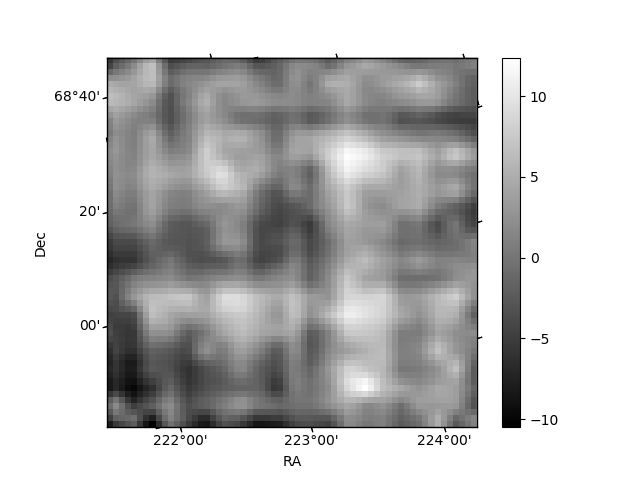
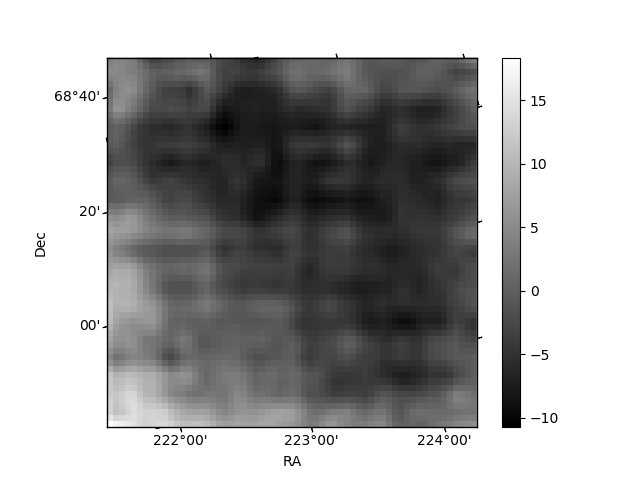
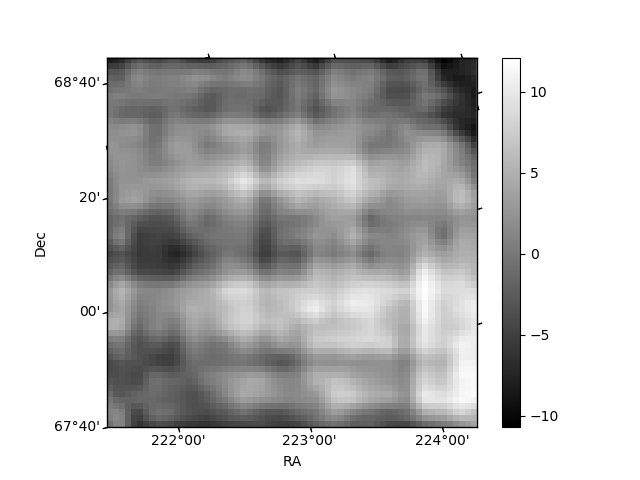
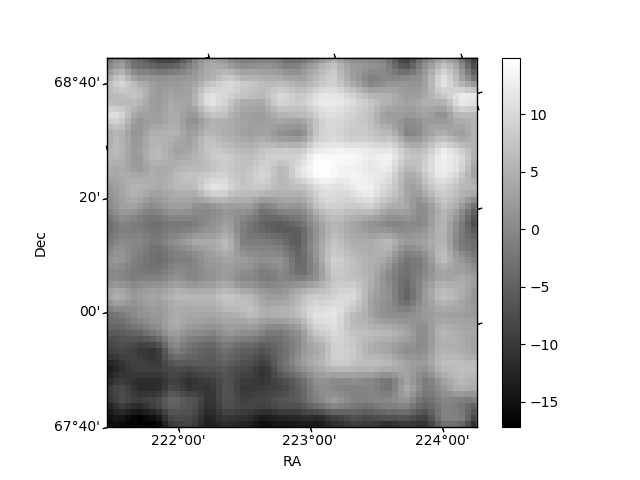
Histogram calculated using DETX and DETY for each event in the final _common_clean file
| Quadrant A | 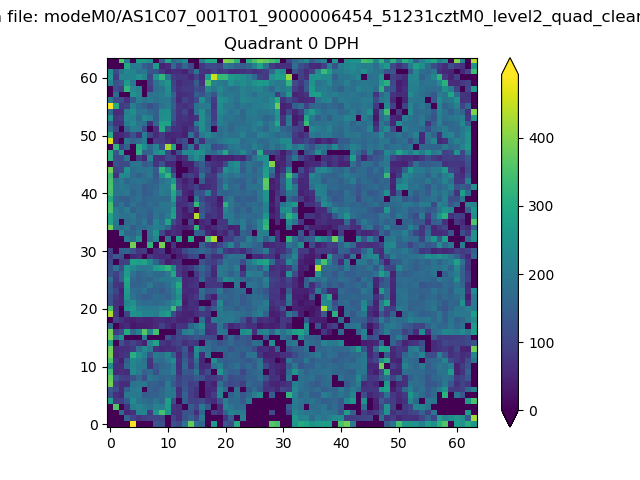 |
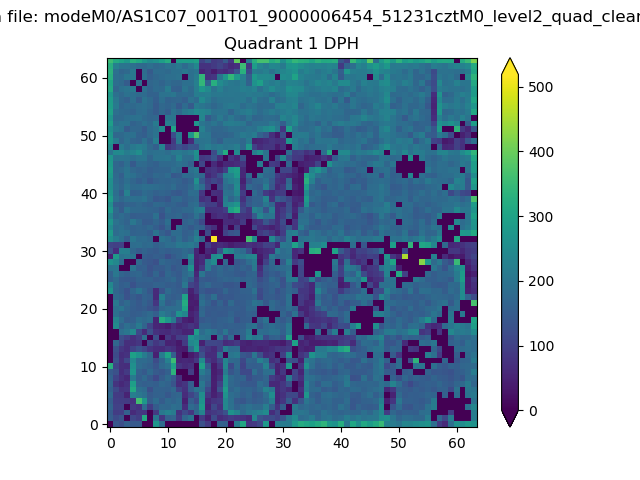 |
Quadrant B |
|---|---|---|---|
| Quadrant D | 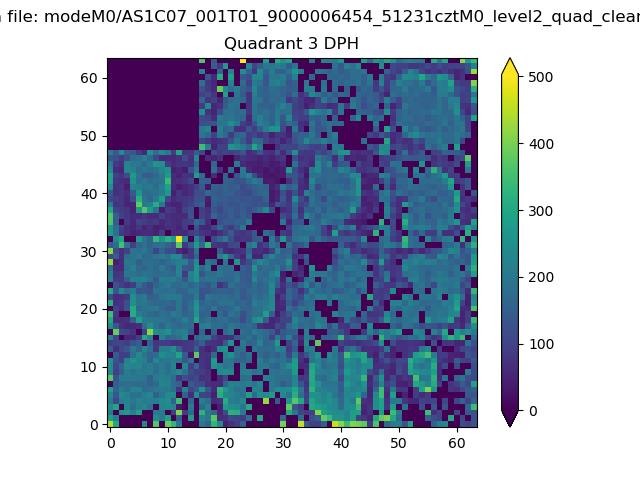 |
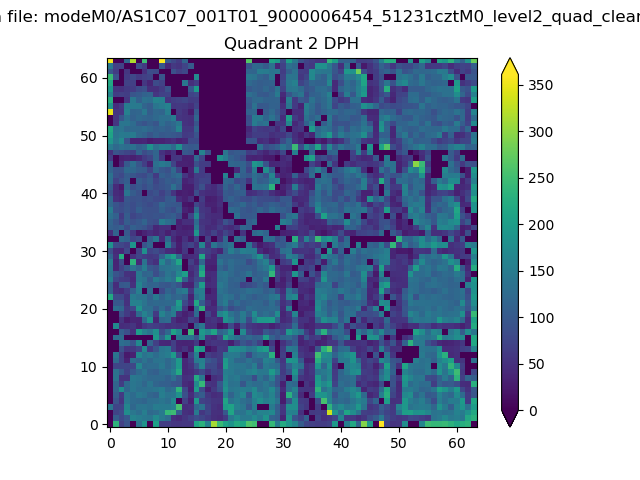 |
Quadrant C |
| Plot type | Count rate plots | Images |
|---|---|---|
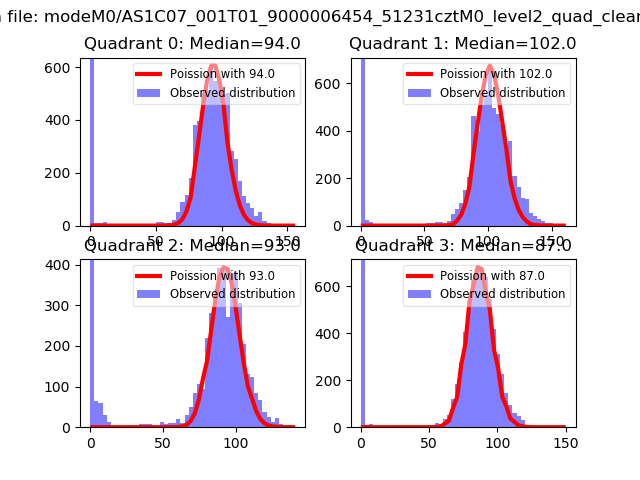
| Comparison with Poisson distribution Blue bars denote a histogram of data divided into 1 sec bins. Red curve is a Poisson curve with rate = median count rate of data. |
 |
 |
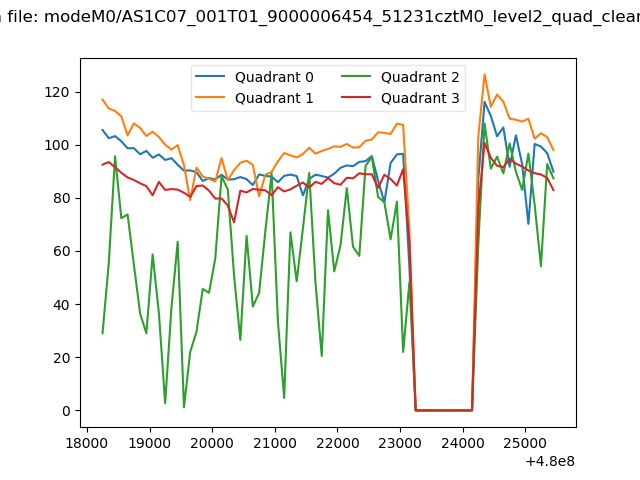
| Quadrant-wise count rates Data is divided into 100 sec bins |
 |
|
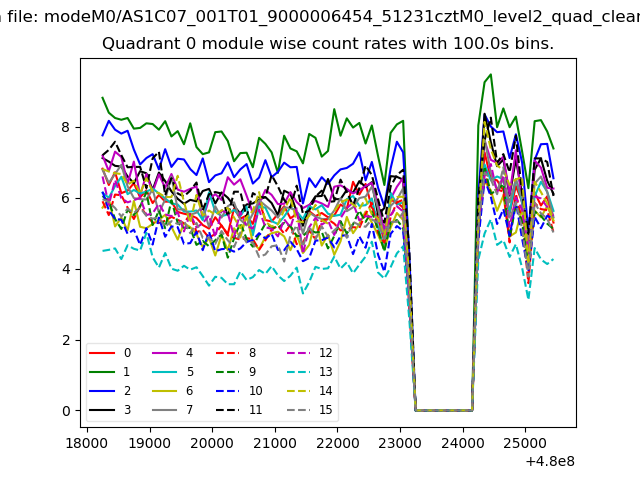
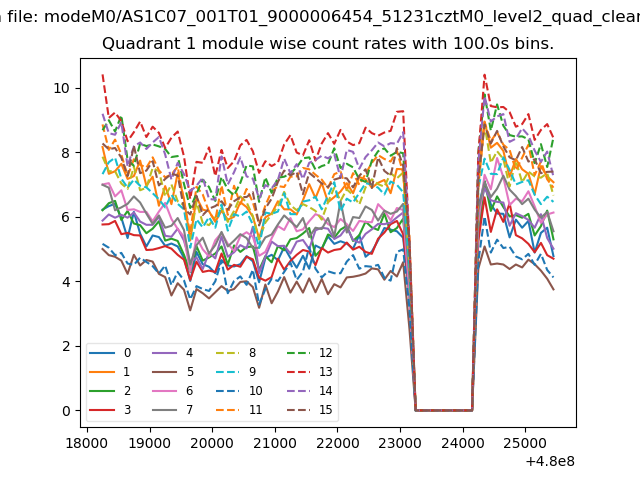
| Module-wise count rates for Quadrant A Data is divided into 100 sec bins |
 |
 |
| Module-wise count rates for Quadrant B Data is divided into 100 sec bins |
 |
 |
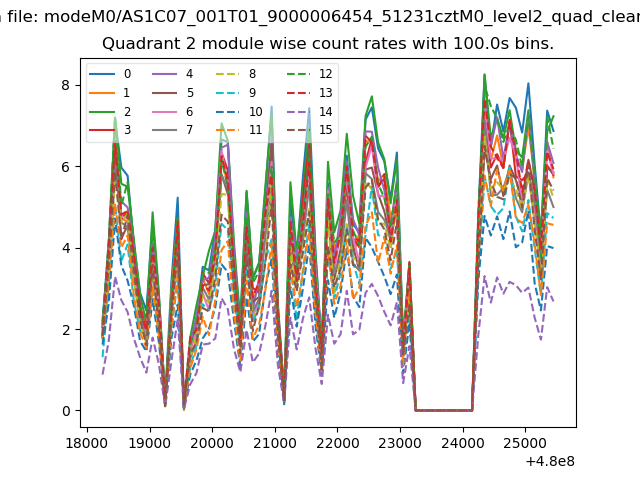
| Module-wise count rates for Quadrant C Data is divided into 100 sec bins |
 |
 |
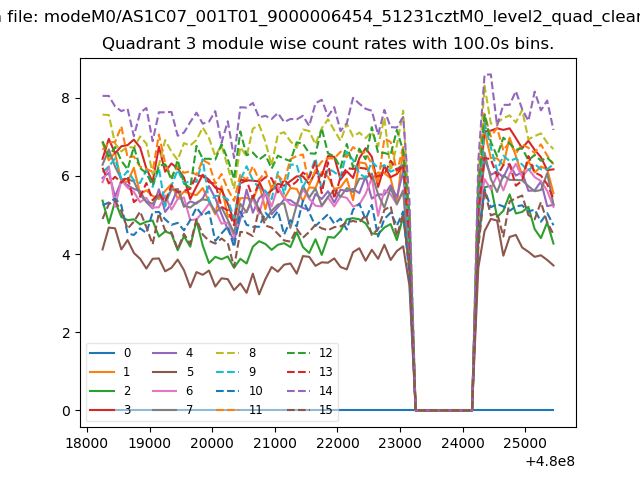
| Module-wise count rates for Quadrant D Data is divided into 100 sec bins |
 |
 |
| Parameter | Plot |
|---|---|
| CZT HV Monitor | 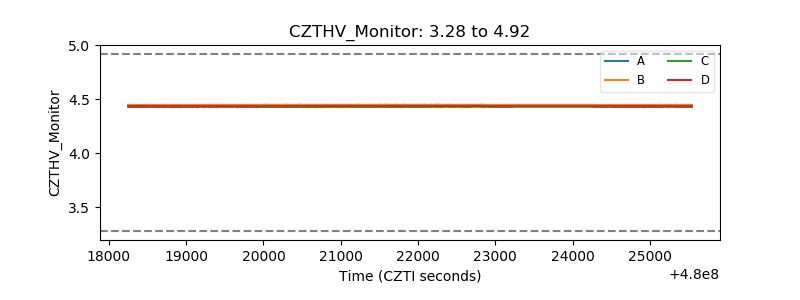 |
| D_VDD | 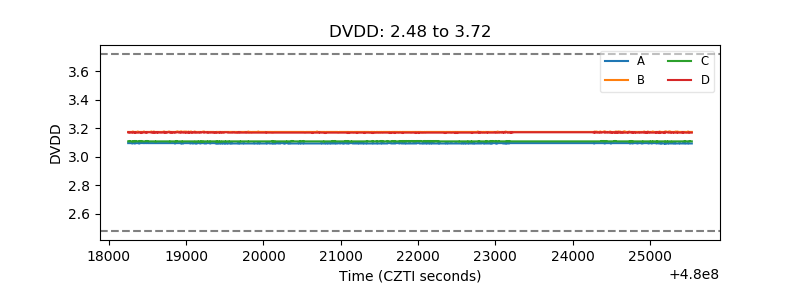 |
| Temperature 1 | 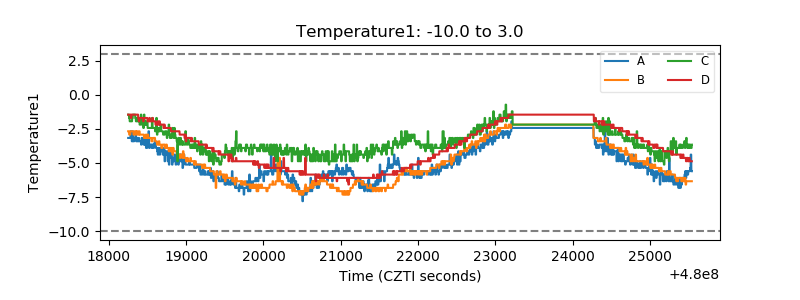 |
| Veto HV Monitor | 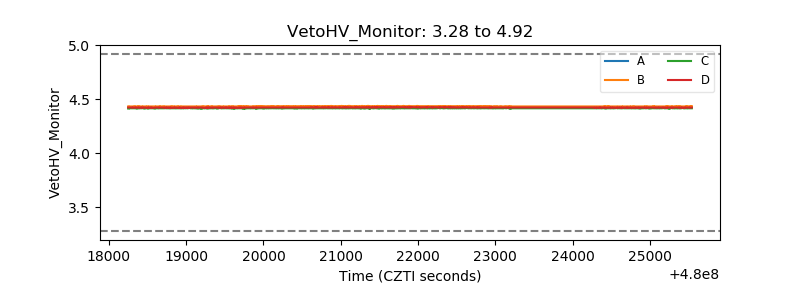 |
| Veto LLD | 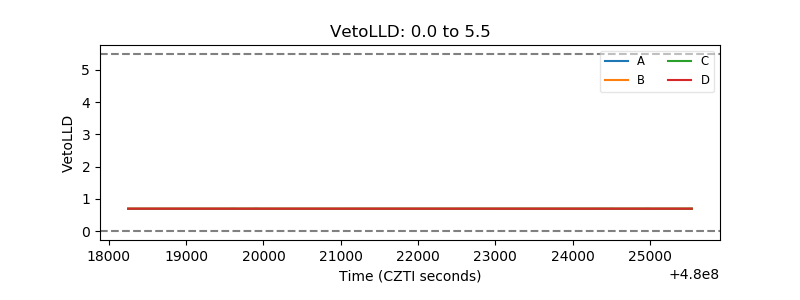 |
| Alpha Counter | 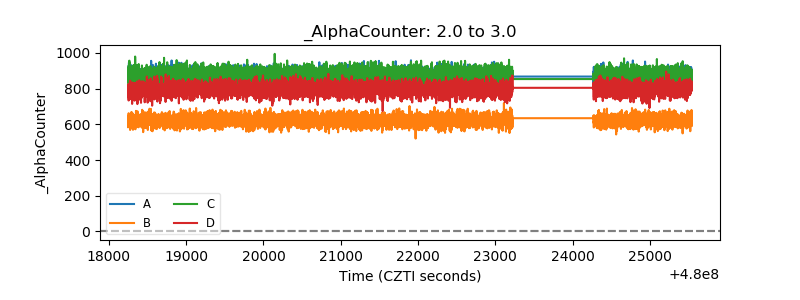 |
| _CPM_Rate | 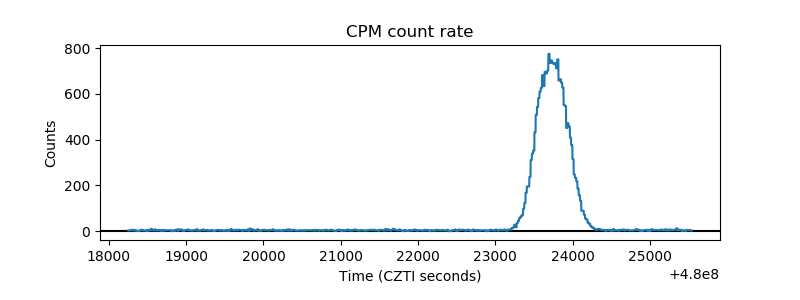 |
| CZT Counter | 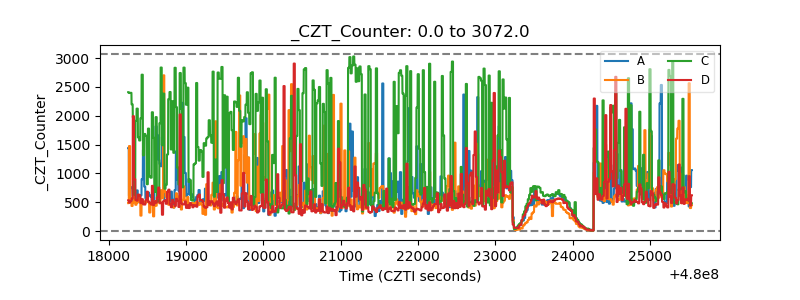 |
| +2.5 Volts monitor | 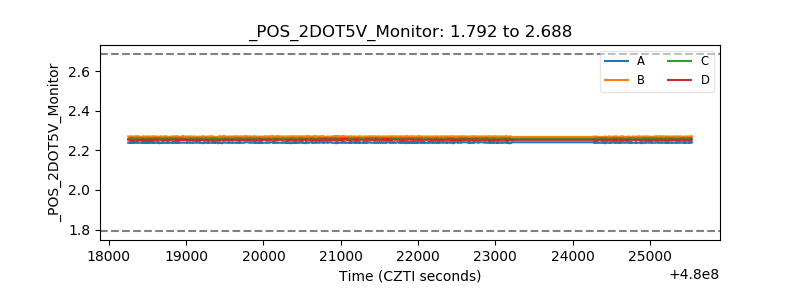 |
| +5 Volts monitor | 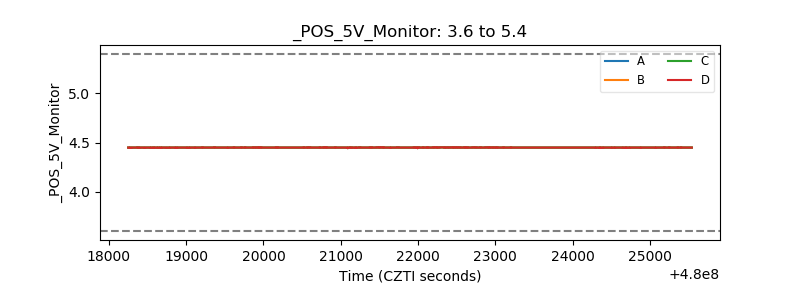 |
| _ROLL_ROT | 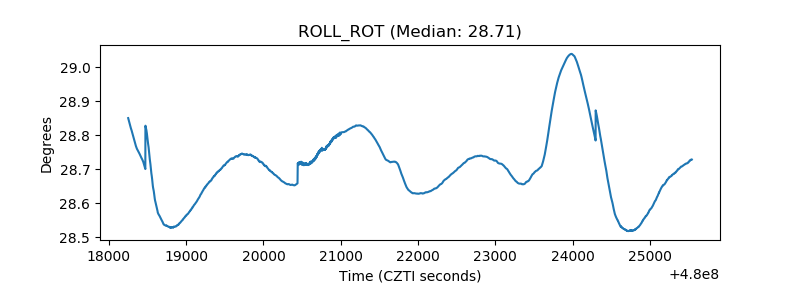 |
| _Roll_DEC | 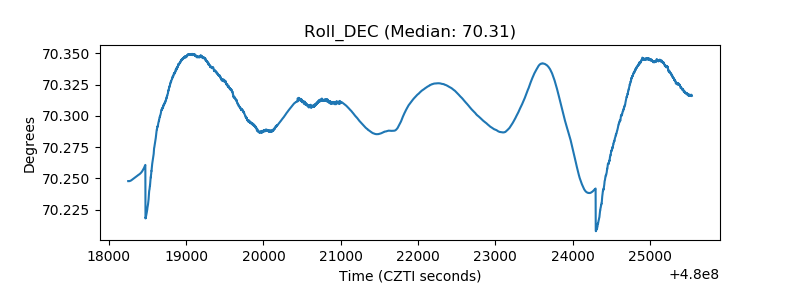 |
| _Roll_RA | 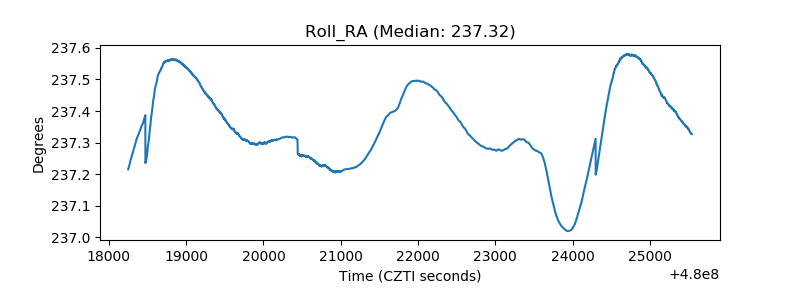 |
| Veto Counter | 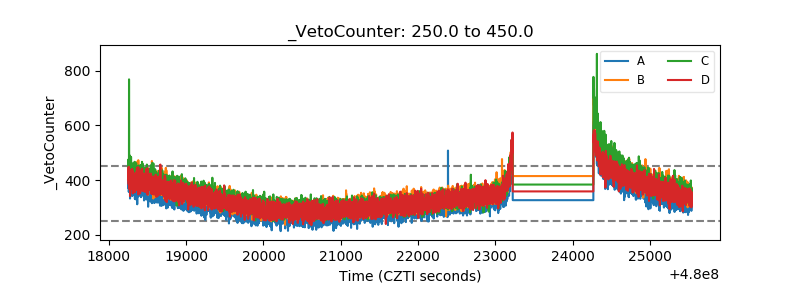 |