| Param | Original file | Final file |
|---|---|---|
| Filename | modeM0/AS1C07_001T01_9000006454_51232cztM0_level2.fits | modeM0/AS1C07_001T01_9000006454_51232cztM0_level2_quad_clean.evt |
| Size (bytes) | 504,964,800 | 96,050,880 |
| Size | 481.6 MB | 91.6 MB |
| Events in quadrant A | 5,413,609 | 611,955 |
| Events in quadrant B | 4,497,300 | 674,268 |
| Events in quadrant C | 4,518,874 | 595,661 |
| Events in quadrant D | 3,757,378 | 572,751 |
| Mode M0 | |||
|---|---|---|---|
| Quadrant | BADHDUFLAG | Total packets | Discarded packets |
| A | 0 | 20619 | 2 |
| B | 0 | 17946 | 2 |
| C | 0 | 18087 | 2 |
| D | 0 | 16097 | 2 |
| Mode SS | |||
|---|---|---|---|
| Quadrant | BADHDUFLAG | Total packets | Discarded packets |
| A | 0 | 134 | 0 |
| B | 0 | 134 | 0 |
| C | 0 | 134 | 0 |
| D | 0 | 134 | 0 |
| Mode M9 | |||
|---|---|---|---|
| Quadrant | BADHDUFLAG | Total packets | Discarded packets |
| A | 0 | 22 | 0 |
| B | 0 | 22 | 0 |
| C | 0 | 22 | 0 |
| D | 0 | 22 | 0 |
| Quadrant | Total seconds | Saturated seconds | Saturation percentage |
|---|---|---|---|
| A | 6506 | 274 | 4.211497% |
| B | 6507 | 336 | 5.163670% |
| C | 6507 | 453 | 6.961734% |
| D | 6507 | 183 | 2.812356% |
Noise dominated data is calculated using 1-second bins in cleaned event files. If a bin has >2000 counts, and if more than 50% of those come from <1% of pixels, then it is considered to be noise-dominated and hence unusable.
| Quadrant | # 1 sec bins | Bins with >0 counts | Bins with >2000 counts | High rate bins dominated by noise | Noise dominated (total time) | Noise dominated (detector-on time) | Marked lightcurve |
|---|---|---|---|---|---|---|---|
| A | 8731 | 6507 | 144 | 144 | 1.65% | 2.21% | 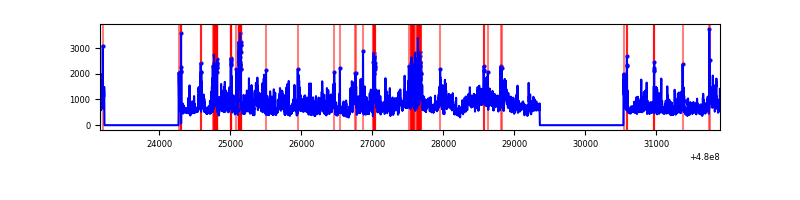 |
| B | 8732 | 6508 | 194 | 194 | 2.22% | 2.98% | 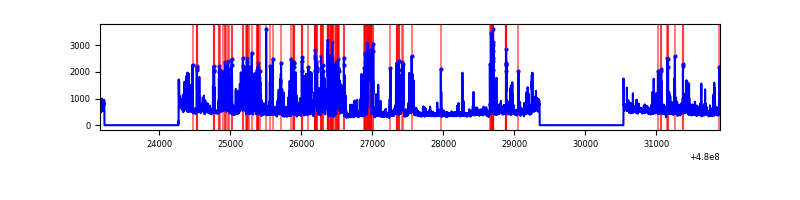 |
| C | 8732 | 6508 | 342 | 342 | 3.92% | 5.26% | 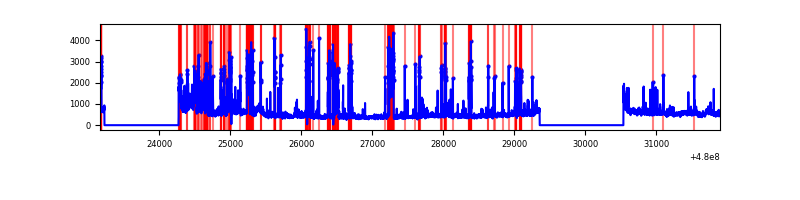 |
| D | 8732 | 6508 | 151 | 151 | 1.73% | 2.32% | 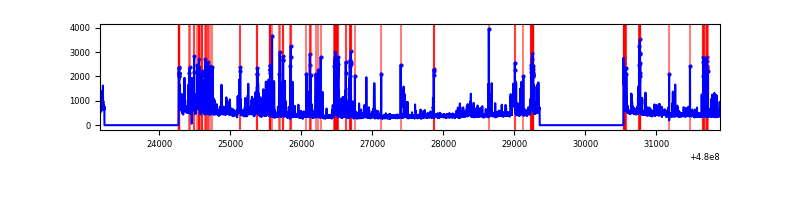 |
Top three noisy pixels from each quadrant. If the there are fewer than three noisy pixels in the level2.evt file, extra rows are filled as -1
| Pixel properties | Quadrant properties | ||||||
|---|---|---|---|---|---|---|---|
| Quadrant | DetID | PixID | Counts | Sigma | Mean | Median | Sigma |
| A | 12 | 3 | 1055348 | 6228.73 | 678 | 661 | 169.3 |
| A | 9 | 160 | 682238 | 4025.23 | 678 | 661 | 169.3 |
| A | 8 | 249 | 213985 | 1259.84 | 678 | 661 | 169.3 |
| B | 5 | 185 | 582566 | 4043.66 | 683 | 658 | 143.9 |
| B | 8 | 128 | 445899 | 3093.96 | 683 | 658 | 143.9 |
| B | 7 | 252 | 241368 | 1672.68 | 683 | 658 | 143.9 |
| C | 4 | 12 | 1066962 | 5805.71 | 662 | 657 | 183.7 |
| C | 12 | 247 | 212561 | 1153.75 | 662 | 657 | 183.7 |
| C | 13 | 3 | 143439 | 777.4 | 662 | 657 | 183.7 |
| D | 3 | 12 | 416432 | 2231.99 | 665 | 642 | 186.3 |
| D | 10 | 172 | 154846 | 827.78 | 665 | 642 | 186.3 |
| D | 2 | 216 | 100700 | 537.12 | 665 | 642 | 186.3 |
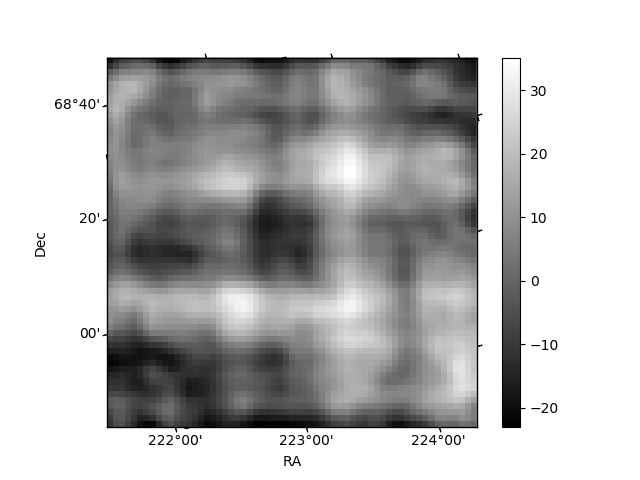
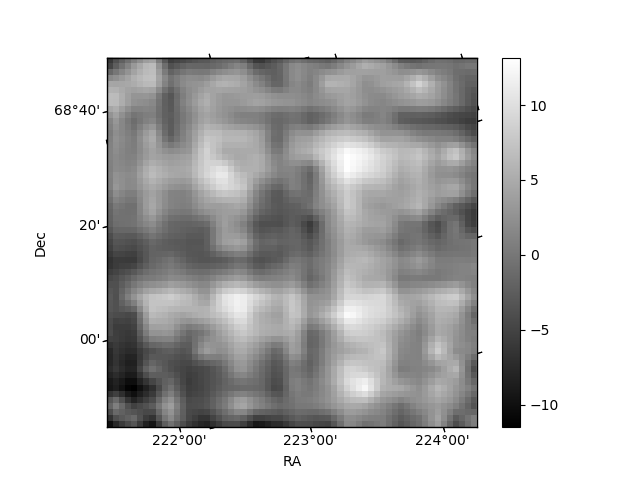
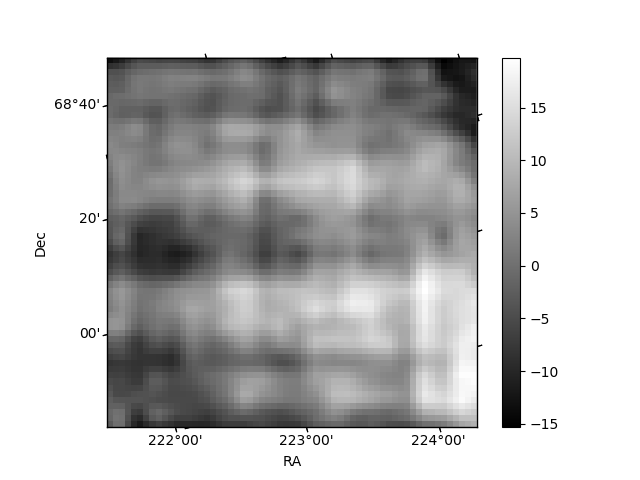
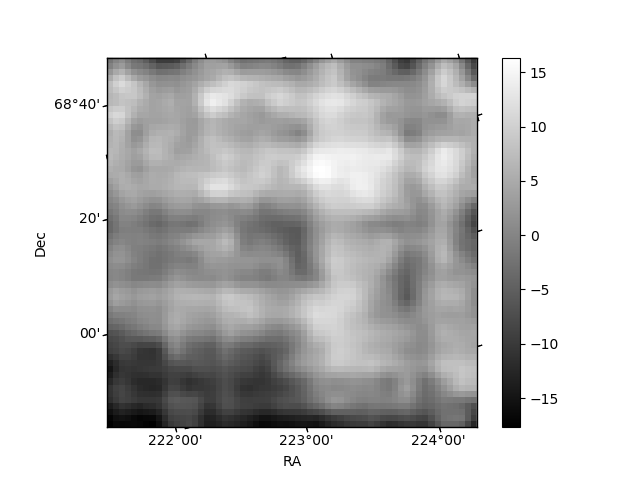
Histogram calculated using DETX and DETY for each event in the final _common_clean file
| Quadrant A | 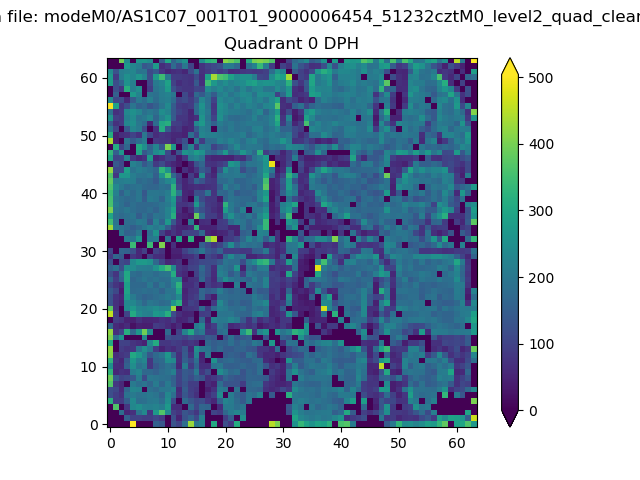 |
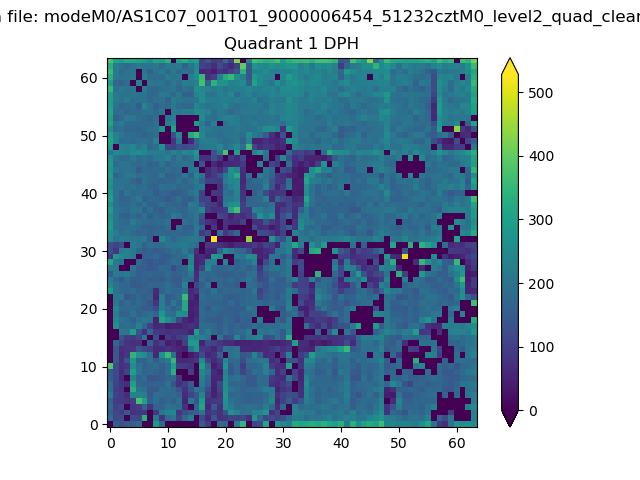 |
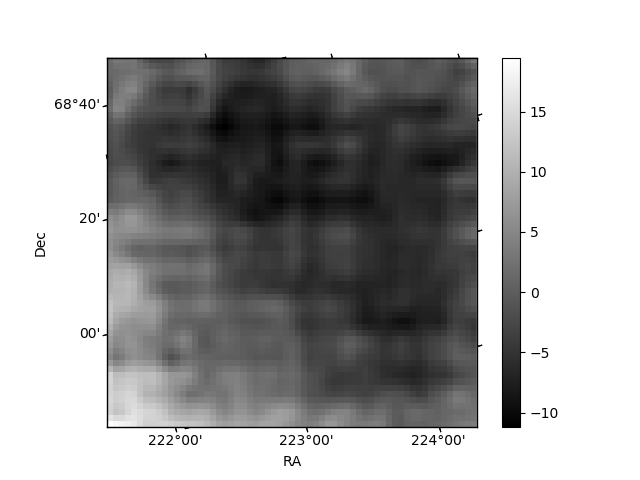
Quadrant B |
|---|---|---|---|
| Quadrant D | 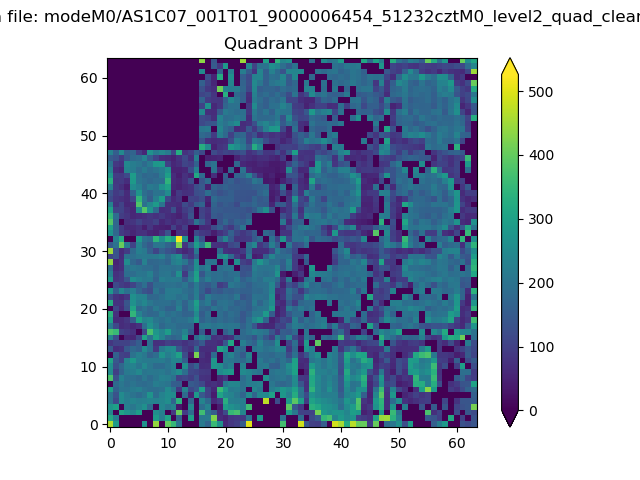 |
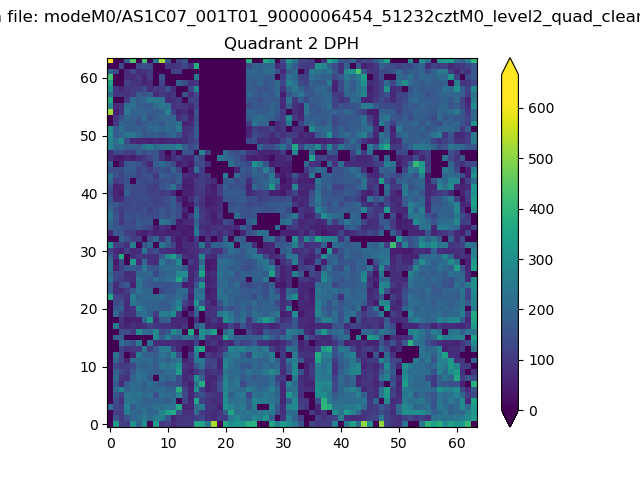 |
Quadrant C |
| Plot type | Count rate plots | Images |
|---|---|---|
| Comparison with Poisson distribution Blue bars denote a histogram of data divided into 1 sec bins. Red curve is a Poisson curve with rate = median count rate of data. |
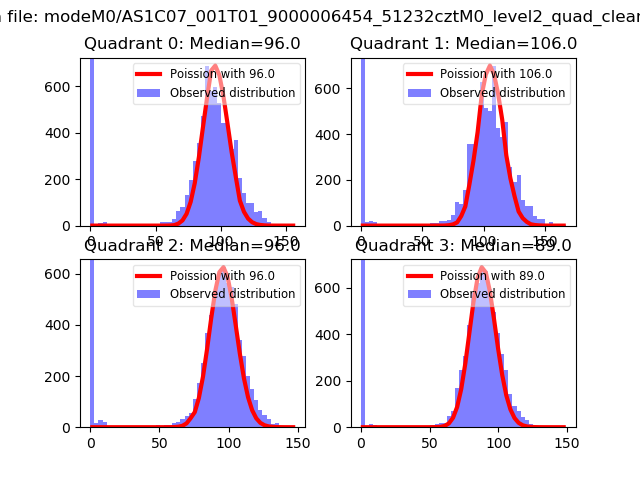 |
 |
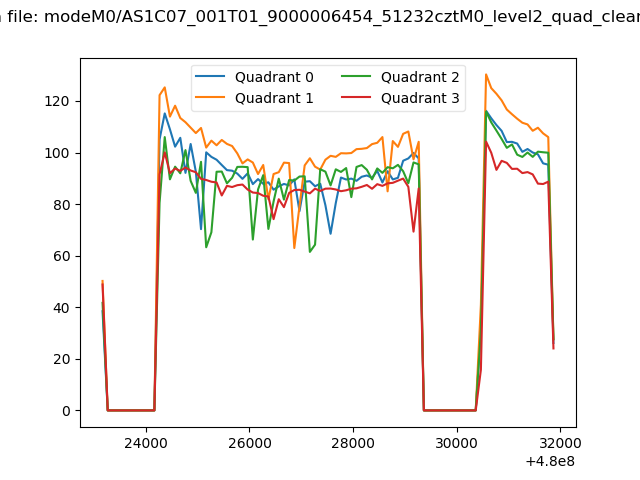
| Quadrant-wise count rates Data is divided into 100 sec bins |
 |
|
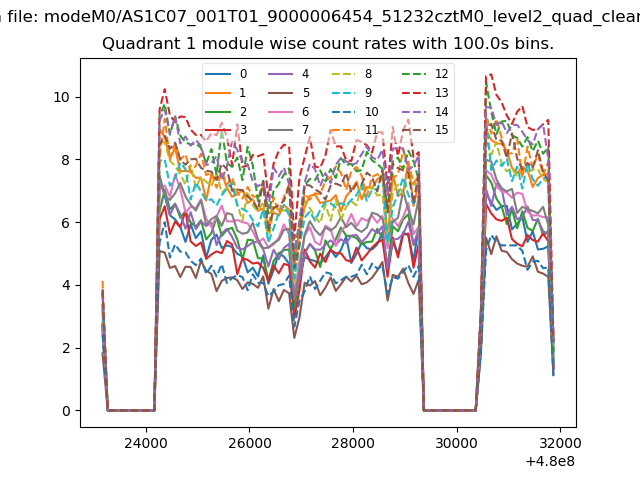
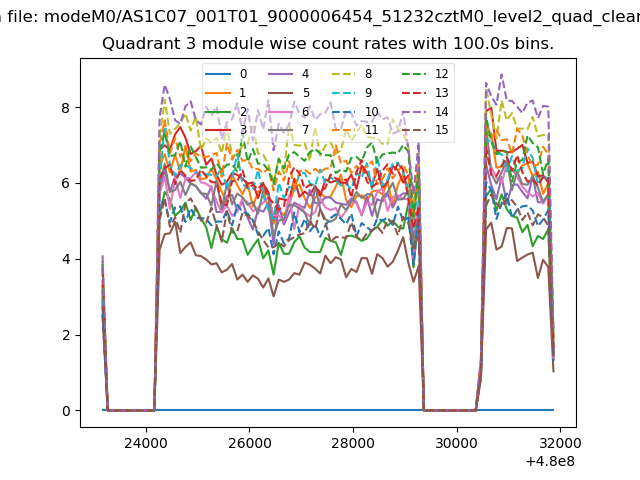
| Module-wise count rates for Quadrant A Data is divided into 100 sec bins |
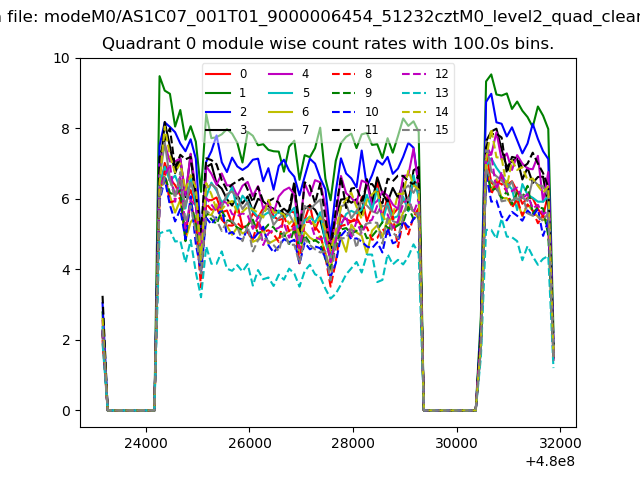 |
 |
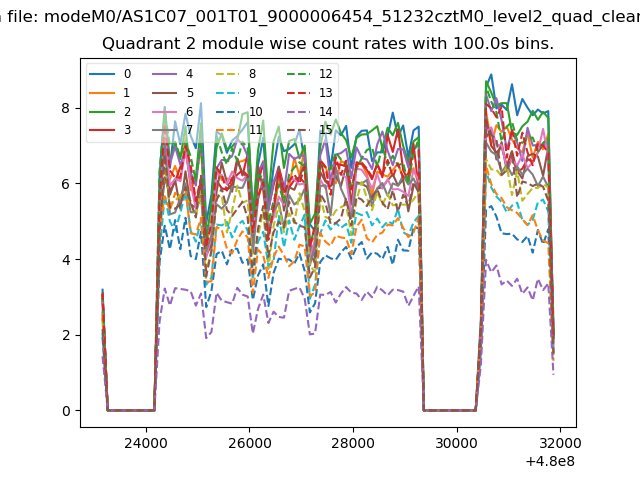
| Module-wise count rates for Quadrant B Data is divided into 100 sec bins |
 |
 |
| Module-wise count rates for Quadrant C Data is divided into 100 sec bins |
 |
 |
| Module-wise count rates for Quadrant D Data is divided into 100 sec bins |
 |
 |
| Parameter | Plot |
|---|---|
| CZT HV Monitor | 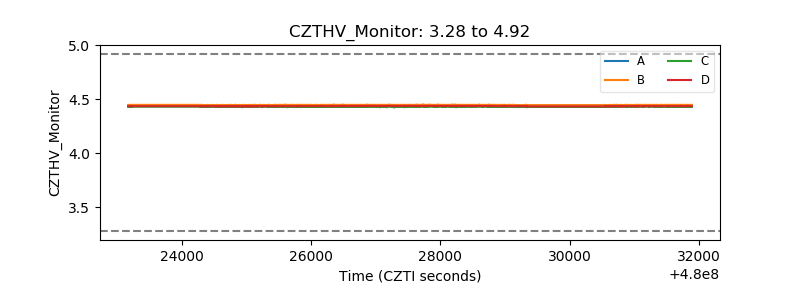 |
| D_VDD | 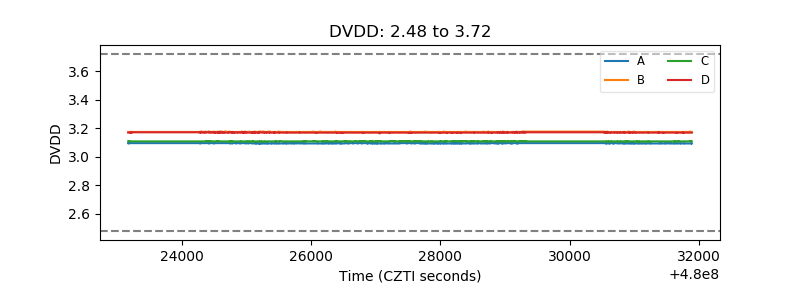 |
| Temperature 1 | 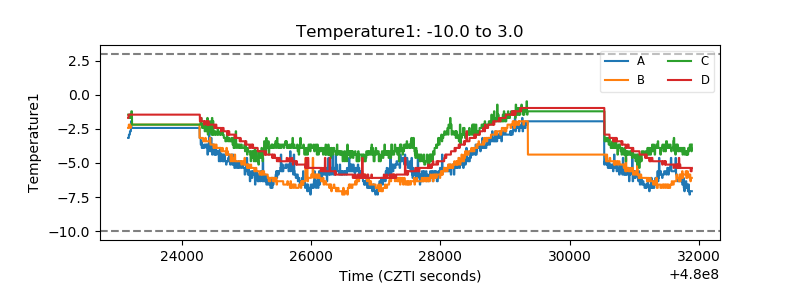 |
| Veto HV Monitor | 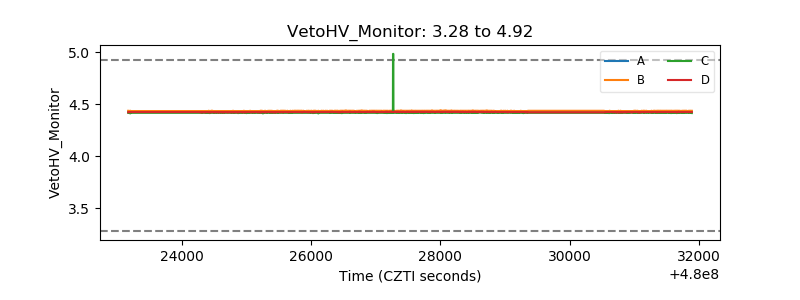 |
| Veto LLD | 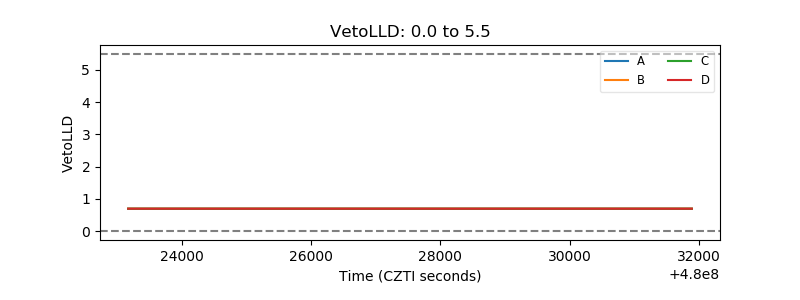 |
| Alpha Counter | 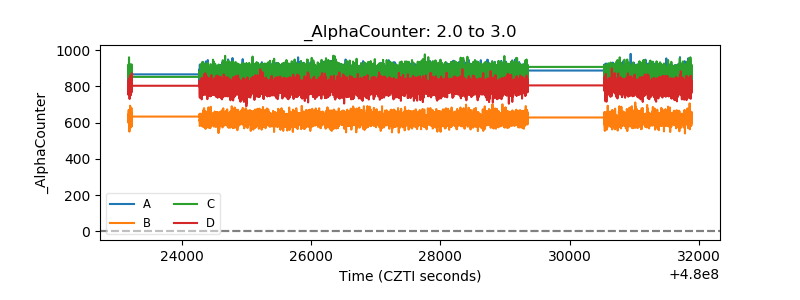 |
| _CPM_Rate | 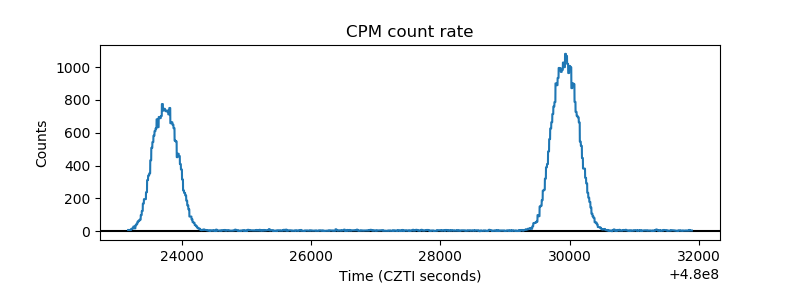 |
| CZT Counter | 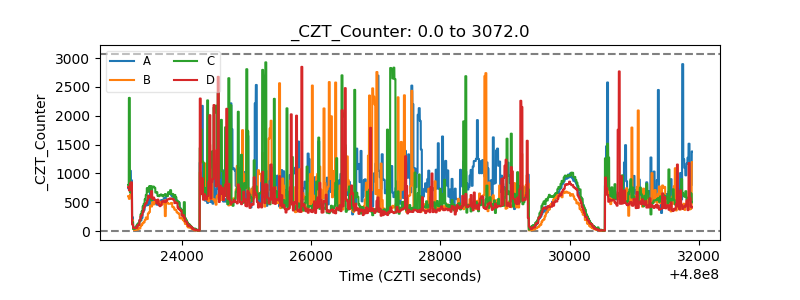 |
| +2.5 Volts monitor | 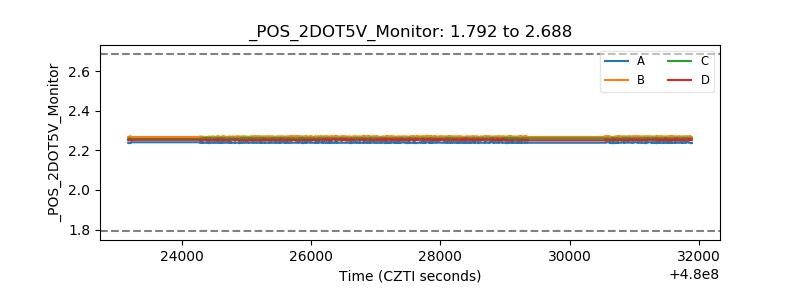 |
| +5 Volts monitor | 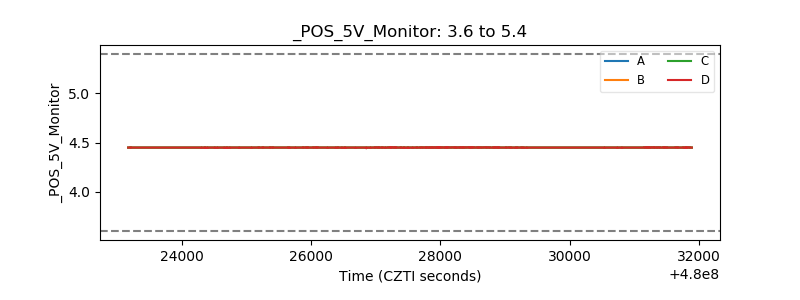 |
| _ROLL_ROT | 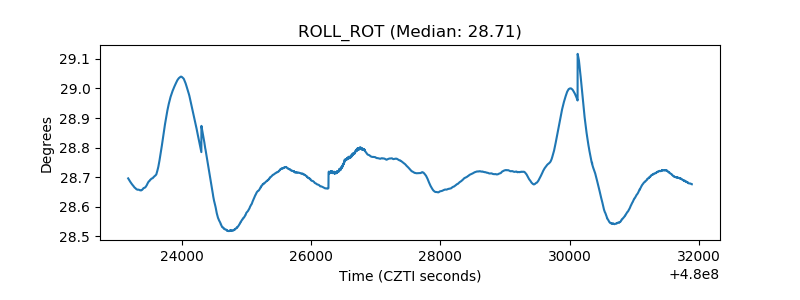 |
| _Roll_DEC | 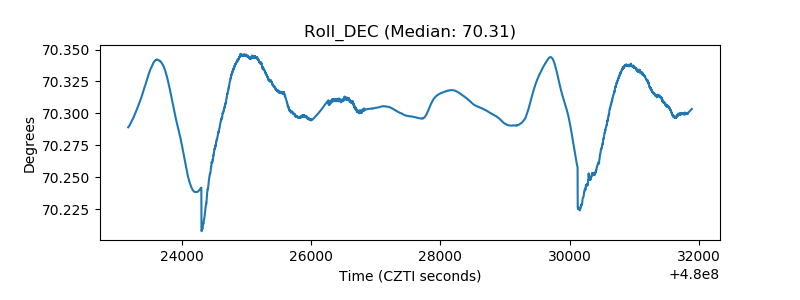 |
| _Roll_RA | 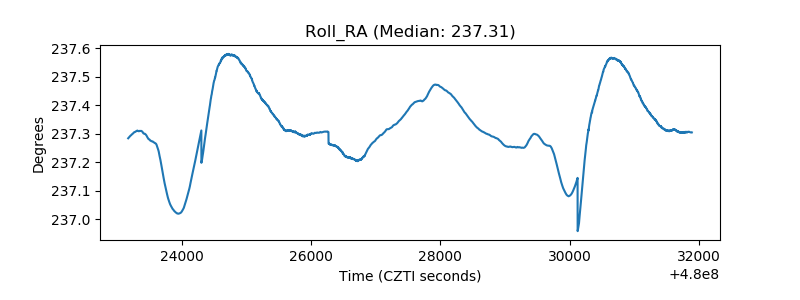 |
| Veto Counter | 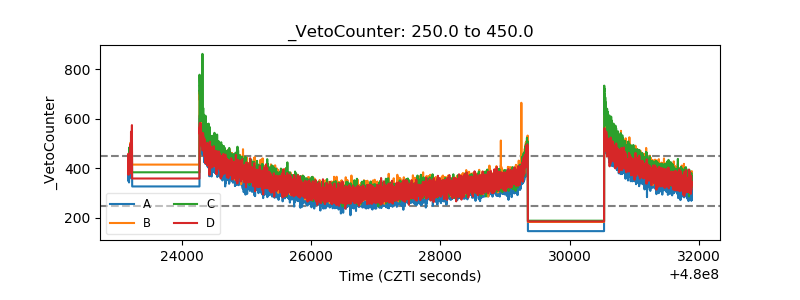 |