| Param | Original file | Final file |
|---|---|---|
| Filename | modeM0/AS1C07_001T01_9000006454_51233cztM0_level2.fits | modeM0/AS1C07_001T01_9000006454_51233cztM0_level2_quad_clean.evt |
| Size (bytes) | 531,342,720 | 101,171,520 |
| Size | 506.7 MB | 96.5 MB |
| Events in quadrant A | 5,419,906 | 645,301 |
| Events in quadrant B | 4,681,302 | 711,503 |
| Events in quadrant C | 5,325,467 | 635,677 |
| Events in quadrant D | 3,716,460 | 598,659 |
| Mode M0 | |||
|---|---|---|---|
| Quadrant | BADHDUFLAG | Total packets | Discarded packets |
| A | 0 | 20879 | 2 |
| B | 0 | 18593 | 2 |
| C | 0 | 20480 | 2 |
| D | 0 | 16113 | 2 |
| Mode SS | |||
|---|---|---|---|
| Quadrant | BADHDUFLAG | Total packets | Discarded packets |
| A | 0 | 140 | 0 |
| B | 0 | 140 | 0 |
| C | 0 | 140 | 0 |
| D | 0 | 140 | 0 |
| Mode M9 | |||
|---|---|---|---|
| Quadrant | BADHDUFLAG | Total packets | Discarded packets |
| A | 0 | 23 | 0 |
| B | 0 | 23 | 0 |
| C | 0 | 23 | 0 |
| D | 0 | 23 | 0 |
| Quadrant | Total seconds | Saturated seconds | Saturation percentage |
|---|---|---|---|
| A | 6776 | 261 | 3.851830% |
| B | 6776 | 346 | 5.106257% |
| C | 6776 | 392 | 5.785124% |
| D | 6776 | 171 | 2.523613% |
Noise dominated data is calculated using 1-second bins in cleaned event files. If a bin has >2000 counts, and if more than 50% of those come from <1% of pixels, then it is considered to be noise-dominated and hence unusable.
| Quadrant | # 1 sec bins | Bins with >0 counts | Bins with >2000 counts | High rate bins dominated by noise | Noise dominated (total time) | Noise dominated (detector-on time) | Marked lightcurve |
|---|---|---|---|---|---|---|---|
| A | 9131 | 6777 | 108 | 108 | 1.18% | 1.59% | 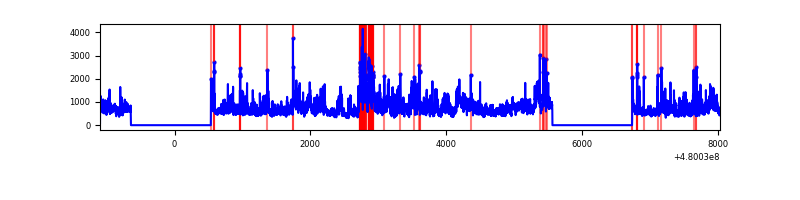 |
| B | 9131 | 6777 | 131 | 131 | 1.43% | 1.93% | 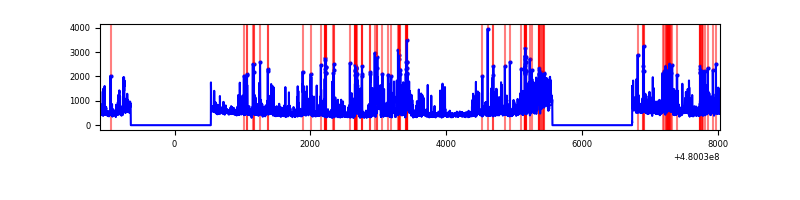 |
| C | 9131 | 6777 | 352 | 352 | 3.85% | 5.19% | 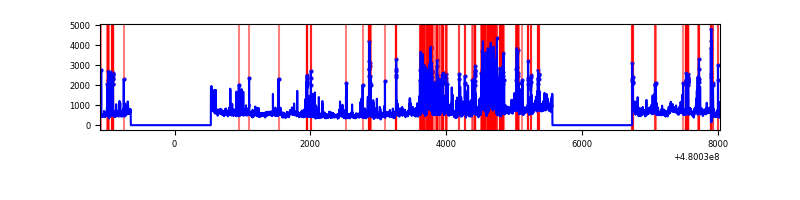 |
| D | 9131 | 6777 | 133 | 133 | 1.46% | 1.96% | 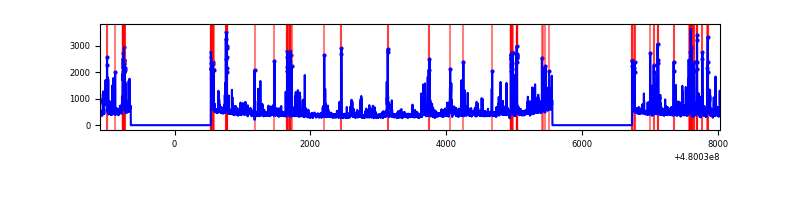 |
Top three noisy pixels from each quadrant. If the there are fewer than three noisy pixels in the level2.evt file, extra rows are filled as -1
| Pixel properties | Quadrant properties | ||||||
|---|---|---|---|---|---|---|---|
| Quadrant | DetID | PixID | Counts | Sigma | Mean | Median | Sigma |
| A | 12 | 3 | 1079115 | 6067.74 | 714 | 696 | 177.7 |
| A | 9 | 160 | 732401 | 4116.95 | 714 | 696 | 177.7 |
| A | 8 | 26 | 295196 | 1657.01 | 714 | 696 | 177.7 |
| B | 5 | 185 | 531006 | 3506.64 | 716 | 691 | 151.2 |
| B | 4 | 171 | 288705 | 1904.46 | 716 | 691 | 151.2 |
| B | 8 | 128 | 226725 | 1494.62 | 716 | 691 | 151.2 |
| C | 4 | 12 | 900980 | 4645.8 | 701 | 695 | 193.8 |
| C | 12 | 247 | 772304 | 3981.79 | 701 | 695 | 193.8 |
| C | 0 | 145 | 251006 | 1291.7 | 701 | 695 | 193.8 |
| D | 10 | 172 | 189805 | 965.25 | 695 | 671 | 195.9 |
| D | 2 | 207 | 178987 | 910.04 | 695 | 671 | 195.9 |
| D | 10 | 181 | 172853 | 878.73 | 695 | 671 | 195.9 |
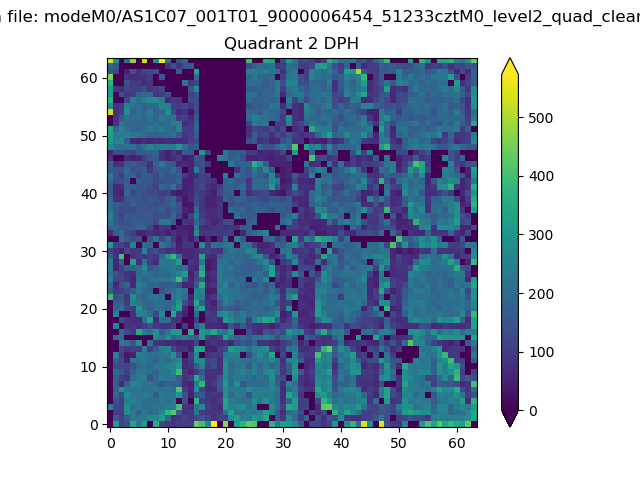
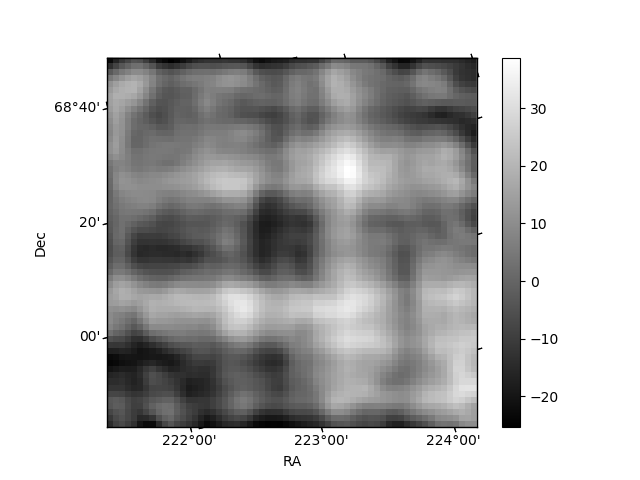
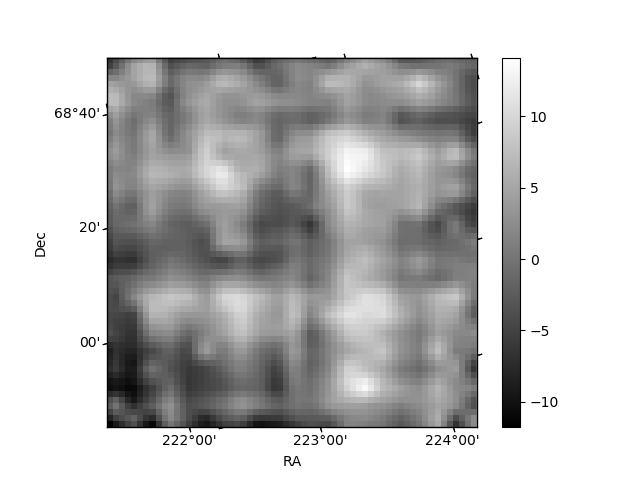
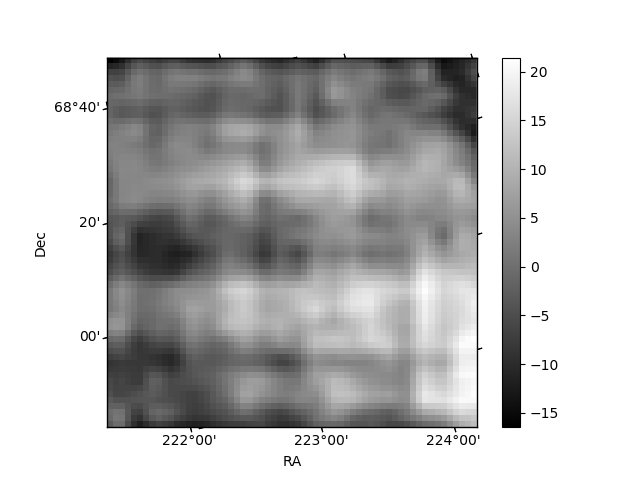
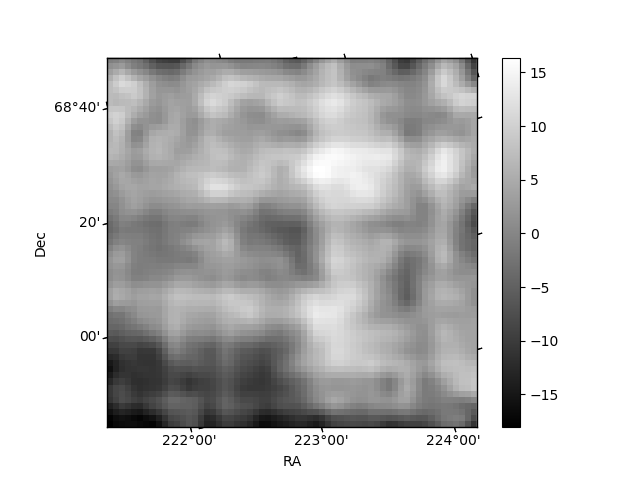
Histogram calculated using DETX and DETY for each event in the final _common_clean file
| Quadrant A | 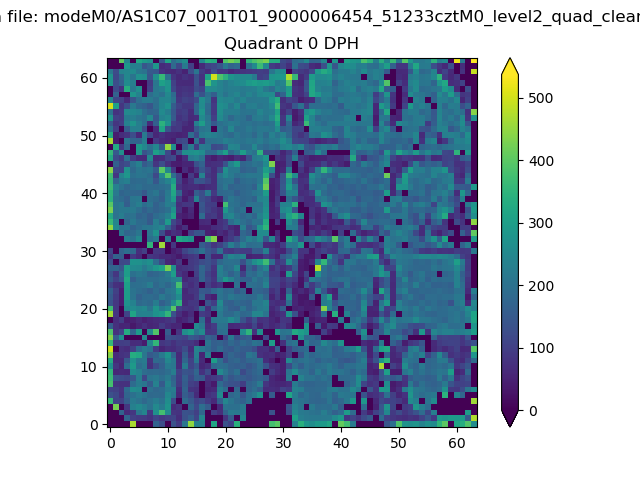 |
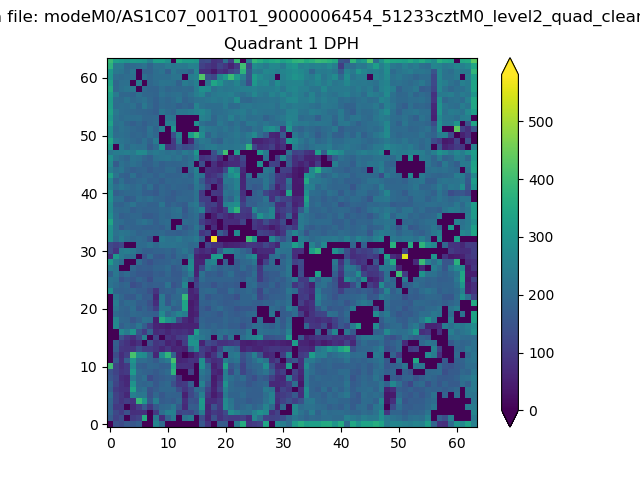 |
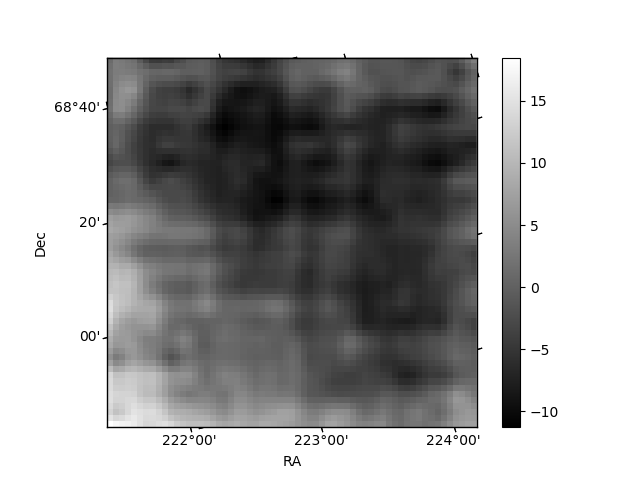
Quadrant B |
|---|---|---|---|
| Quadrant D | 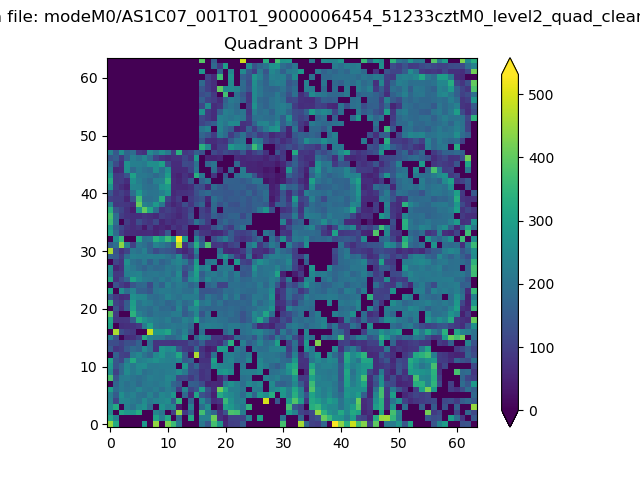 |
 |
Quadrant C |
| Plot type | Count rate plots | Images |
|---|---|---|
| Comparison with Poisson distribution Blue bars denote a histogram of data divided into 1 sec bins. Red curve is a Poisson curve with rate = median count rate of data. |
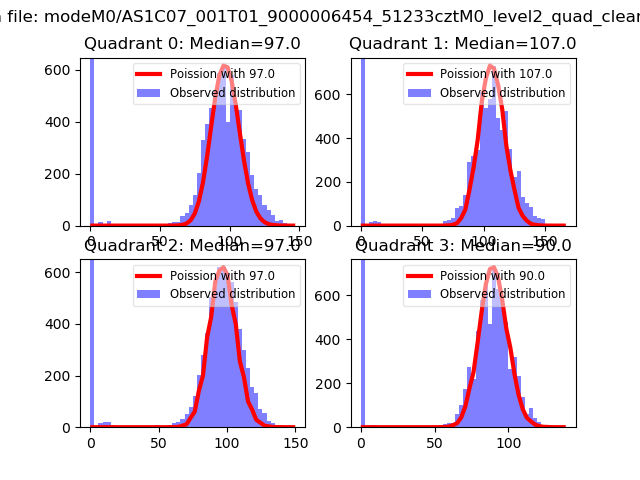 |
 |
| Quadrant-wise count rates Data is divided into 100 sec bins |
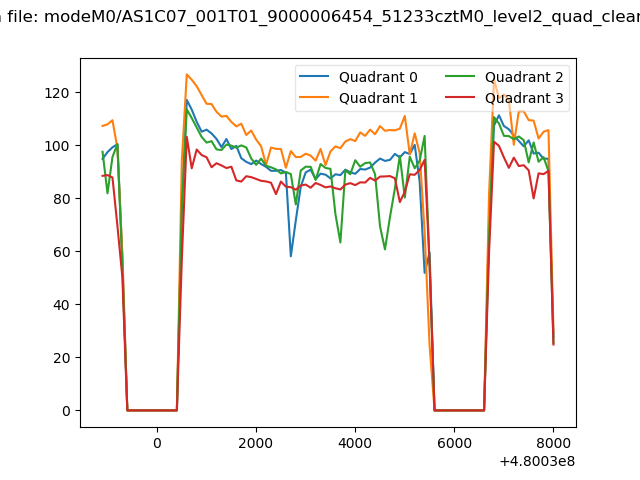 |
|
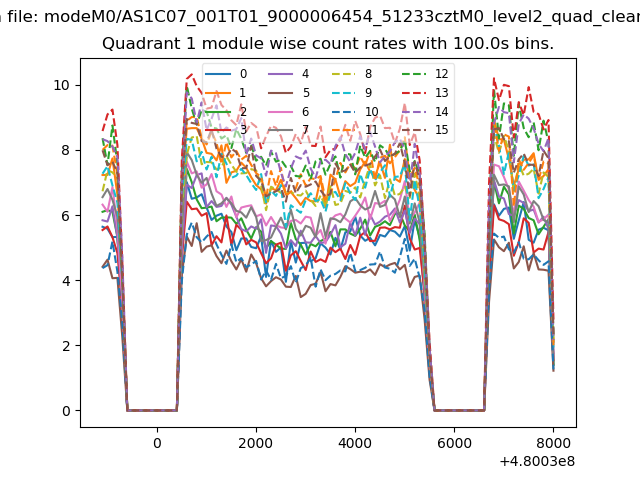
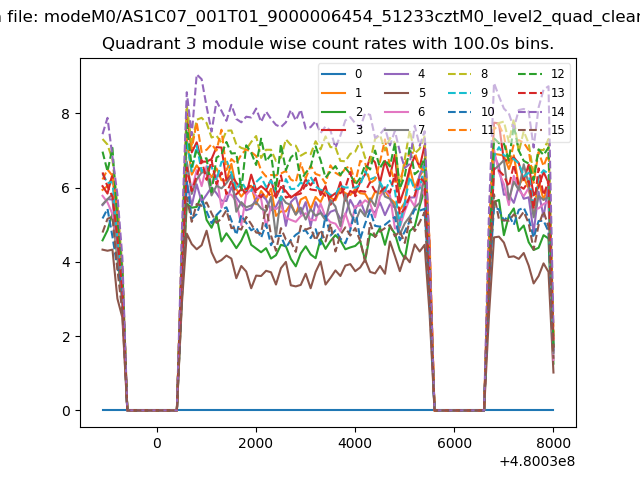
| Module-wise count rates for Quadrant A Data is divided into 100 sec bins |
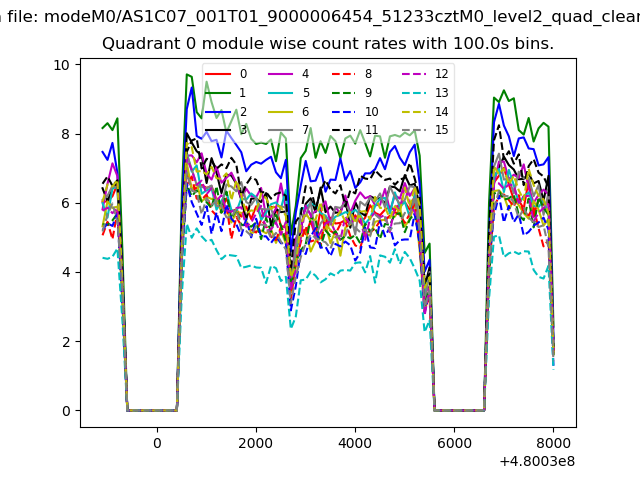 |
 |
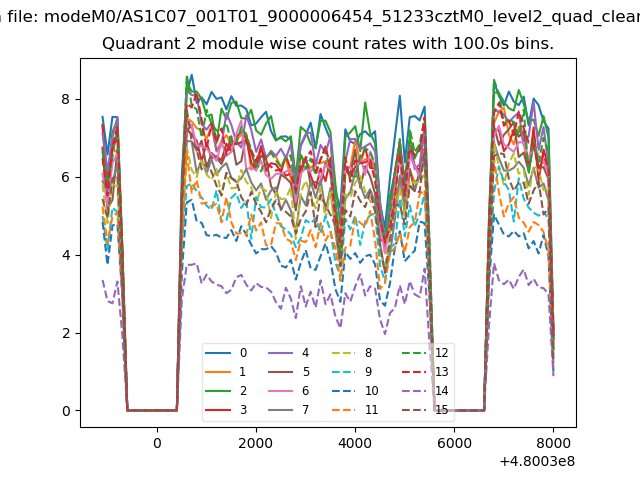
| Module-wise count rates for Quadrant B Data is divided into 100 sec bins |
 |
 |
| Module-wise count rates for Quadrant C Data is divided into 100 sec bins |
 |
 |
| Module-wise count rates for Quadrant D Data is divided into 100 sec bins |
 |
 |
| Parameter | Plot |
|---|---|
| CZT HV Monitor | 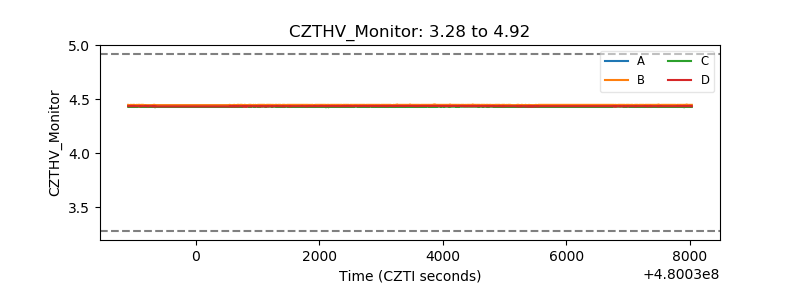 |
| D_VDD | 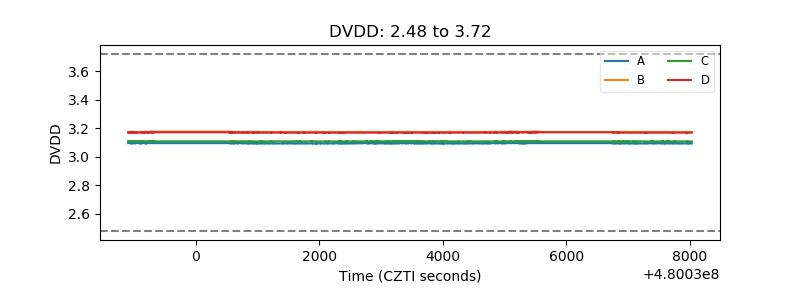 |
| Temperature 1 | 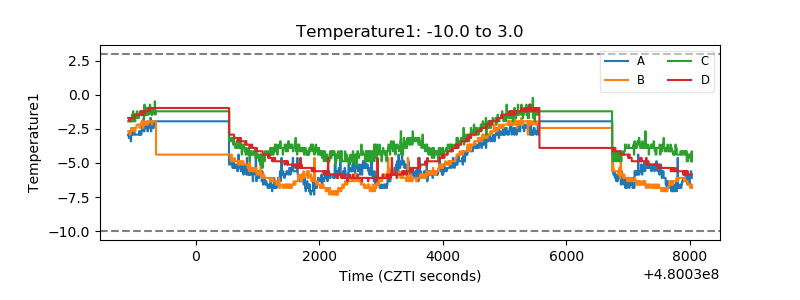 |
| Veto HV Monitor | 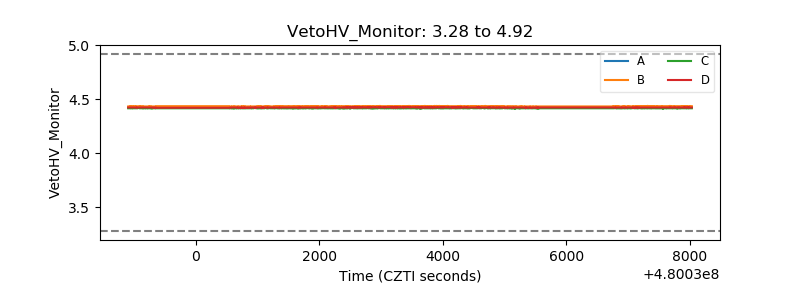 |
| Veto LLD | 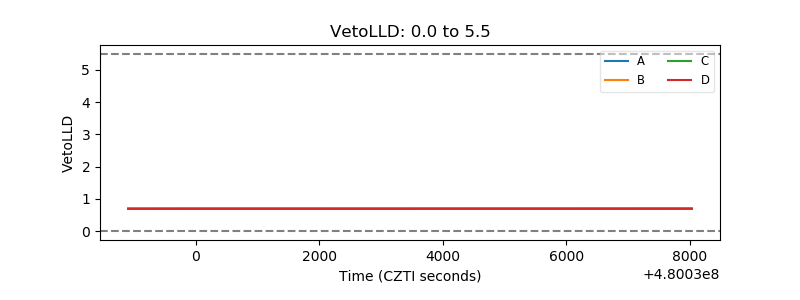 |
| Alpha Counter | 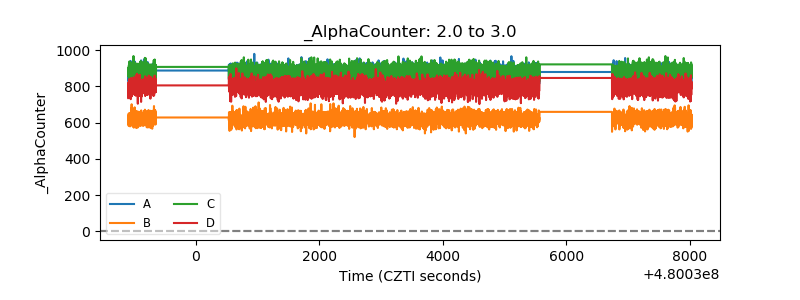 |
| _CPM_Rate | 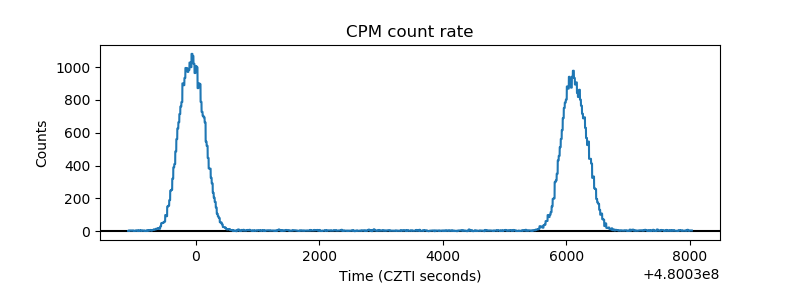 |
| CZT Counter | 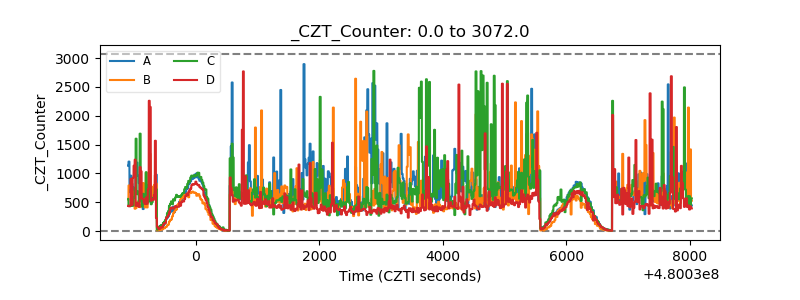 |
| +2.5 Volts monitor | 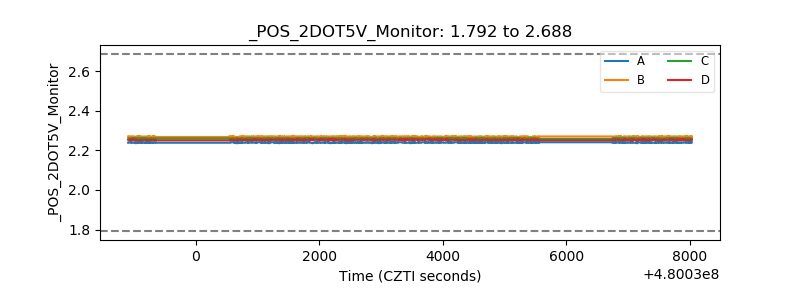 |
| +5 Volts monitor |  |
| _ROLL_ROT | 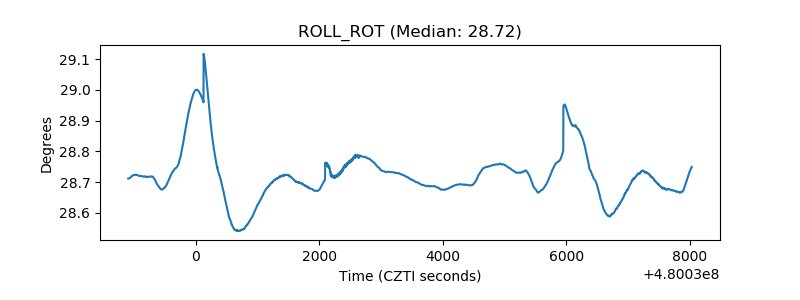 |
| _Roll_DEC | 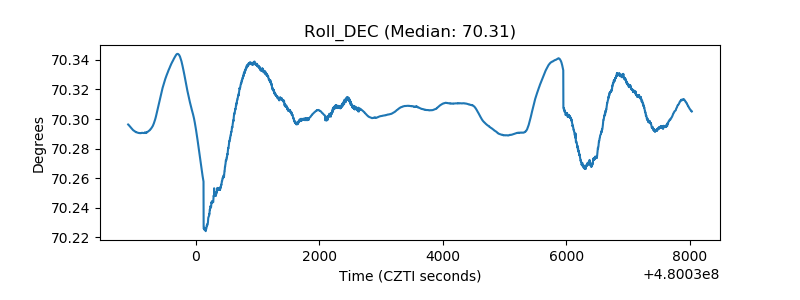 |
| _Roll_RA | 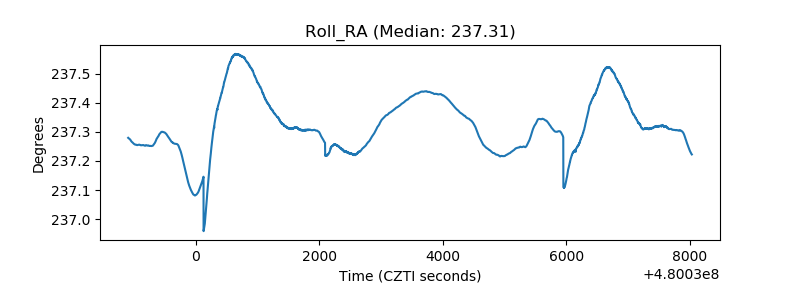 |
| Veto Counter | 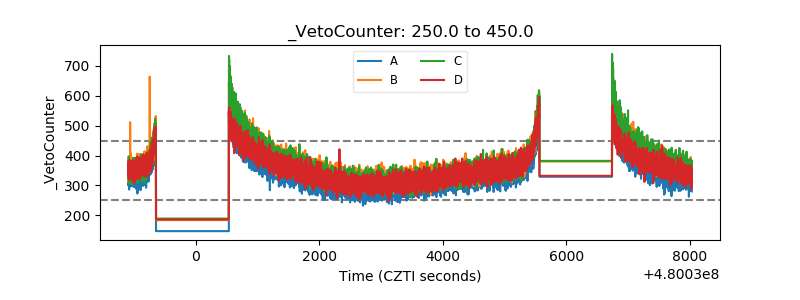 |