| Param | Original file | Final file |
|---|---|---|
| Filename | modeM0/AS1C07_001T01_9000006454_51234cztM0_level2.fits | modeM0/AS1C07_001T01_9000006454_51234cztM0_level2_quad_clean.evt |
| Size (bytes) | 568,146,240 | 99,020,160 |
| Size | 541.8 MB | 94.4 MB |
| Events in quadrant A | 5,443,130 | 635,425 |
| Events in quadrant B | 6,302,554 | 675,588 |
| Events in quadrant C | 4,782,296 | 629,224 |
| Events in quadrant D | 3,978,734 | 586,322 |
| Mode M0 | |||
|---|---|---|---|
| Quadrant | BADHDUFLAG | Total packets | Discarded packets |
| A | 0 | 21000 | 2 |
| B | 0 | 23431 | 5 |
| C | 0 | 18951 | 2 |
| D | 0 | 16901 | 2 |
| Mode SS | |||
|---|---|---|---|
| Quadrant | BADHDUFLAG | Total packets | Discarded packets |
| A | 0 | 138 | 0 |
| B | 0 | 138 | 0 |
| C | 0 | 138 | 0 |
| D | 0 | 138 | 0 |
| Mode M9 | |||
|---|---|---|---|
| Quadrant | BADHDUFLAG | Total packets | Discarded packets |
| A | 0 | 20 | 0 |
| B | 0 | 21 | 0 |
| C | 0 | 21 | 0 |
| D | 0 | 21 | 0 |
| Quadrant | Total seconds | Saturated seconds | Saturation percentage |
|---|---|---|---|
| A | 6766 | 234 | 3.458469% |
| B | 6765 | 646 | 9.549150% |
| C | 6765 | 328 | 4.848485% |
| D | 6765 | 217 | 3.207687% |
Noise dominated data is calculated using 1-second bins in cleaned event files. If a bin has >2000 counts, and if more than 50% of those come from <1% of pixels, then it is considered to be noise-dominated and hence unusable.
| Quadrant | # 1 sec bins | Bins with >0 counts | Bins with >2000 counts | High rate bins dominated by noise | Noise dominated (total time) | Noise dominated (detector-on time) | Marked lightcurve |
|---|---|---|---|---|---|---|---|
| A | 7901 | 6767 | 140 | 140 | 1.77% | 2.07% | 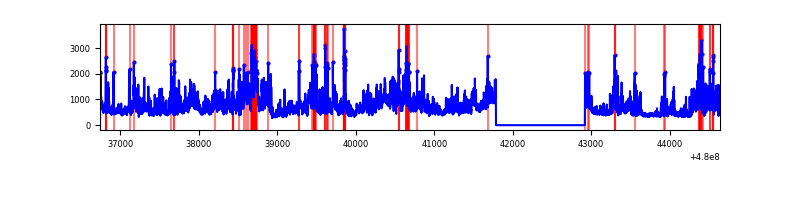 |
| B | 7899 | 6765 | 431 | 431 | 5.46% | 6.37% | 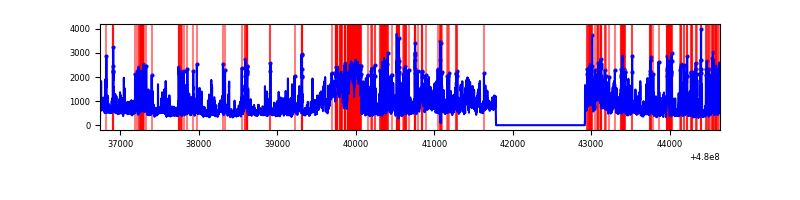 |
| C | 7900 | 6766 | 259 | 259 | 3.28% | 3.83% | 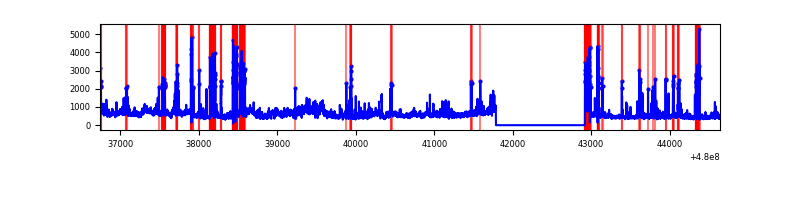 |
| D | 7900 | 6766 | 188 | 188 | 2.38% | 2.78% | 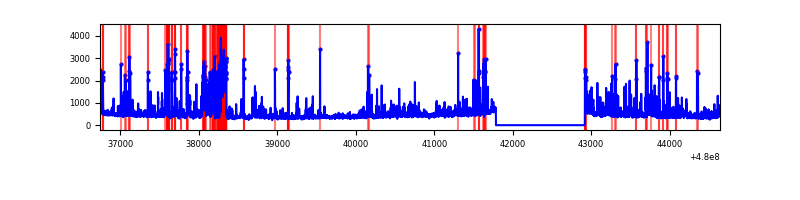 |
Top three noisy pixels from each quadrant. If the there are fewer than three noisy pixels in the level2.evt file, extra rows are filled as -1
| Pixel properties | Quadrant properties | ||||||
|---|---|---|---|---|---|---|---|
| Quadrant | DetID | PixID | Counts | Sigma | Mean | Median | Sigma |
| A | 12 | 3 | 1278002 | 7393.45 | 694 | 678 | 172.8 |
| A | 9 | 160 | 508655 | 2940.29 | 694 | 678 | 172.8 |
| A | 8 | 26 | 258995 | 1495.2 | 694 | 678 | 172.8 |
| B | 5 | 185 | 1479116 | 10111.77 | 689 | 665 | 146.2 |
| B | 10 | 254 | 1134496 | 7754.77 | 689 | 665 | 146.2 |
| B | 8 | 128 | 172031 | 1172.05 | 689 | 665 | 146.2 |
| C | 12 | 247 | 826583 | 4377.83 | 678 | 671 | 188.7 |
| C | 4 | 12 | 723455 | 3831.19 | 678 | 671 | 188.7 |
| C | 0 | 145 | 100097 | 527.02 | 678 | 671 | 188.7 |
| D | 2 | 216 | 489240 | 2583.71 | 667 | 644 | 189.1 |
| D | 2 | 207 | 171304 | 902.45 | 667 | 644 | 189.1 |
| D | 10 | 172 | 169153 | 891.08 | 667 | 644 | 189.1 |
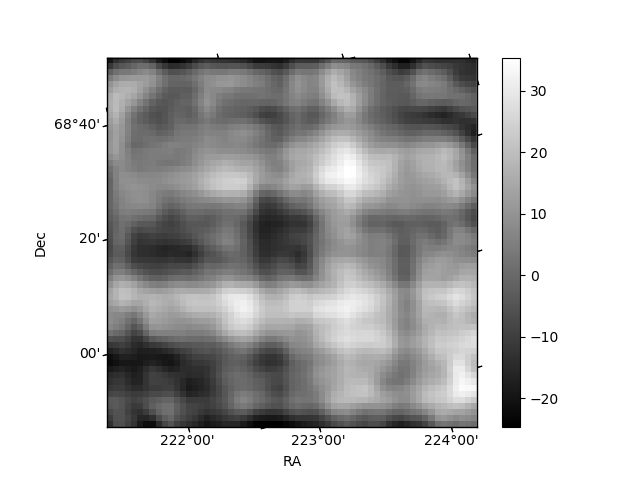
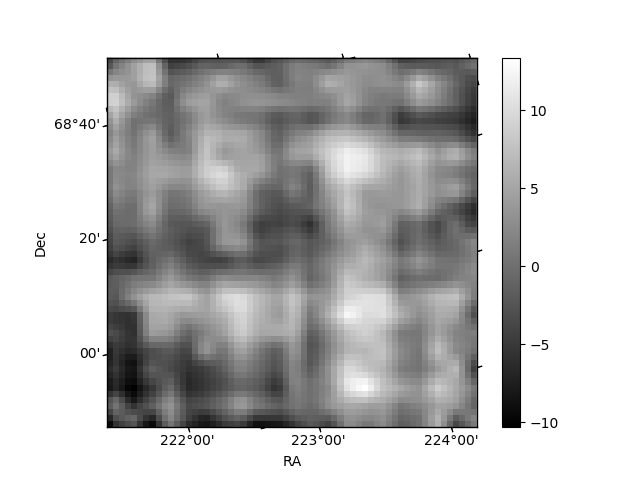
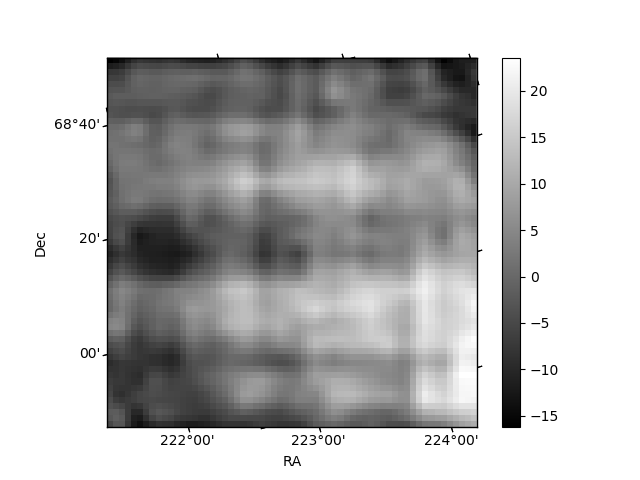
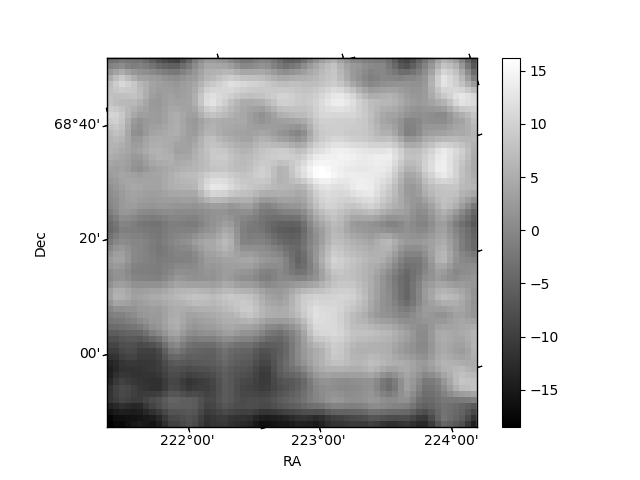
Histogram calculated using DETX and DETY for each event in the final _common_clean file
| Quadrant A | 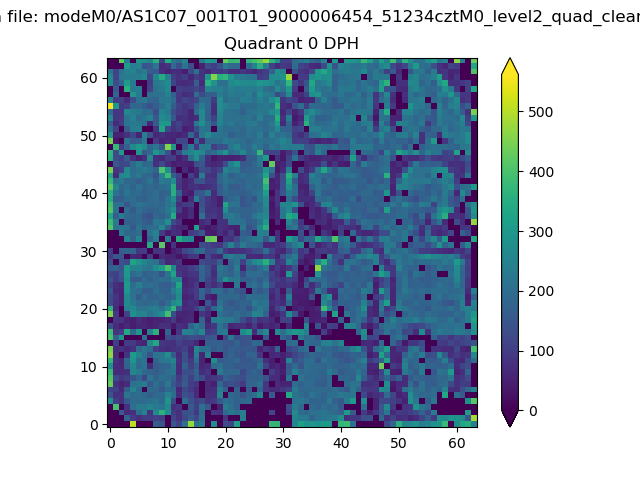 |
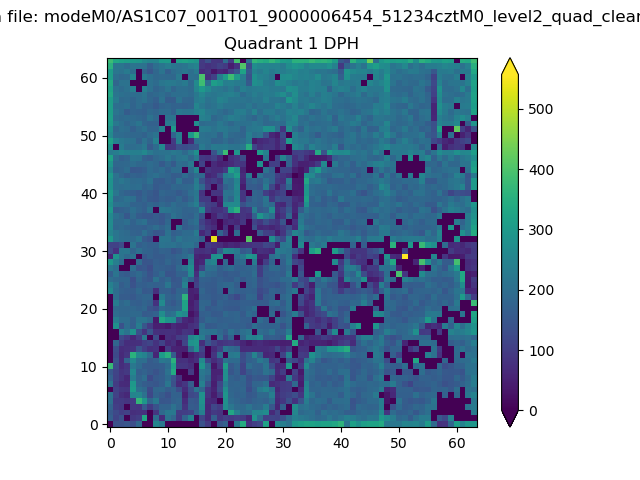 |
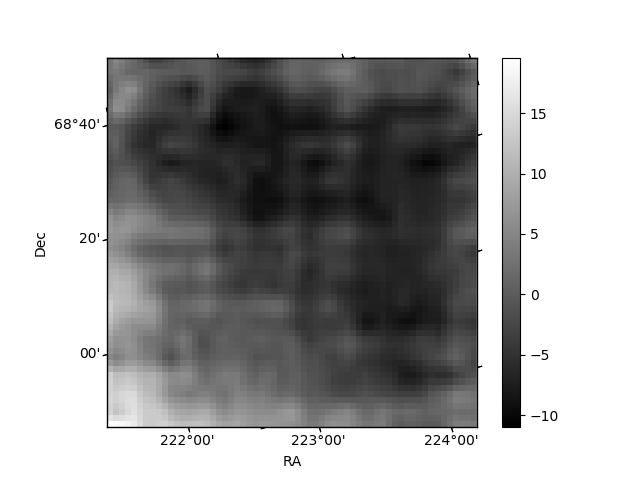
Quadrant B |
|---|---|---|---|
| Quadrant D | 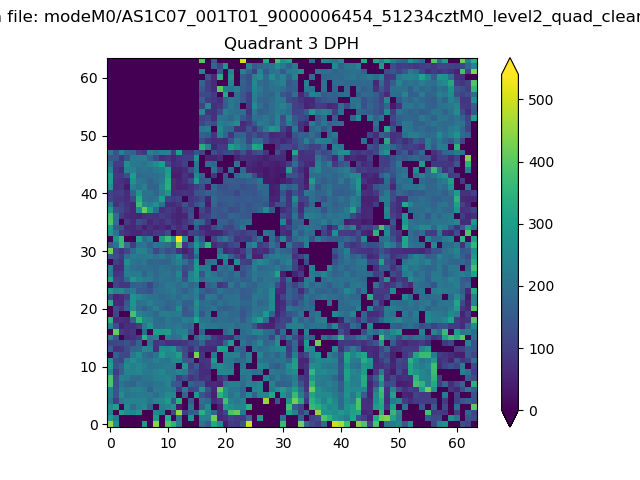 |
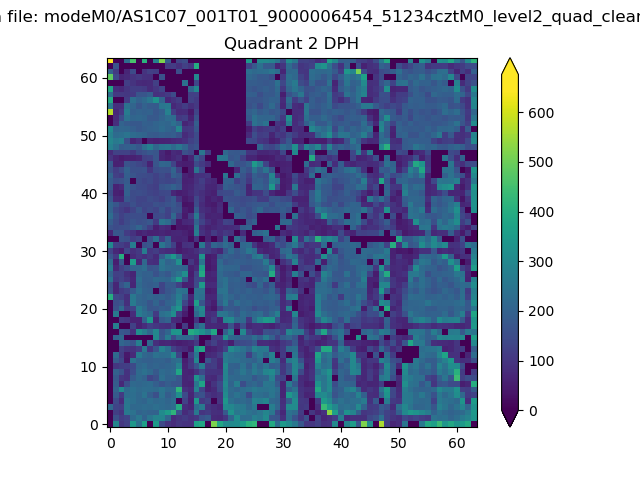 |
Quadrant C |
| Plot type | Count rate plots | Images |
|---|---|---|
| Comparison with Poisson distribution Blue bars denote a histogram of data divided into 1 sec bins. Red curve is a Poisson curve with rate = median count rate of data. |
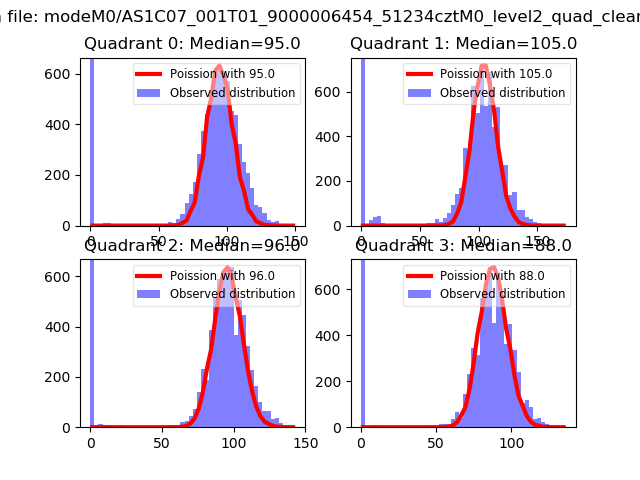 |
 |
| Quadrant-wise count rates Data is divided into 100 sec bins |
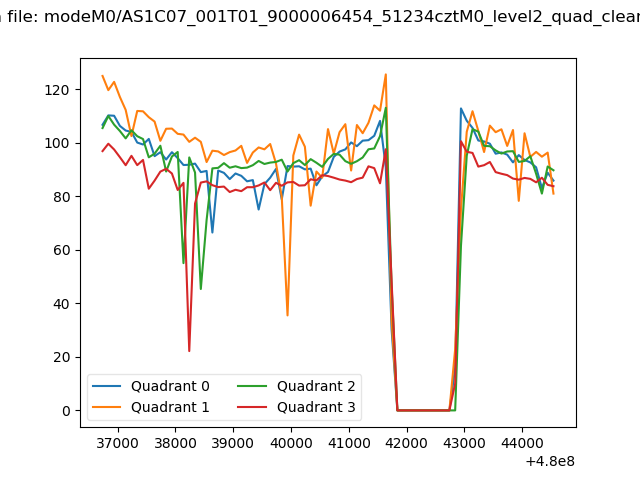 |
|
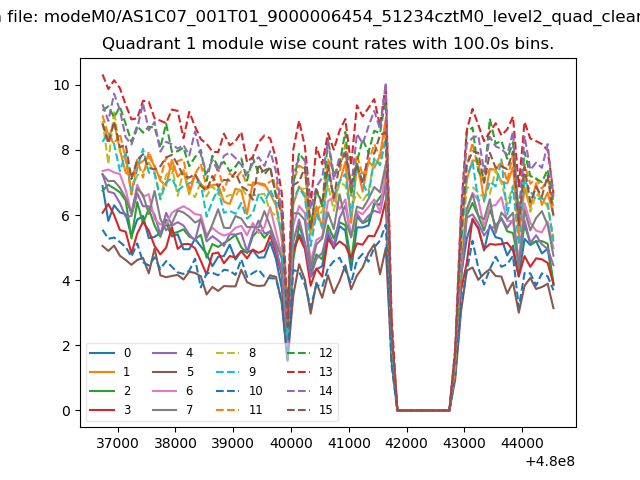
| Module-wise count rates for Quadrant A Data is divided into 100 sec bins |
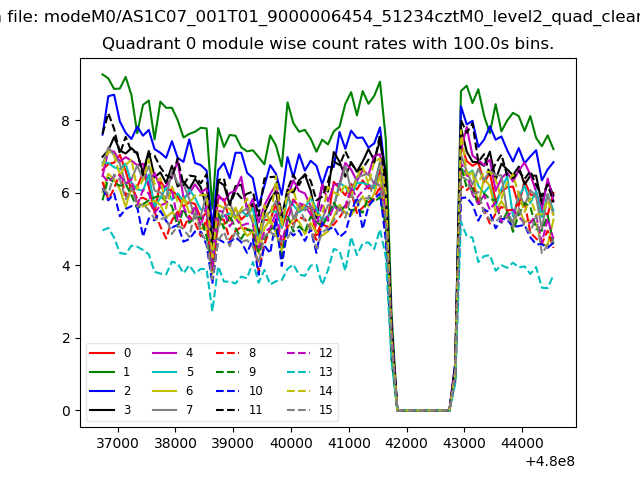 |
 |
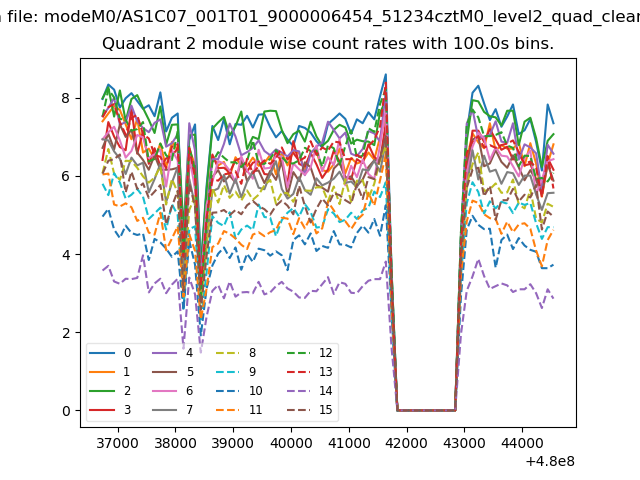
| Module-wise count rates for Quadrant B Data is divided into 100 sec bins |
 |
 |
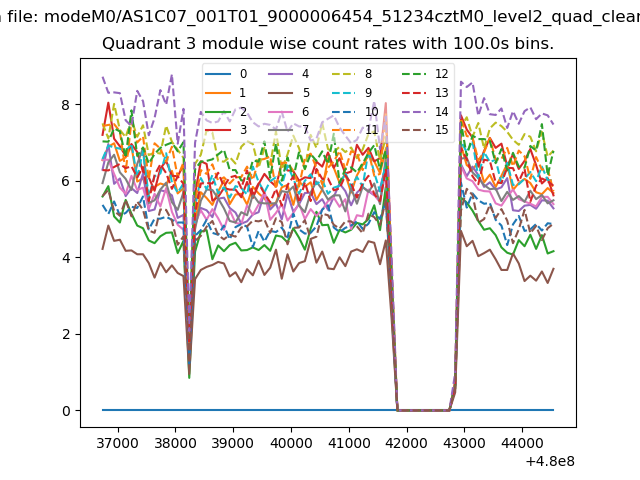
| Module-wise count rates for Quadrant C Data is divided into 100 sec bins |
 |
 |
| Module-wise count rates for Quadrant D Data is divided into 100 sec bins |
 |
 |
| Parameter | Plot |
|---|---|
| CZT HV Monitor | 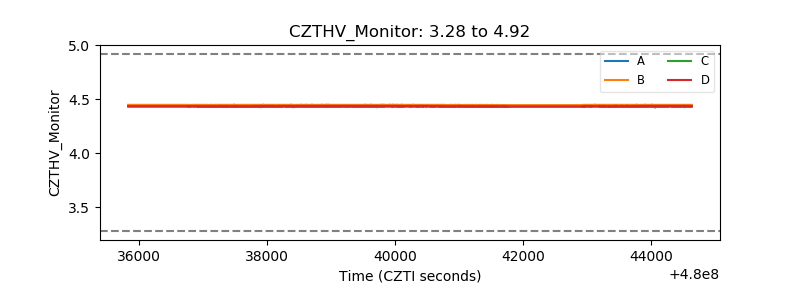 |
| D_VDD | 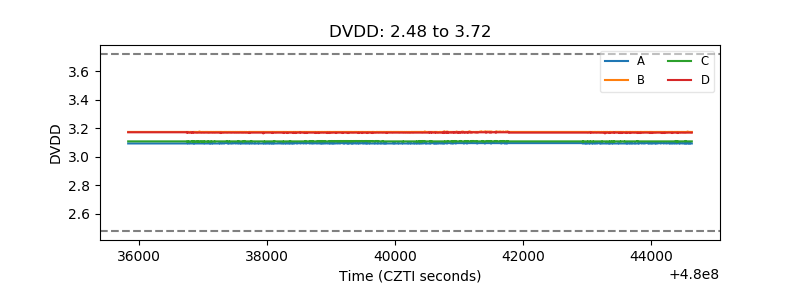 |
| Temperature 1 | 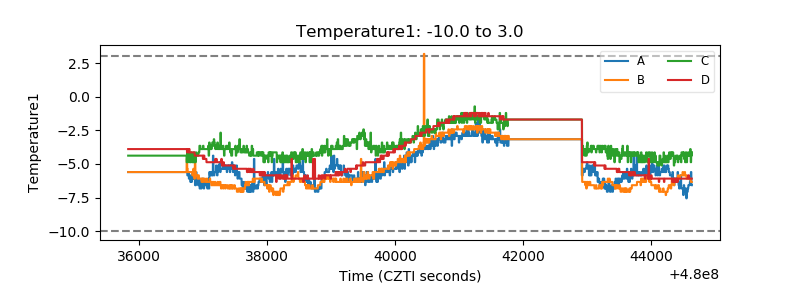 |
| Veto HV Monitor | 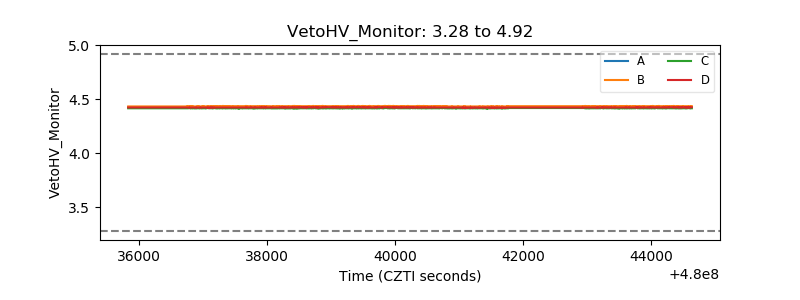 |
| Veto LLD | 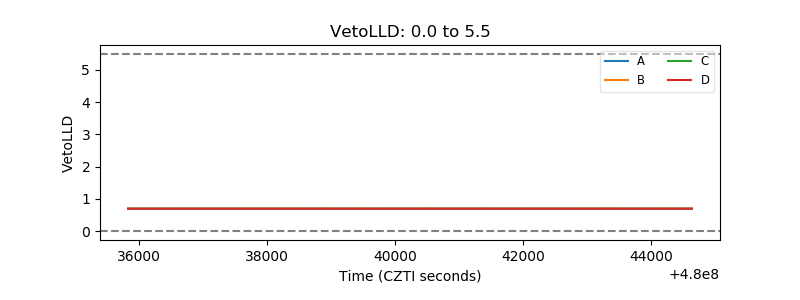 |
| Alpha Counter | 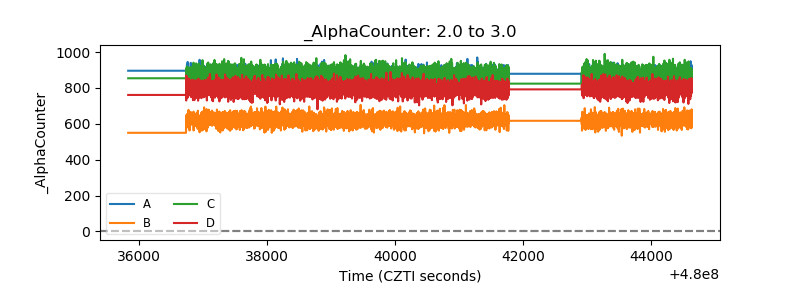 |
| _CPM_Rate | 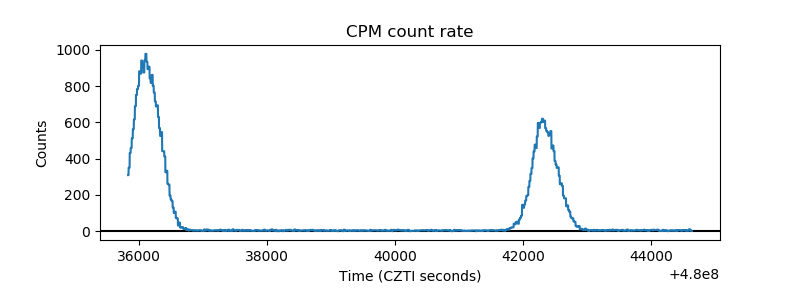 |
| CZT Counter | 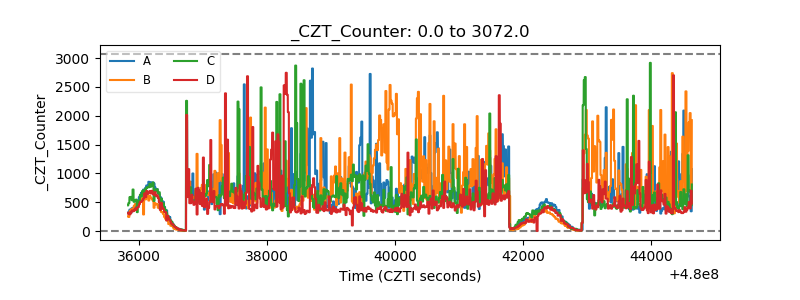 |
| +2.5 Volts monitor | 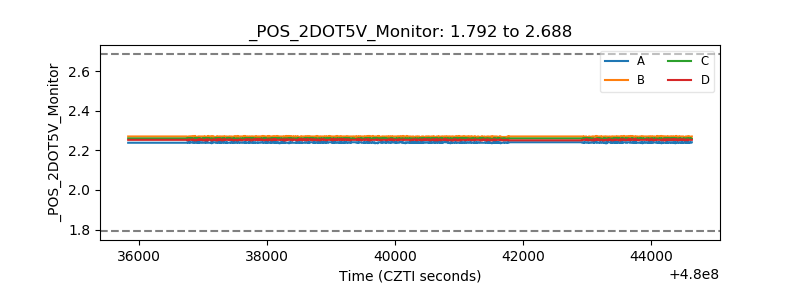 |
| +5 Volts monitor | 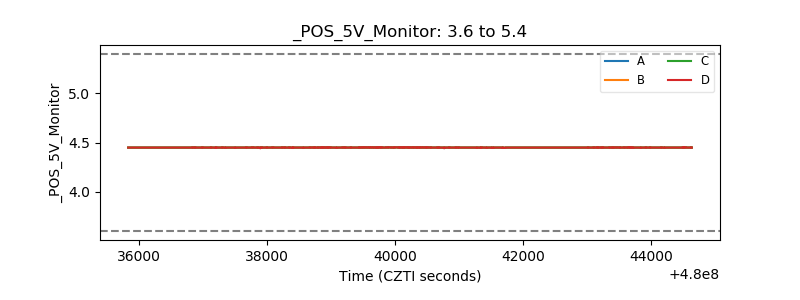 |
| _ROLL_ROT | 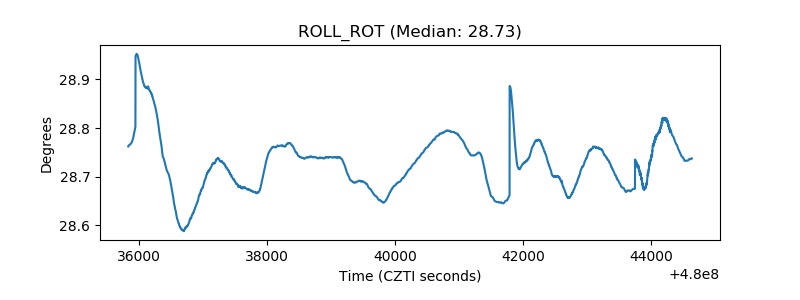 |
| _Roll_DEC | 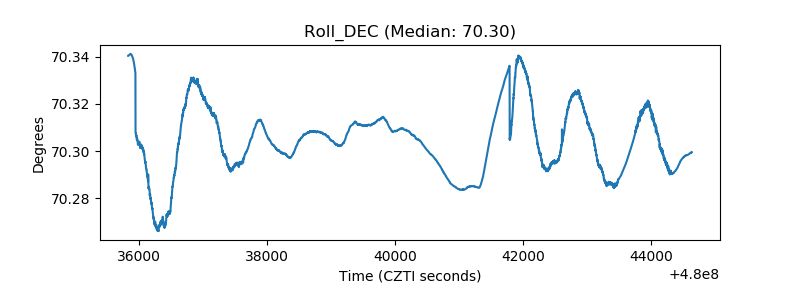 |
| _Roll_RA | 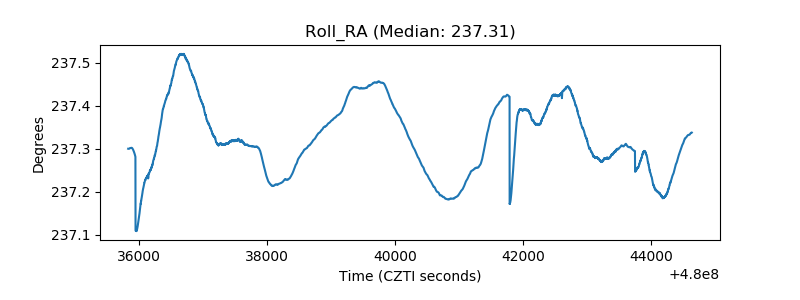 |
| Veto Counter | 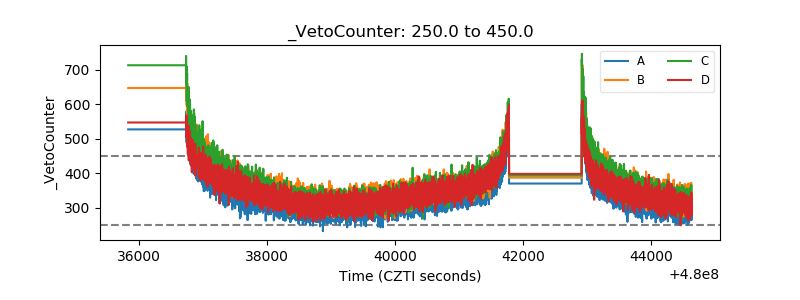 |