| Param | Original file | Final file |
|---|---|---|
| Filename | modeM0/AS1C07_001T01_9000006454_51235cztM0_level2.fits | modeM0/AS1C07_001T01_9000006454_51235cztM0_level2_quad_clean.evt |
| Size (bytes) | 560,050,560 | 97,211,520 |
| Size | 534.1 MB | 92.7 MB |
| Events in quadrant A | 5,025,352 | 636,584 |
| Events in quadrant B | 7,126,497 | 609,668 |
| Events in quadrant C | 4,151,980 | 631,016 |
| Events in quadrant D | 3,894,261 | 587,591 |
| Mode M0 | |||
|---|---|---|---|
| Quadrant | BADHDUFLAG | Total packets | Discarded packets |
| A | 0 | 19848 | 2 |
| B | 0 | 25957 | 2 |
| C | 0 | 17156 | 2 |
| D | 0 | 16843 | 2 |
| Mode SS | |||
|---|---|---|---|
| Quadrant | BADHDUFLAG | Total packets | Discarded packets |
| A | 0 | 140 | 0 |
| B | 0 | 140 | 0 |
| C | 0 | 140 | 0 |
| D | 0 | 140 | 0 |
| Mode M9 | |||
|---|---|---|---|
| Quadrant | BADHDUFLAG | Total packets | Discarded packets |
| A | 0 | 14 | 0 |
| B | 0 | 15 | 0 |
| C | 0 | 15 | 0 |
| D | 0 | 15 | 0 |
| Quadrant | Total seconds | Saturated seconds | Saturation percentage |
|---|---|---|---|
| A | 6876 | 197 | 2.865038% |
| B | 6876 | 1192 | 17.335660% |
| C | 6876 | 242 | 3.519488% |
| D | 6876 | 168 | 2.443281% |
Noise dominated data is calculated using 1-second bins in cleaned event files. If a bin has >2000 counts, and if more than 50% of those come from <1% of pixels, then it is considered to be noise-dominated and hence unusable.
| Quadrant | # 1 sec bins | Bins with >0 counts | Bins with >2000 counts | High rate bins dominated by noise | Noise dominated (total time) | Noise dominated (detector-on time) | Marked lightcurve |
|---|---|---|---|---|---|---|---|
| A | 7881 | 6879 | 117 | 117 | 1.48% | 1.70% |  |
| B | 7881 | 6879 | 774 | 774 | 9.82% | 11.25% | 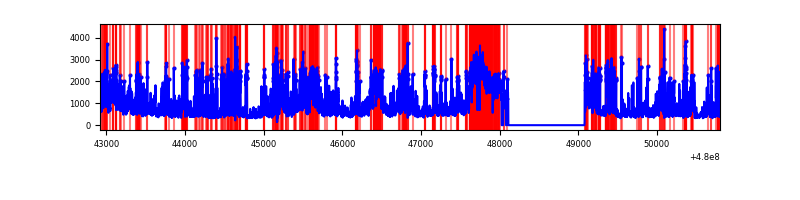 |
| C | 7881 | 6879 | 182 | 182 | 2.31% | 2.65% | 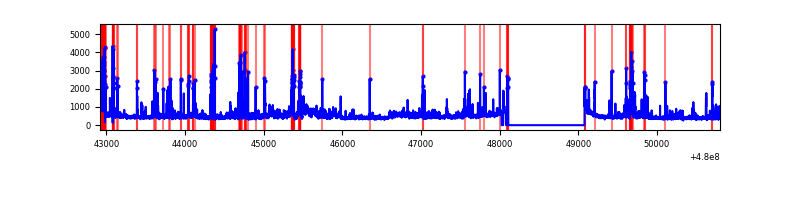 |
| D | 7881 | 6879 | 123 | 123 | 1.56% | 1.79% | 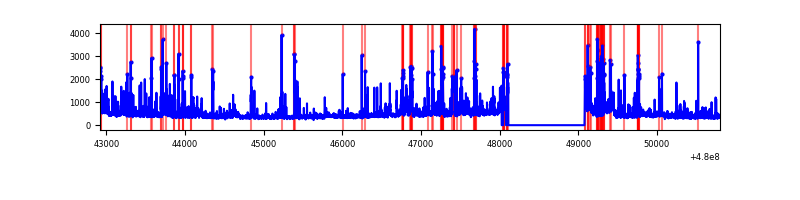 |
Top three noisy pixels from each quadrant. If the there are fewer than three noisy pixels in the level2.evt file, extra rows are filled as -1
| Pixel properties | Quadrant properties | ||||||
|---|---|---|---|---|---|---|---|
| Quadrant | DetID | PixID | Counts | Sigma | Mean | Median | Sigma |
| A | 12 | 3 | 1037290 | 5937.3 | 698 | 682 | 174.6 |
| A | 9 | 160 | 305342 | 1744.98 | 698 | 682 | 174.6 |
| A | 8 | 26 | 183590 | 1047.63 | 698 | 682 | 174.6 |
| B | 5 | 185 | 2052575 | 14713.75 | 660 | 638 | 139.5 |
| B | 5 | 255 | 803167 | 5754.67 | 660 | 638 | 139.5 |
| B | 10 | 254 | 585262 | 4192.14 | 660 | 638 | 139.5 |
| C | 4 | 12 | 345987 | 1815.99 | 686 | 680 | 190.1 |
| C | 12 | 247 | 283361 | 1486.64 | 686 | 680 | 190.1 |
| C | 0 | 145 | 168870 | 884.52 | 686 | 680 | 190.1 |
| D | 3 | 12 | 188520 | 986.3 | 674 | 652 | 190.5 |
| D | 10 | 172 | 173356 | 906.69 | 674 | 652 | 190.5 |
| D | 2 | 207 | 168954 | 883.58 | 674 | 652 | 190.5 |
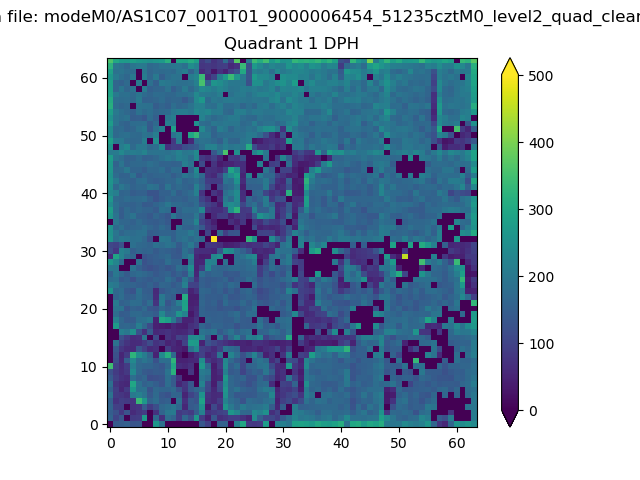
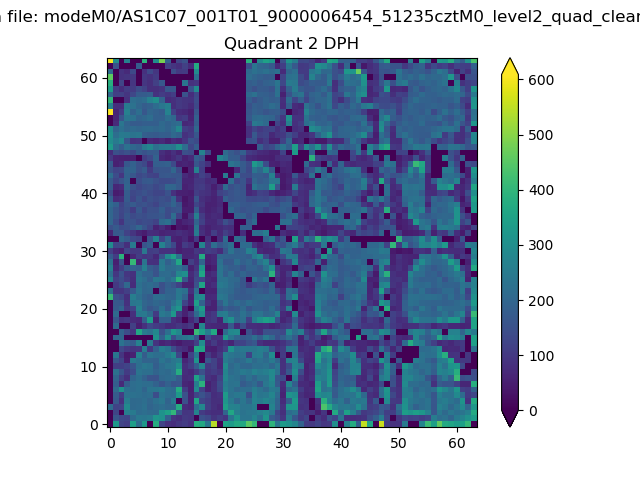
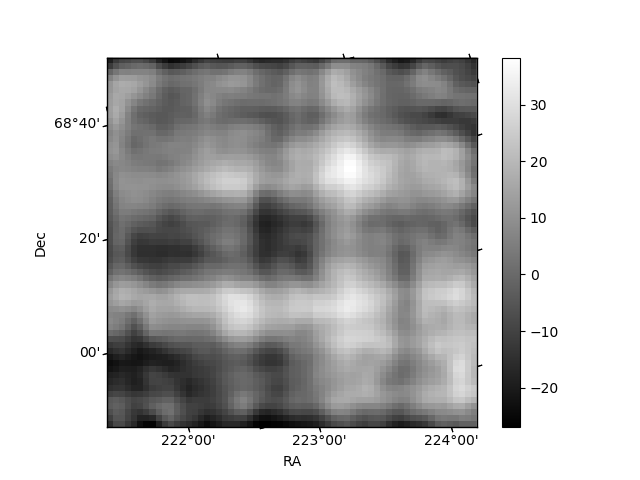
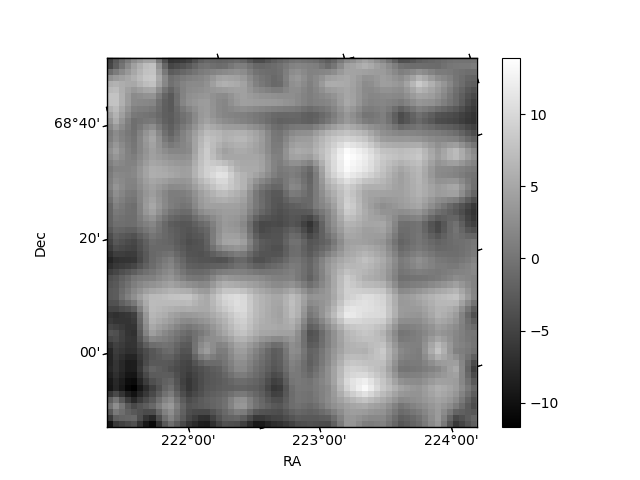
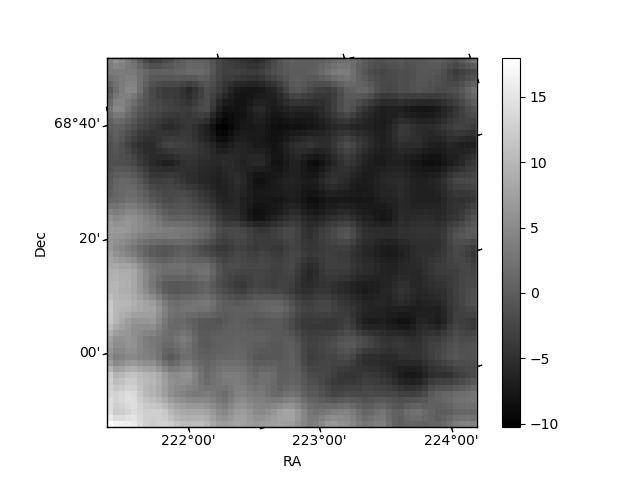
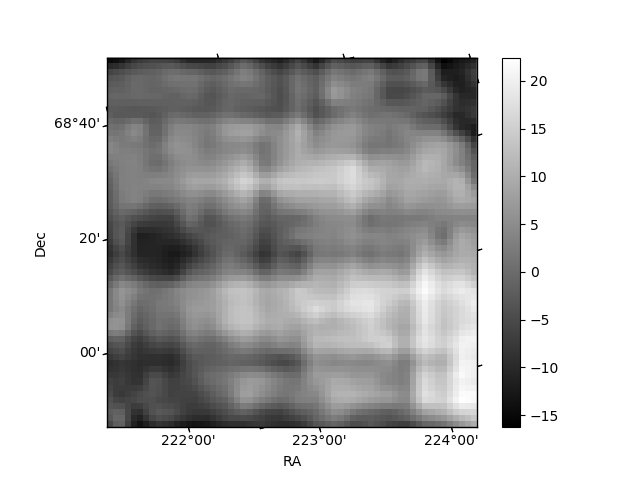
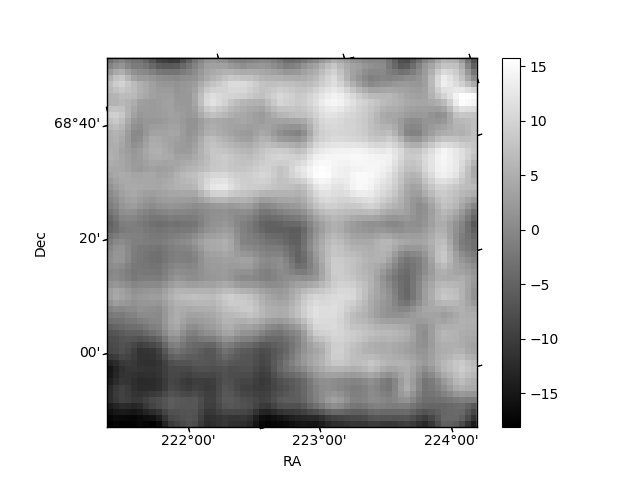
Histogram calculated using DETX and DETY for each event in the final _common_clean file
| Quadrant A | 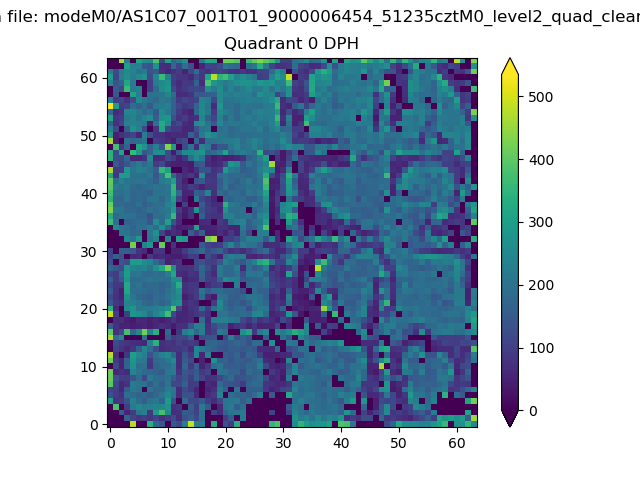 |
 |
Quadrant B |
|---|---|---|---|
| Quadrant D | 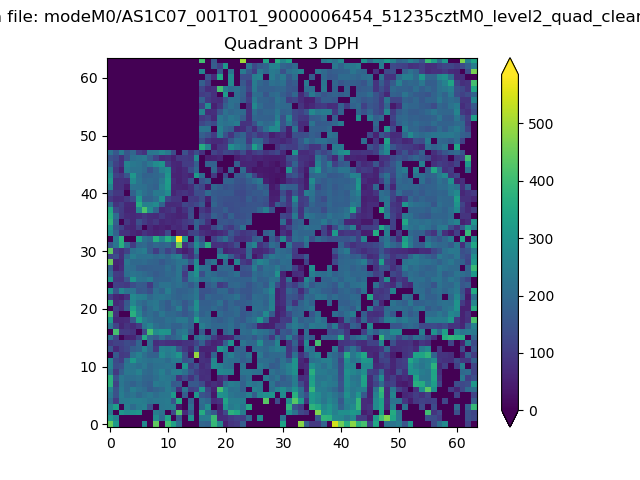 |
 |
Quadrant C |
| Plot type | Count rate plots | Images |
|---|---|---|
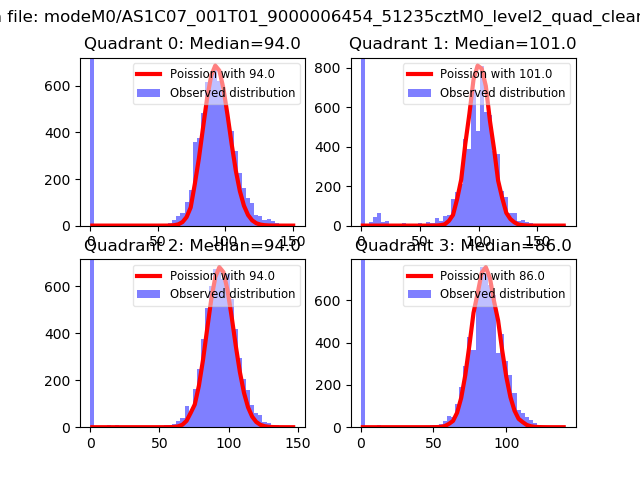
| Comparison with Poisson distribution Blue bars denote a histogram of data divided into 1 sec bins. Red curve is a Poisson curve with rate = median count rate of data. |
 |
 |
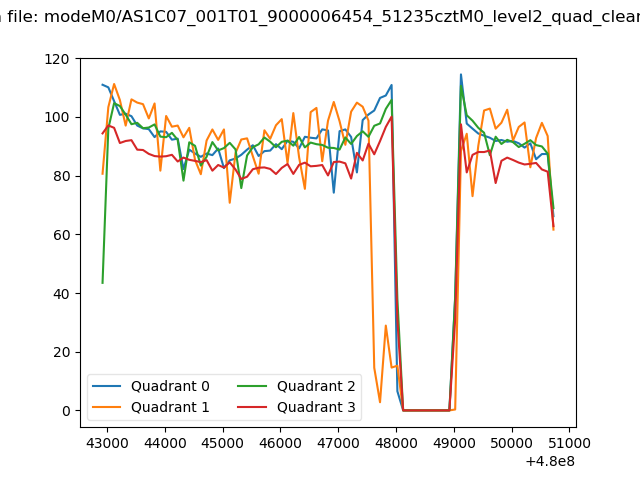
| Quadrant-wise count rates Data is divided into 100 sec bins |
 |
|
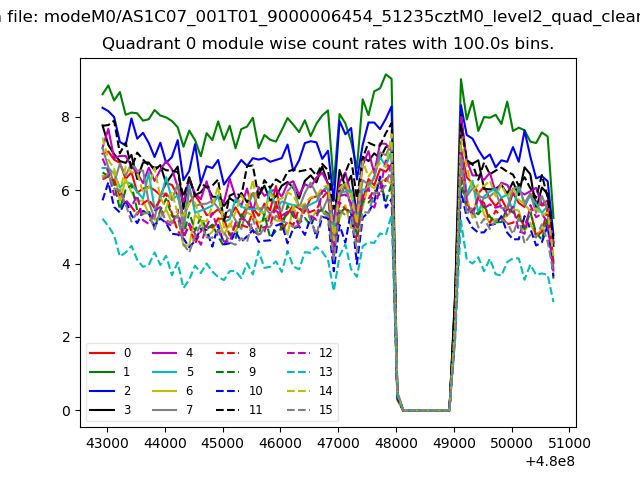
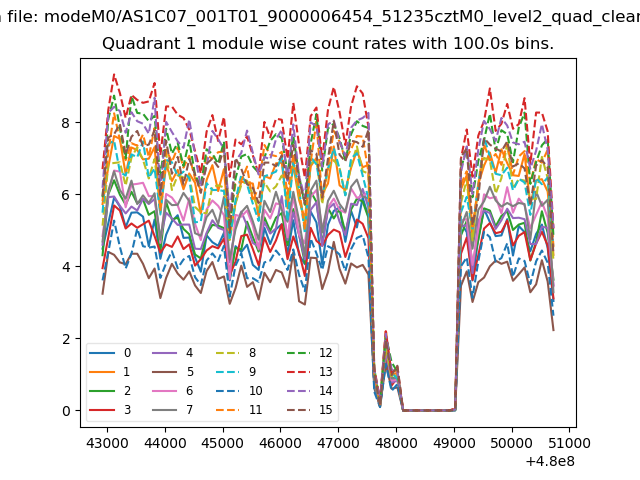
| Module-wise count rates for Quadrant A Data is divided into 100 sec bins |
 |
 |
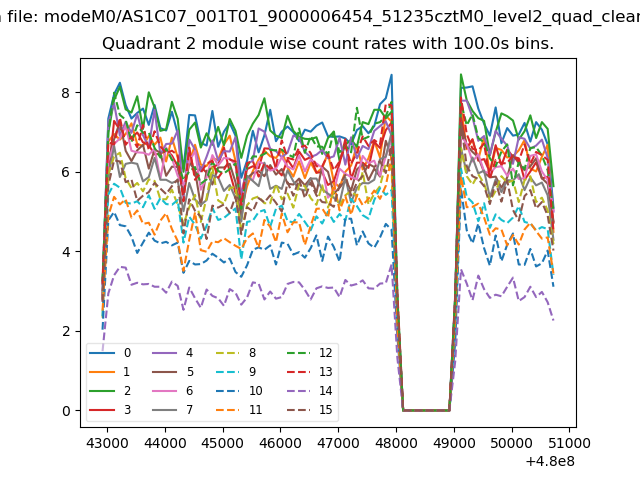
| Module-wise count rates for Quadrant B Data is divided into 100 sec bins |
 |
 |
| Module-wise count rates for Quadrant C Data is divided into 100 sec bins |
 |
 |
| Module-wise count rates for Quadrant D Data is divided into 100 sec bins |
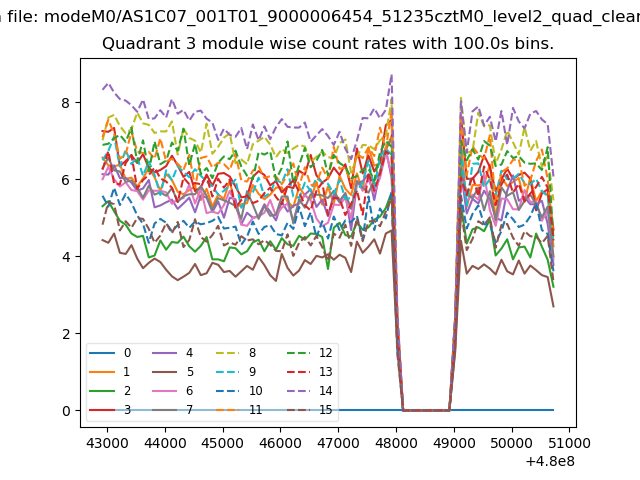 |
 |
| Parameter | Plot |
|---|---|
| CZT HV Monitor | 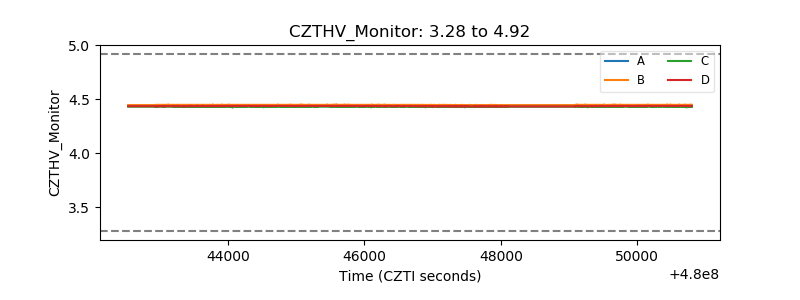 |
| D_VDD | 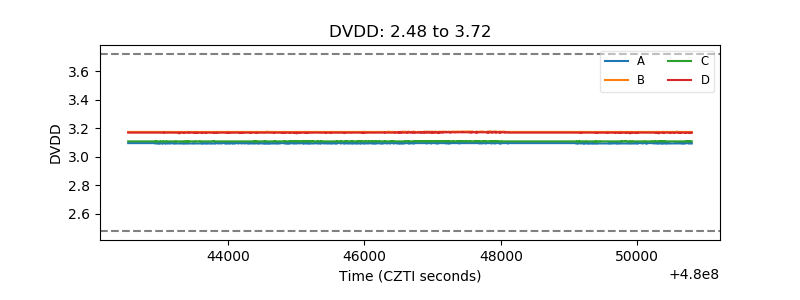 |
| Temperature 1 | 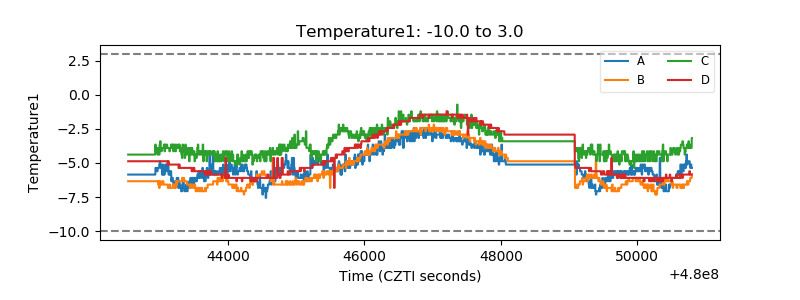 |
| Veto HV Monitor | 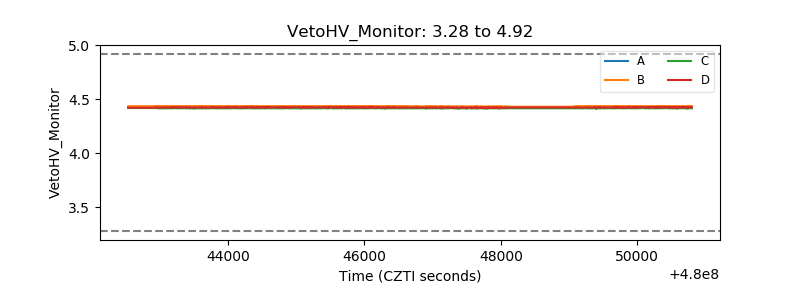 |
| Veto LLD | 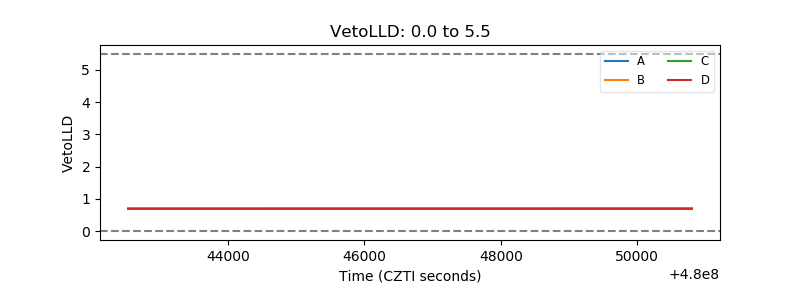 |
| Alpha Counter | 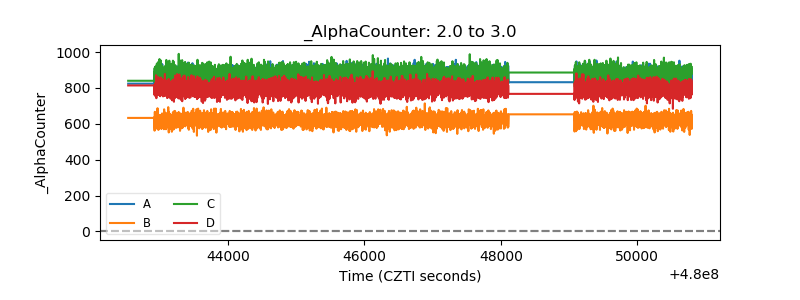 |
| _CPM_Rate | 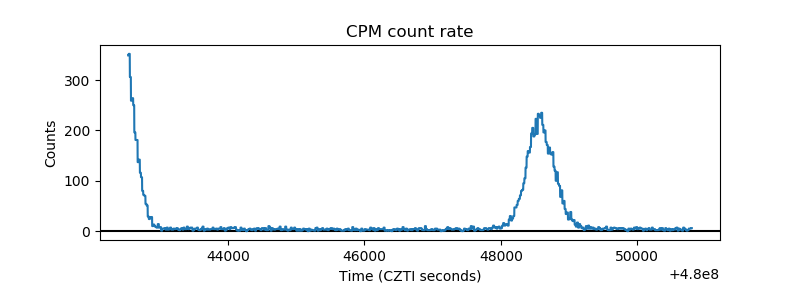 |
| CZT Counter | 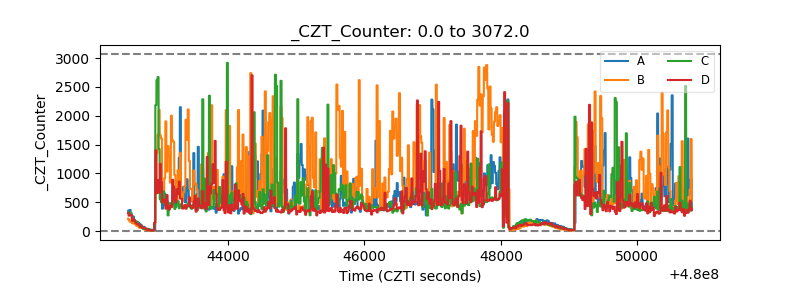 |
| +2.5 Volts monitor | 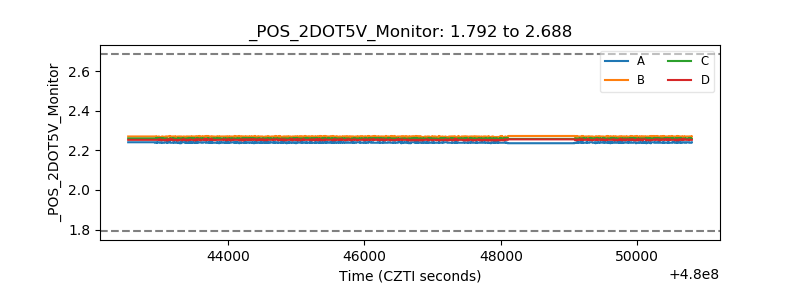 |
| +5 Volts monitor | 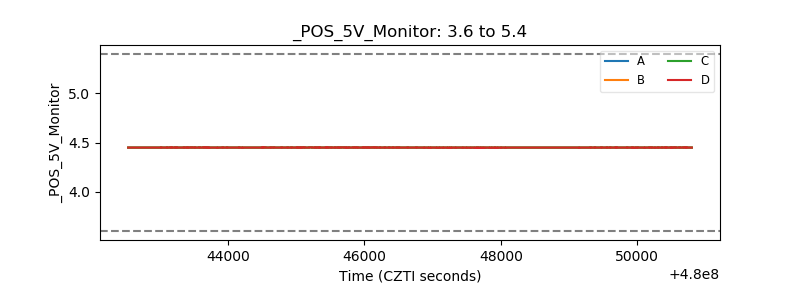 |
| _ROLL_ROT | 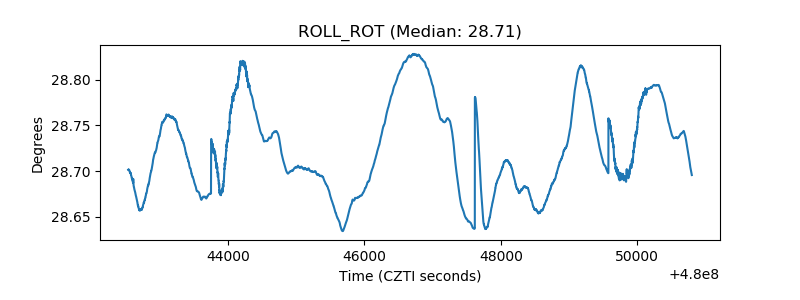 |
| _Roll_DEC | 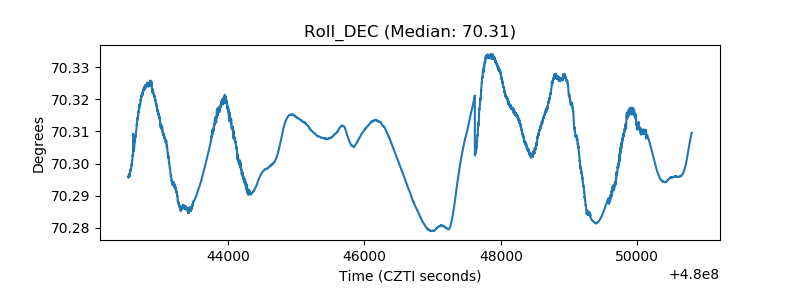 |
| _Roll_RA | 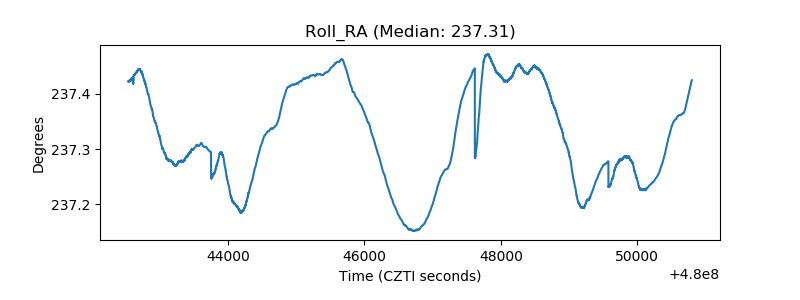 |
| Veto Counter | 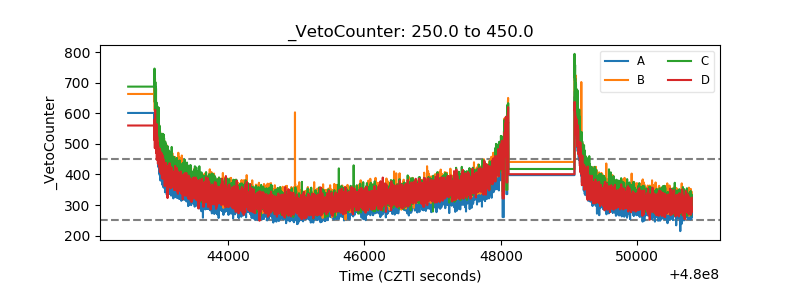 |