| Param | Original file | Final file |
|---|---|---|
| Filename | modeM0/AS1C07_001T01_9000006454_51236cztM0_level2.fits | modeM0/AS1C07_001T01_9000006454_51236cztM0_level2_quad_clean.evt |
| Size (bytes) | 527,388,480 | 88,801,920 |
| Size | 503.0 MB | 84.7 MB |
| Events in quadrant A | 5,929,563 | 539,536 |
| Events in quadrant B | 4,543,145 | 620,376 |
| Events in quadrant C | 4,613,781 | 550,359 |
| Events in quadrant D | 3,934,460 | 527,344 |
| Mode M0 | |||
|---|---|---|---|
| Quadrant | BADHDUFLAG | Total packets | Discarded packets |
| A | 0 | 22192 | 1 |
| B | 0 | 18053 | 1 |
| C | 0 | 18347 | 1 |
| D | 0 | 16689 | 1 |
| Mode SS | |||
|---|---|---|---|
| Quadrant | BADHDUFLAG | Total packets | Discarded packets |
| A | 0 | 134 | 0 |
| B | 0 | 134 | 0 |
| C | 0 | 134 | 0 |
| D | 0 | 134 | 0 |
| Mode M9 | |||
|---|---|---|---|
| Quadrant | BADHDUFLAG | Total packets | Discarded packets |
| A | 0 | 7 | 0 |
| B | 0 | 7 | 0 |
| C | 0 | 7 | 0 |
| D | 0 | 7 | 0 |
| Quadrant | Total seconds | Saturated seconds | Saturation percentage |
|---|---|---|---|
| A | 6456 | 664 | 10.285006% |
| B | 6457 | 432 | 6.690414% |
| C | 6457 | 498 | 7.712560% |
| D | 6457 | 252 | 3.902741% |
Noise dominated data is calculated using 1-second bins in cleaned event files. If a bin has >2000 counts, and if more than 50% of those come from <1% of pixels, then it is considered to be noise-dominated and hence unusable.
| Quadrant | # 1 sec bins | Bins with >0 counts | Bins with >2000 counts | High rate bins dominated by noise | Noise dominated (total time) | Noise dominated (detector-on time) | Marked lightcurve |
|---|---|---|---|---|---|---|---|
| A | 7216 | 6457 | 481 | 481 | 6.67% | 7.45% | 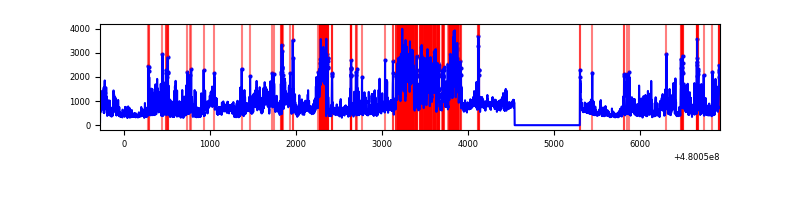 |
| B | 7217 | 6458 | 267 | 267 | 3.70% | 4.13% | 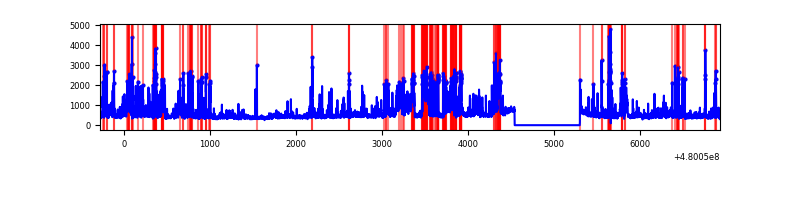 |
| C | 7217 | 6458 | 422 | 422 | 5.85% | 6.53% | 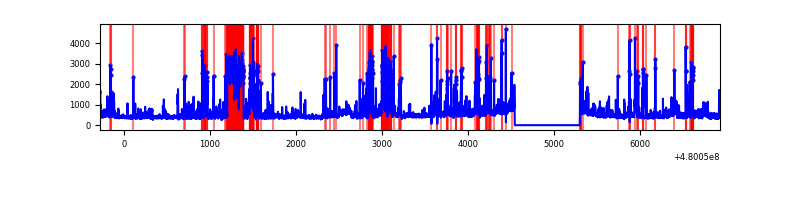 |
| D | 7217 | 6458 | 184 | 184 | 2.55% | 2.85% | 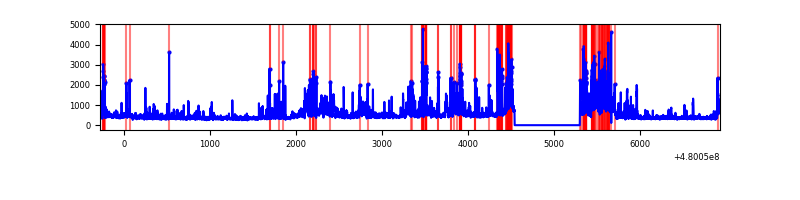 |
Top three noisy pixels from each quadrant. If the there are fewer than three noisy pixels in the level2.evt file, extra rows are filled as -1
| Pixel properties | Quadrant properties | ||||||
|---|---|---|---|---|---|---|---|
| Quadrant | DetID | PixID | Counts | Sigma | Mean | Median | Sigma |
| A | 8 | 26 | 1247727 | 7988.19 | 627 | 614 | 156.1 |
| A | 12 | 3 | 764130 | 4890.58 | 627 | 614 | 156.1 |
| A | 9 | 160 | 550850 | 3524.45 | 627 | 614 | 156.1 |
| B | 5 | 255 | 477048 | 3510.3 | 644 | 625 | 135.7 |
| B | 5 | 185 | 464263 | 3416.1 | 644 | 625 | 135.7 |
| B | 7 | 252 | 282480 | 2076.72 | 644 | 625 | 135.7 |
| C | 1 | 60 | 752950 | 4435.26 | 619 | 614 | 169.6 |
| C | 4 | 12 | 591721 | 3484.76 | 619 | 614 | 169.6 |
| C | 12 | 247 | 156853 | 921.08 | 619 | 614 | 169.6 |
| D | 2 | 62 | 440265 | 2512.92 | 618 | 597 | 175.0 |
| D | 10 | 172 | 356321 | 2033.14 | 618 | 597 | 175.0 |
| D | 2 | 207 | 281410 | 1604.98 | 618 | 597 | 175.0 |
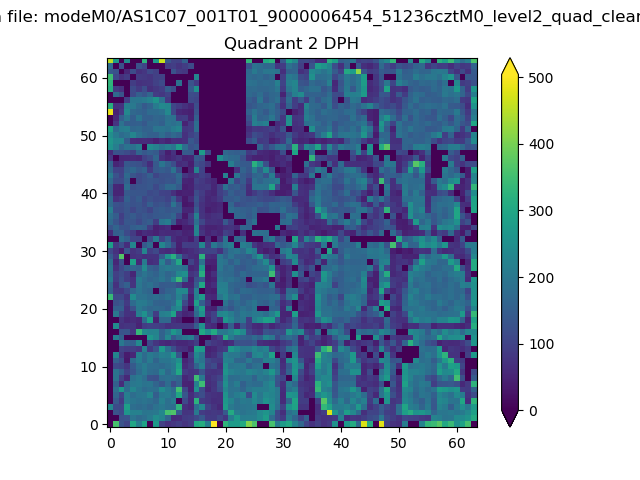
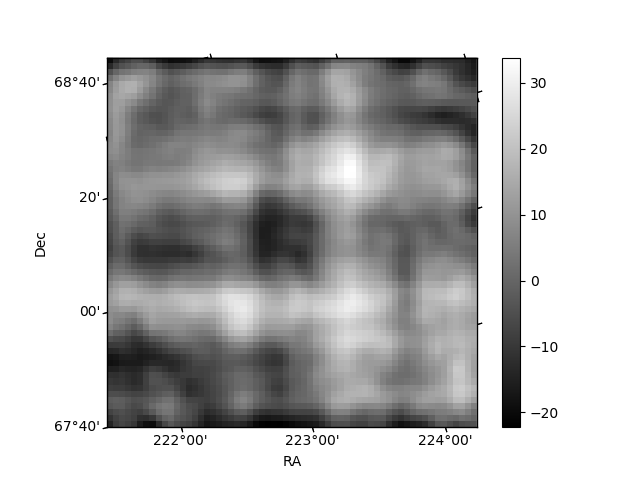
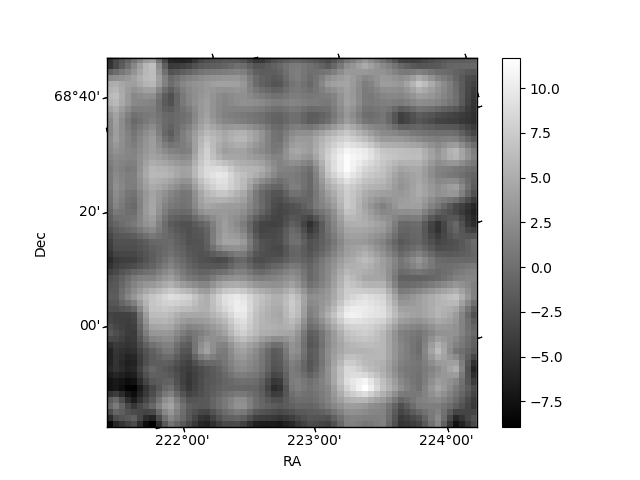
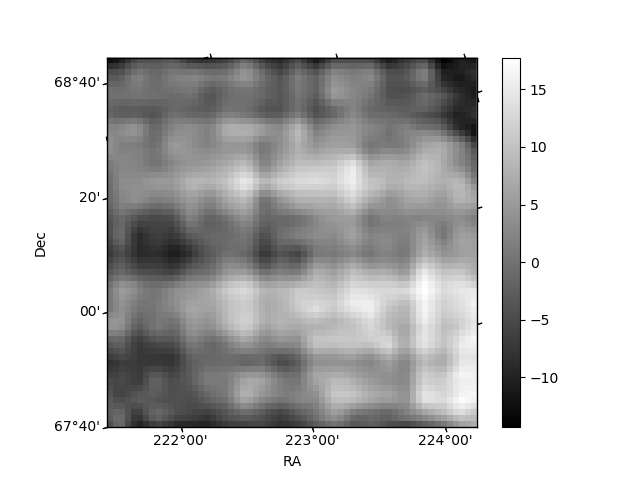
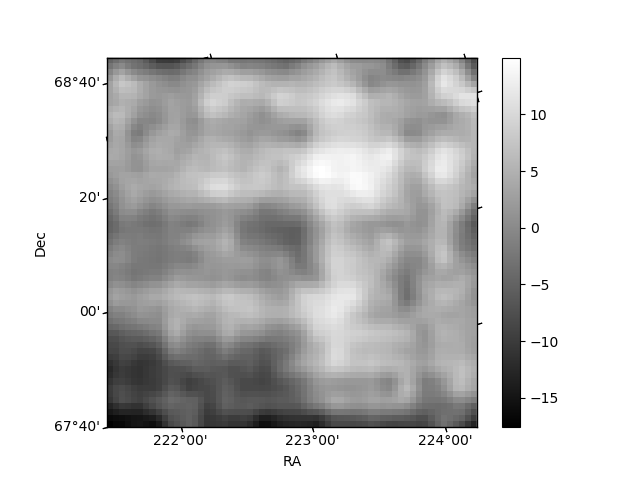
Histogram calculated using DETX and DETY for each event in the final _common_clean file
| Quadrant A | 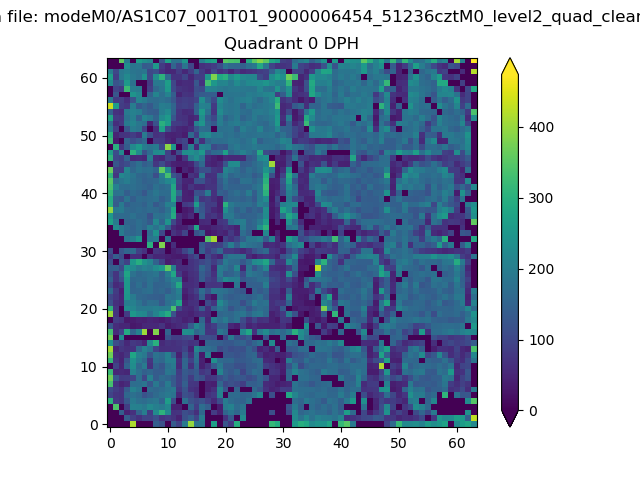 |
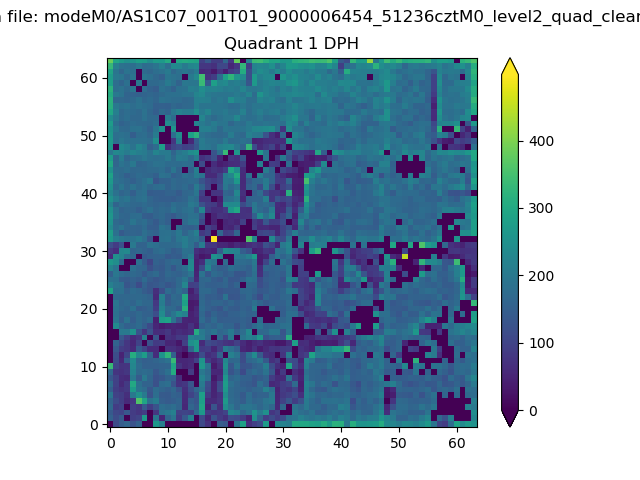 |
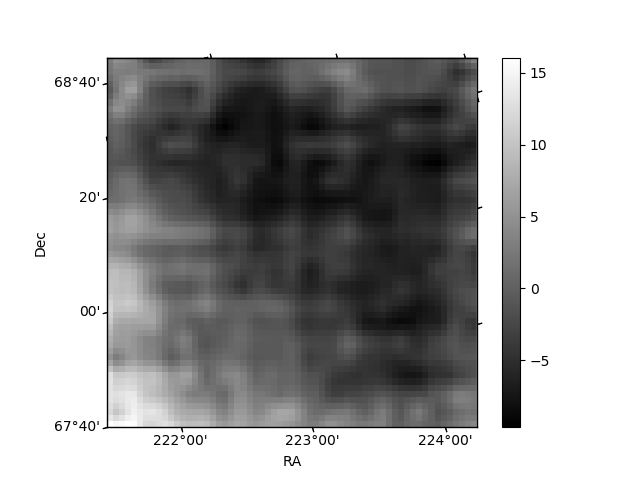
Quadrant B |
|---|---|---|---|
| Quadrant D | 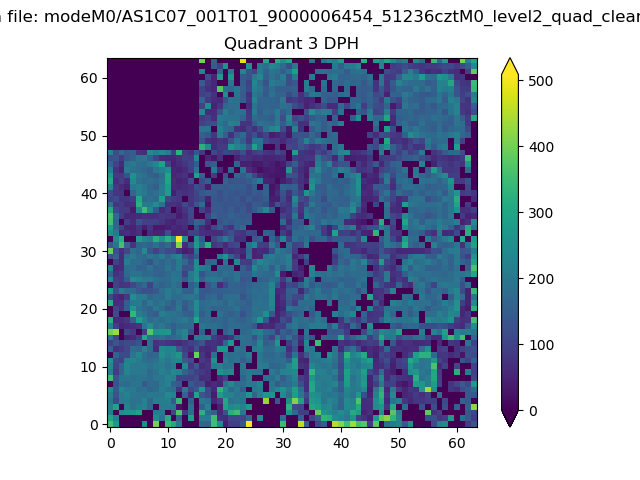 |
 |
Quadrant C |
| Plot type | Count rate plots | Images |
|---|---|---|
| Comparison with Poisson distribution Blue bars denote a histogram of data divided into 1 sec bins. Red curve is a Poisson curve with rate = median count rate of data. |
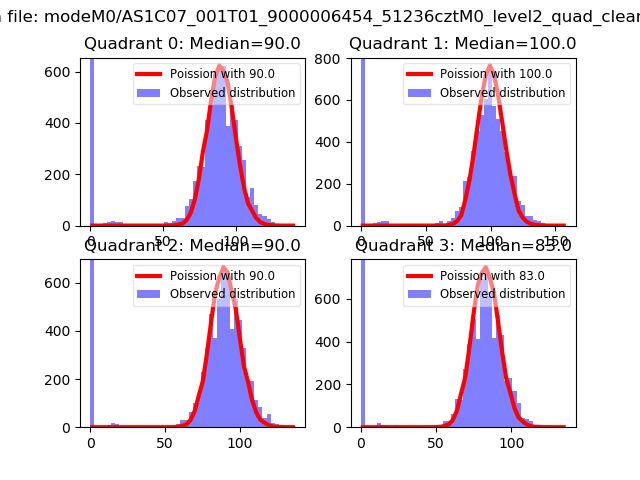 |
 |
| Quadrant-wise count rates Data is divided into 100 sec bins |
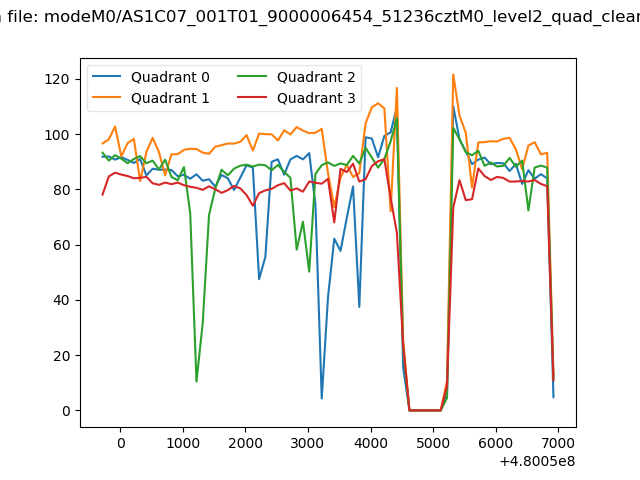 |
|
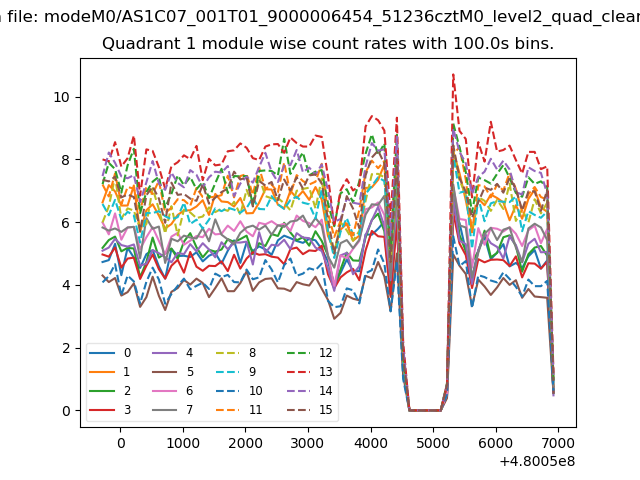
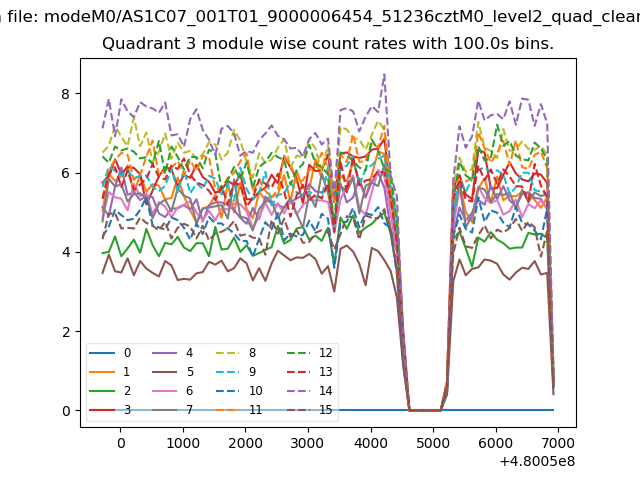
| Module-wise count rates for Quadrant A Data is divided into 100 sec bins |
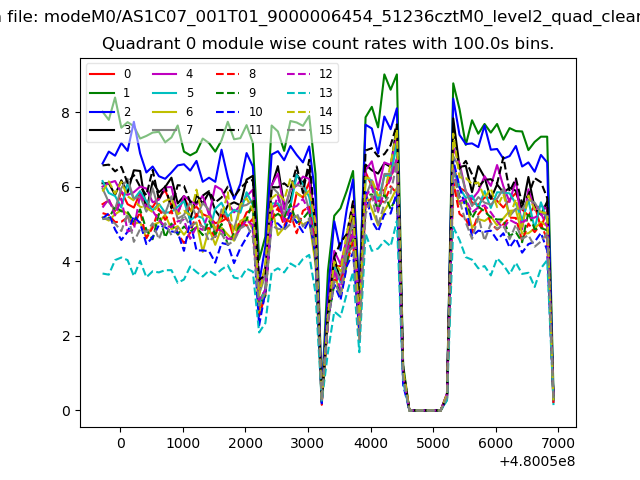 |
 |
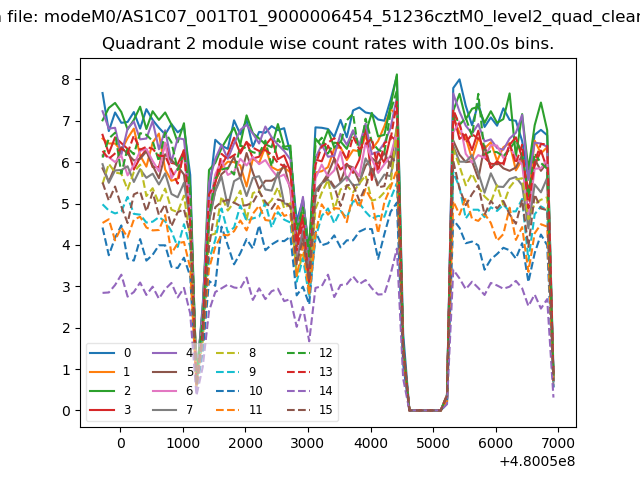
| Module-wise count rates for Quadrant B Data is divided into 100 sec bins |
 |
 |
| Module-wise count rates for Quadrant C Data is divided into 100 sec bins |
 |
 |
| Module-wise count rates for Quadrant D Data is divided into 100 sec bins |
 |
 |
| Parameter | Plot |
|---|---|
| CZT HV Monitor | 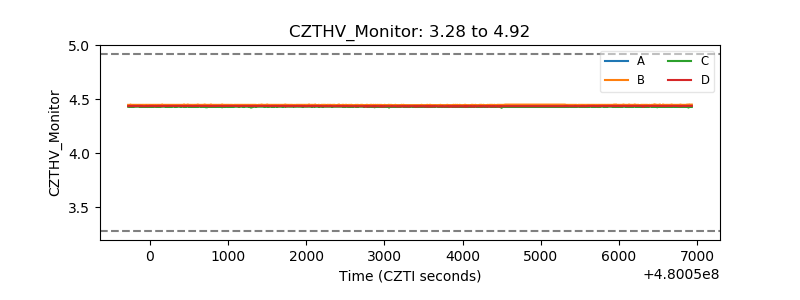 |
| D_VDD | 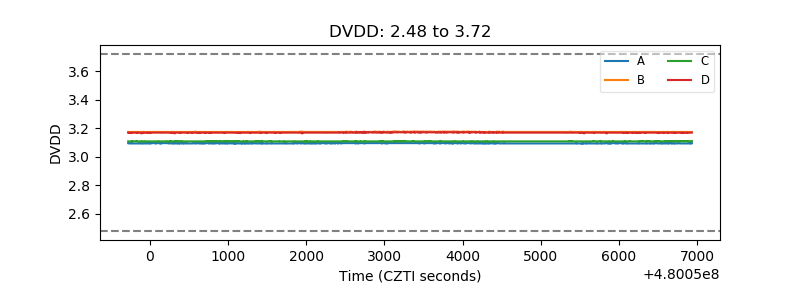 |
| Temperature 1 |  |
| Veto HV Monitor | 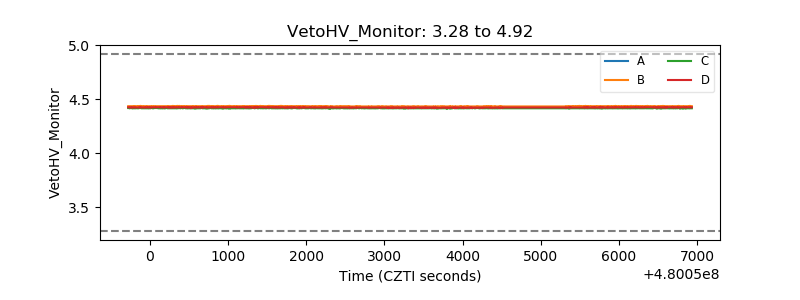 |
| Veto LLD | 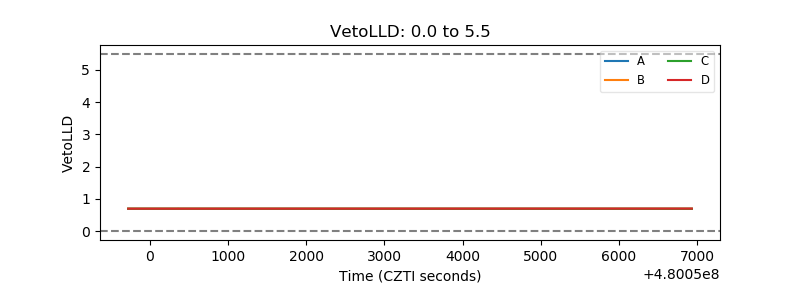 |
| Alpha Counter | 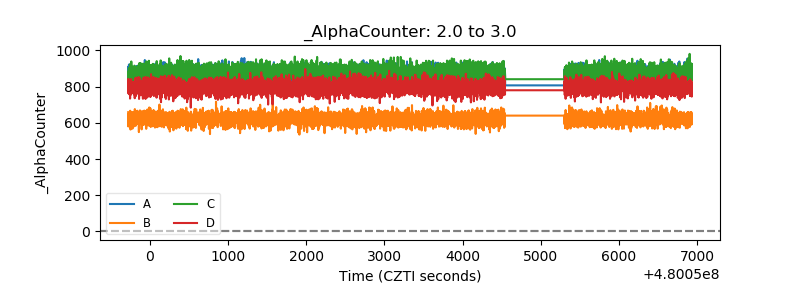 |
| _CPM_Rate | 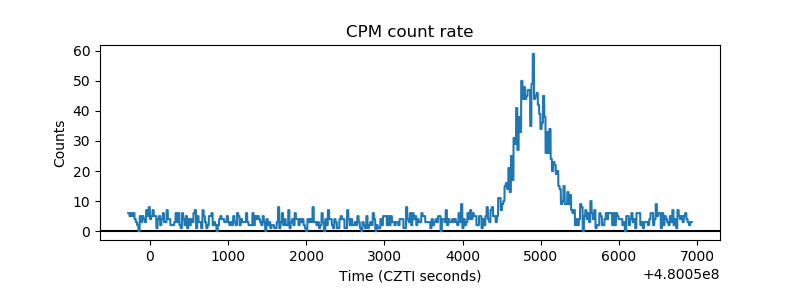 |
| CZT Counter | 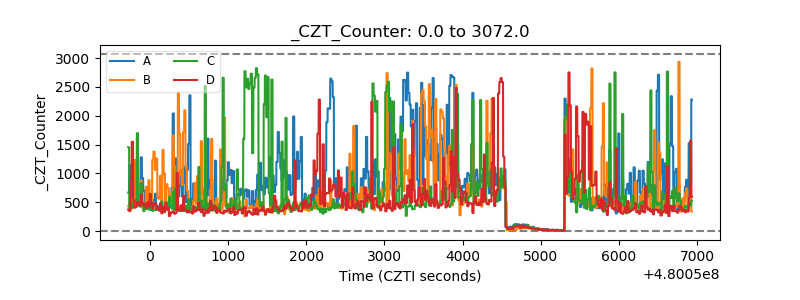 |
| +2.5 Volts monitor | 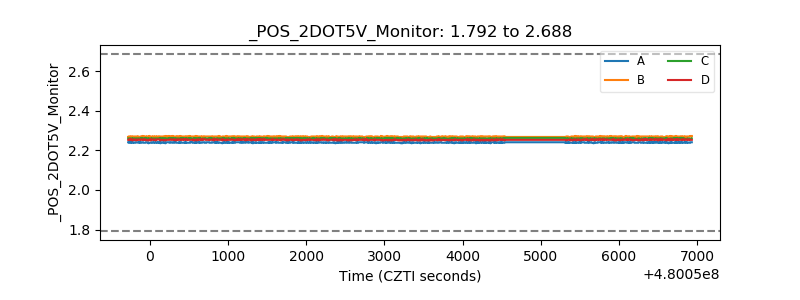 |
| +5 Volts monitor | 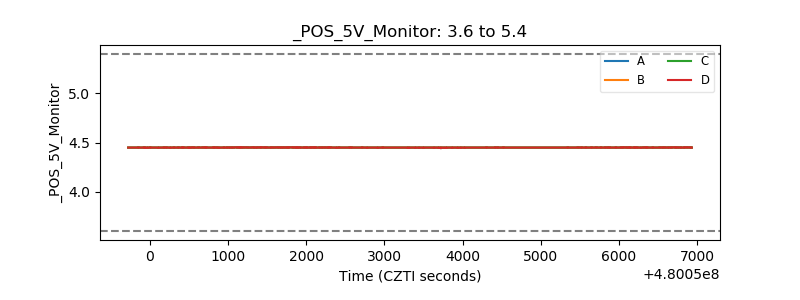 |
| _ROLL_ROT | 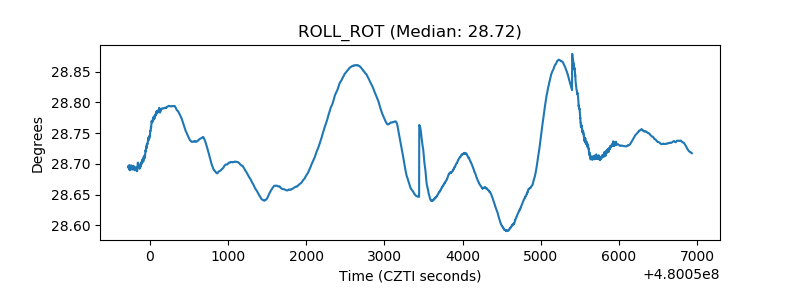 |
| _Roll_DEC | 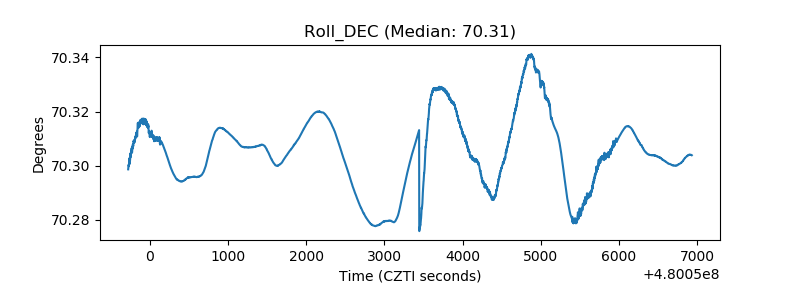 |
| _Roll_RA | 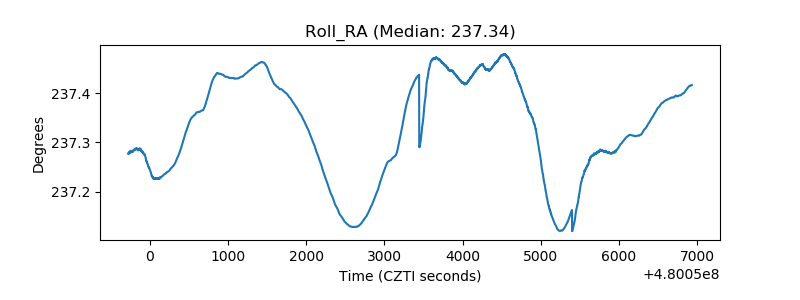 |
| Veto Counter | 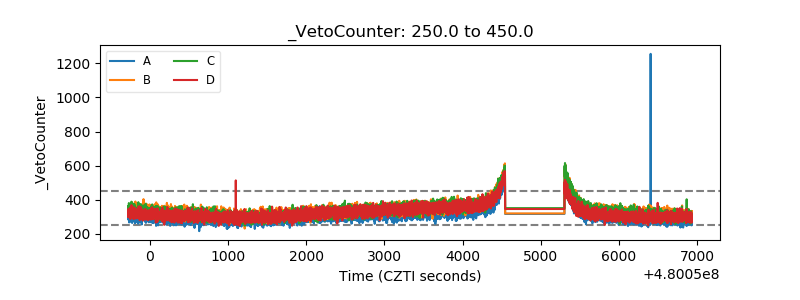 |