| Param | Original file | Final file |
|---|---|---|
| Filename | modeM0/AS1C07_001T01_9000006454_51237cztM0_level2.fits | modeM0/AS1C07_001T01_9000006454_51237cztM0_level2_quad_clean.evt |
| Size (bytes) | 652,285,440 | 91,370,880 |
| Size | 622.1 MB | 87.1 MB |
| Events in quadrant A | 7,195,307 | 530,597 |
| Events in quadrant B | 5,733,957 | 627,027 |
| Events in quadrant C | 5,864,772 | 575,539 |
| Events in quadrant D | 4,813,704 | 547,915 |
| Mode M0 | |||
|---|---|---|---|
| Quadrant | BADHDUFLAG | Total packets | Discarded packets |
| A | 0 | 30653 | 4571 |
| B | 0 | 24794 | 2903 |
| C | 0 | 25442 | 3145 |
| D | 0 | 21661 | 2336 |
| Mode SS | |||
|---|---|---|---|
| Quadrant | BADHDUFLAG | Total packets | Discarded packets |
| A | 0 | 158 | 8 |
| B | 0 | 156 | 2 |
| C | 0 | 158 | 7 |
| D | 0 | 160 | 6 |
| Mode M9 | |||
|---|---|---|---|
| Quadrant | BADHDUFLAG | Total packets | Discarded packets |
| A | 0 | 7 | 0 |
| B | 0 | 7 | 0 |
| C | 0 | 7 | 0 |
| D | 0 | 7 | 0 |
| Quadrant | Total seconds | Saturated seconds | Saturation percentage |
|---|---|---|---|
| A | 6811 | 1090 | 16.003524% |
| B | 6938 | 828 | 11.934275% |
| C | 6946 | 700 | 10.077743% |
| D | 7015 | 462 | 6.585887% |
Noise dominated data is calculated using 1-second bins in cleaned event files. If a bin has >2000 counts, and if more than 50% of those come from <1% of pixels, then it is considered to be noise-dominated and hence unusable.
| Quadrant | # 1 sec bins | Bins with >0 counts | Bins with >2000 counts | High rate bins dominated by noise | Noise dominated (total time) | Noise dominated (detector-on time) | Marked lightcurve |
|---|---|---|---|---|---|---|---|
| A | 8598 | 7267 | 764 | 764 | 8.89% | 10.51% | 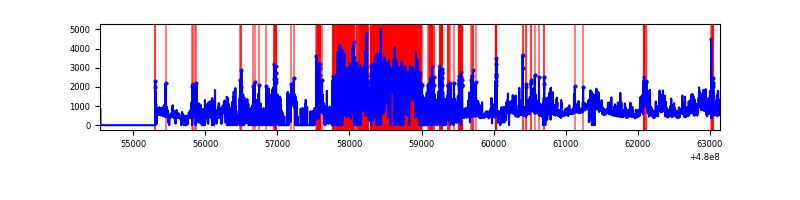 |
| B | 8598 | 7343 | 490 | 490 | 5.70% | 6.67% |  |
| C | 8599 | 7352 | 447 | 447 | 5.20% | 6.08% | 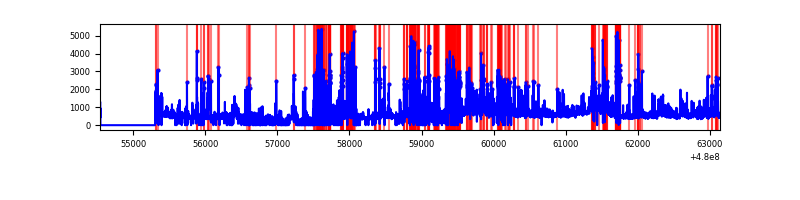 |
| D | 8599 | 7425 | 237 | 237 | 2.76% | 3.19% | 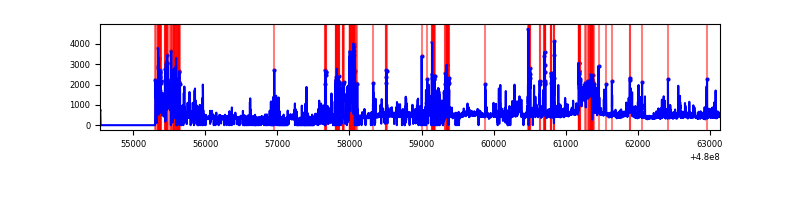 |
Top three noisy pixels from each quadrant. If the there are fewer than three noisy pixels in the level2.evt file, extra rows are filled as -1
| Pixel properties | Quadrant properties | ||||||
|---|---|---|---|---|---|---|---|
| Quadrant | DetID | PixID | Counts | Sigma | Mean | Median | Sigma |
| A | 8 | 26 | 2198227 | 12822.41 | 683 | 664 | 171.4 |
| A | 12 | 3 | 1101110 | 6420.92 | 683 | 664 | 171.4 |
| A | 12 | 80 | 451633 | 2631.33 | 683 | 664 | 171.4 |
| B | 5 | 185 | 703267 | 4643.47 | 708 | 683 | 151.3 |
| B | 5 | 255 | 670266 | 4425.36 | 708 | 683 | 151.3 |
| B | 10 | 254 | 408984 | 2698.52 | 708 | 683 | 151.3 |
| C | 4 | 12 | 1297942 | 6979.07 | 683 | 678 | 185.9 |
| C | 1 | 60 | 430668 | 2313.28 | 683 | 678 | 185.9 |
| C | 12 | 247 | 320866 | 1722.56 | 683 | 678 | 185.9 |
| D | 2 | 62 | 816911 | 4086.46 | 701 | 674 | 199.7 |
| D | 10 | 172 | 436349 | 2181.19 | 701 | 674 | 199.7 |
| D | 2 | 207 | 265797 | 1327.33 | 701 | 674 | 199.7 |
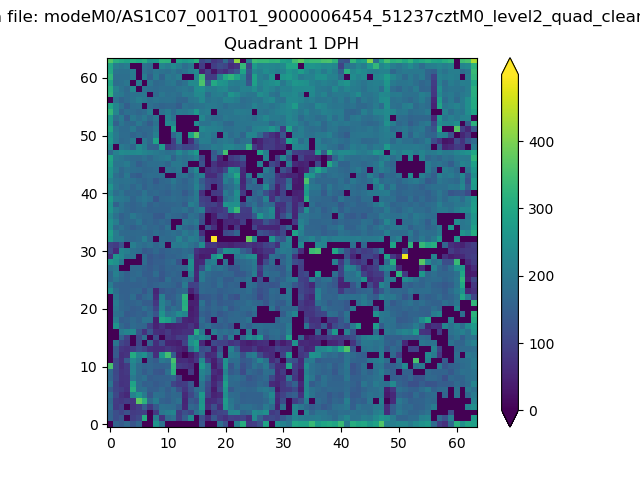
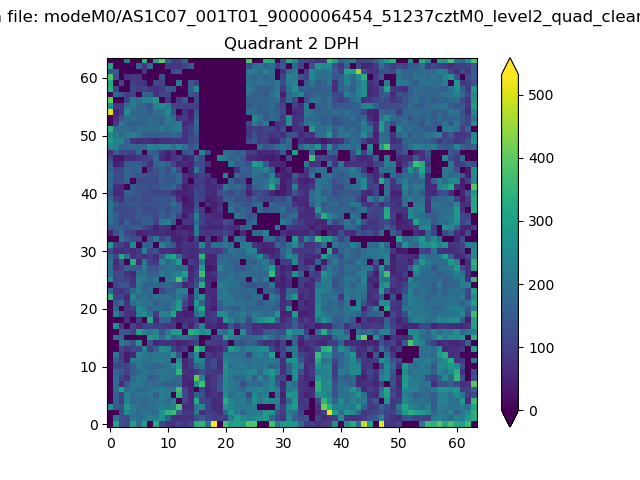
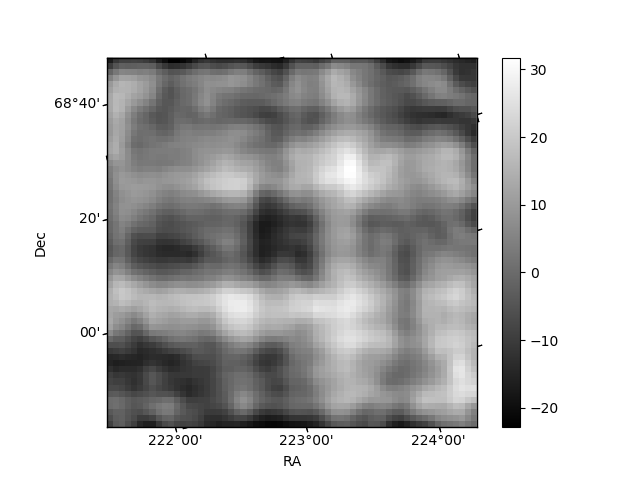
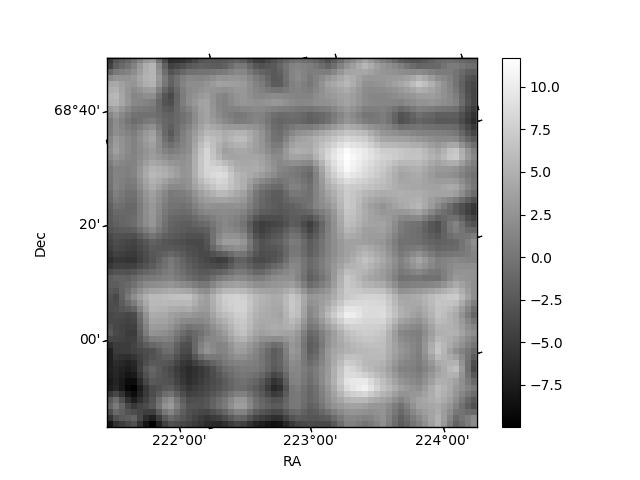
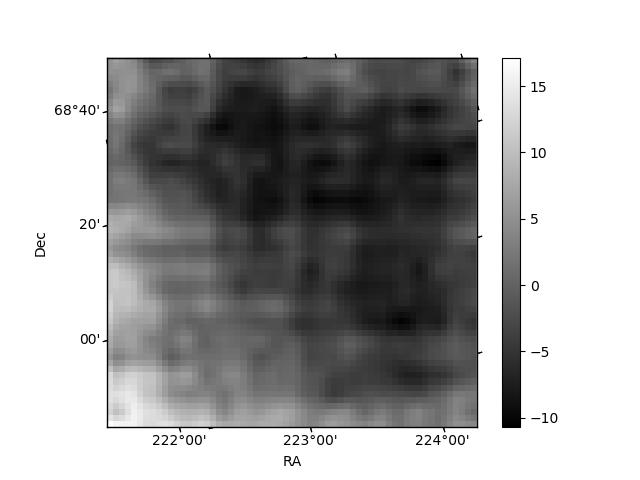
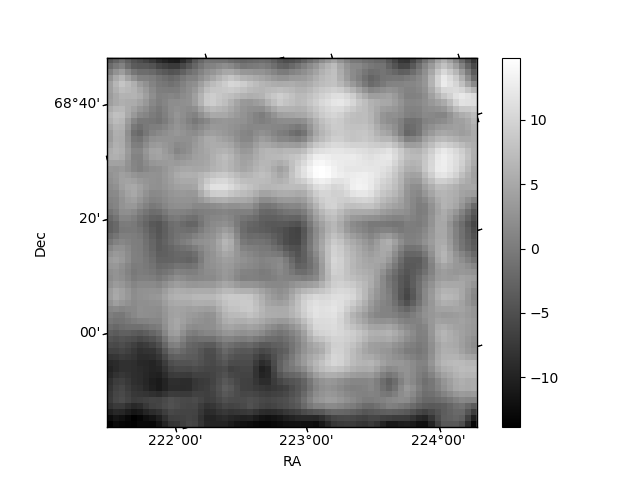
Histogram calculated using DETX and DETY for each event in the final _common_clean file
| Quadrant A | 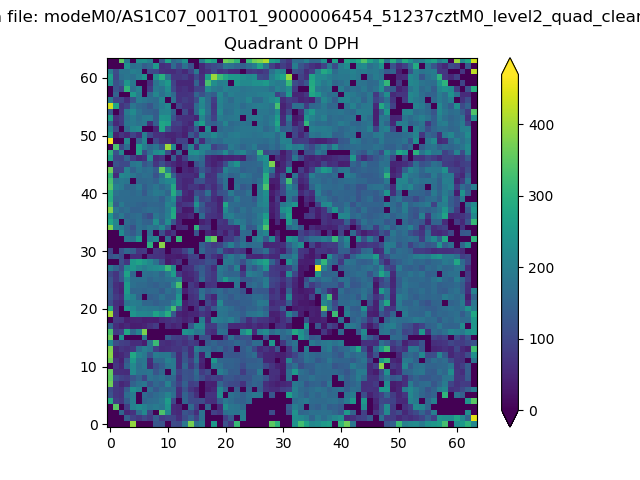 |
 |
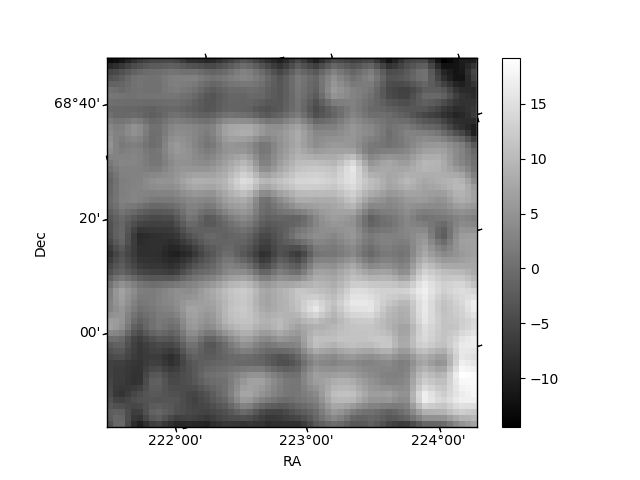
Quadrant B |
|---|---|---|---|
| Quadrant D | 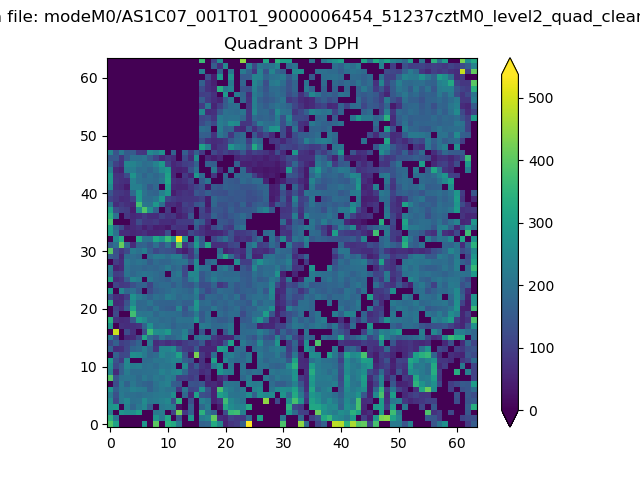 |
 |
Quadrant C |
| Plot type | Count rate plots | Images |
|---|---|---|
| Comparison with Poisson distribution Blue bars denote a histogram of data divided into 1 sec bins. Red curve is a Poisson curve with rate = median count rate of data. |
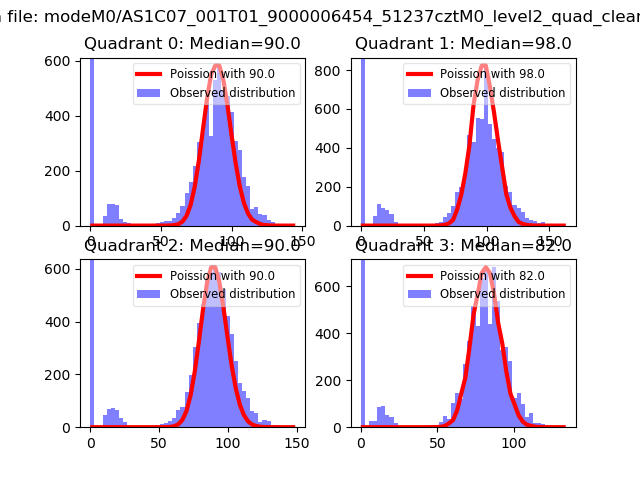 |
 |
| Quadrant-wise count rates Data is divided into 100 sec bins |
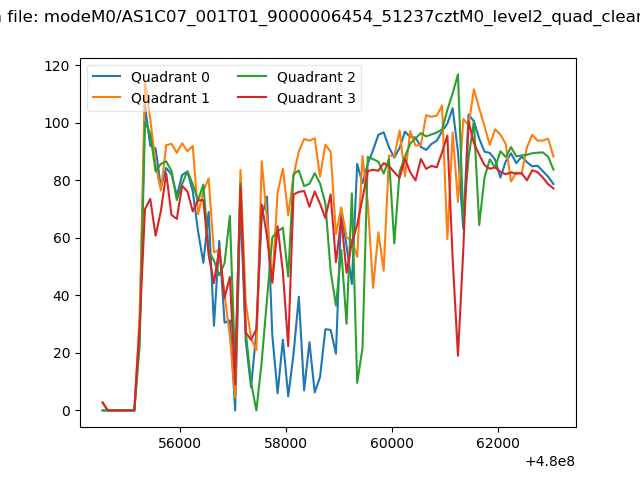 |
|
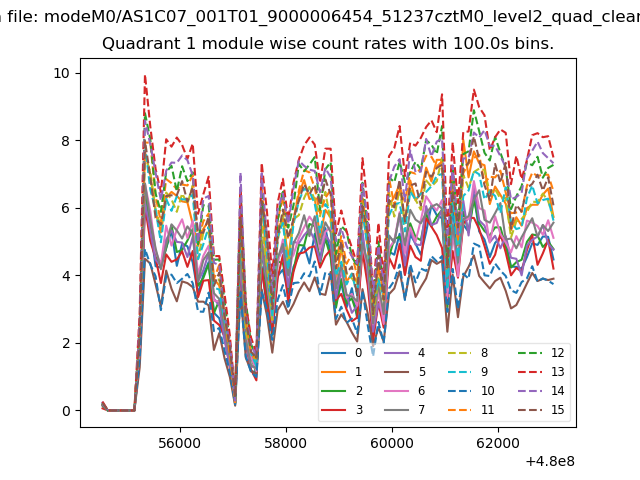
| Module-wise count rates for Quadrant A Data is divided into 100 sec bins |
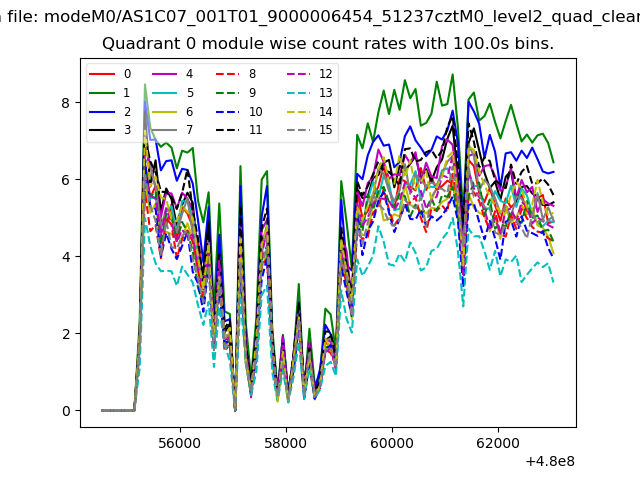 |
 |
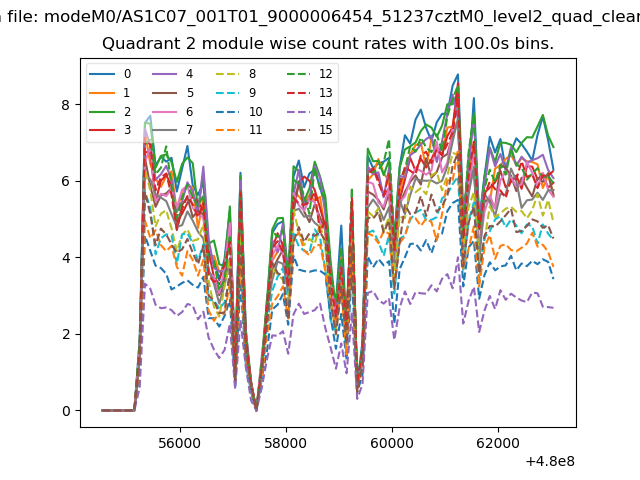
| Module-wise count rates for Quadrant B Data is divided into 100 sec bins |
 |
 |
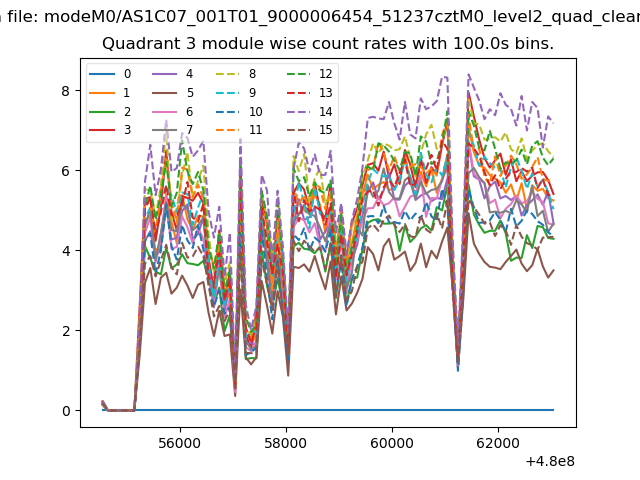
| Module-wise count rates for Quadrant C Data is divided into 100 sec bins |
 |
 |
| Module-wise count rates for Quadrant D Data is divided into 100 sec bins |
 |
 |
| Parameter | Plot |
|---|---|
| CZT HV Monitor | 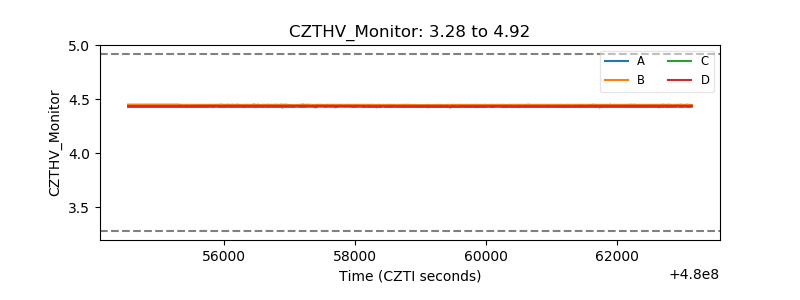 |
| D_VDD | 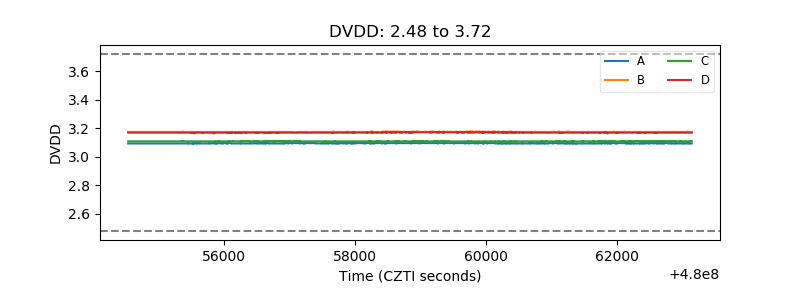 |
| Temperature 1 | 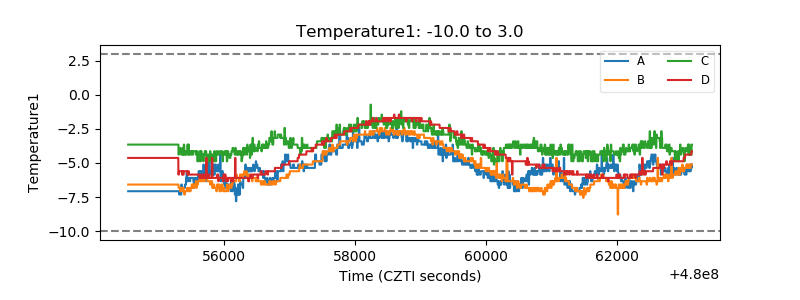 |
| Veto HV Monitor | 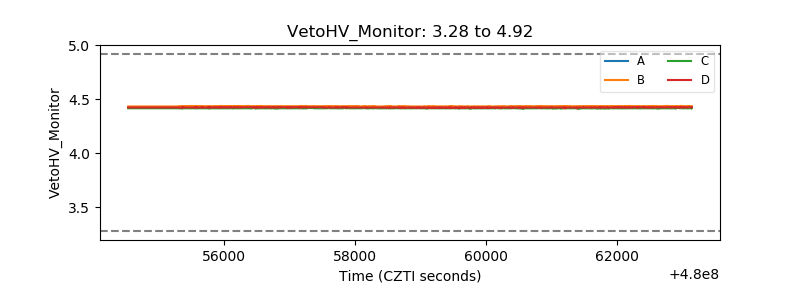 |
| Veto LLD | 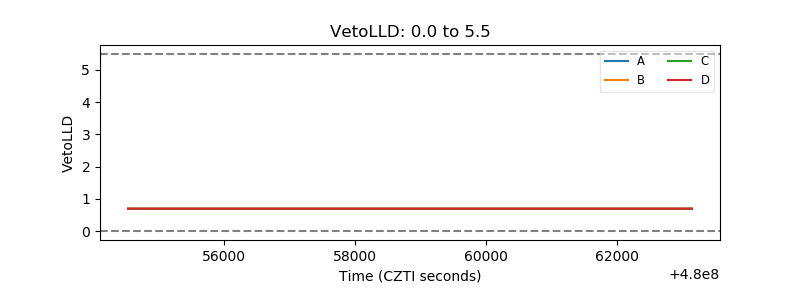 |
| Alpha Counter | 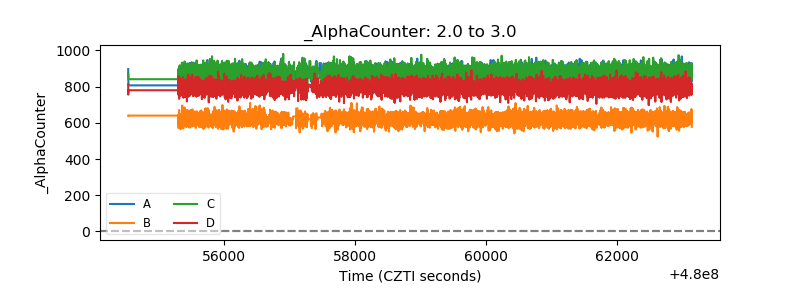 |
| _CPM_Rate | 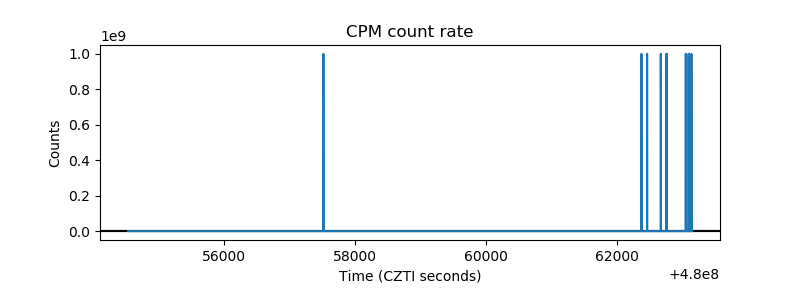 |
| CZT Counter | 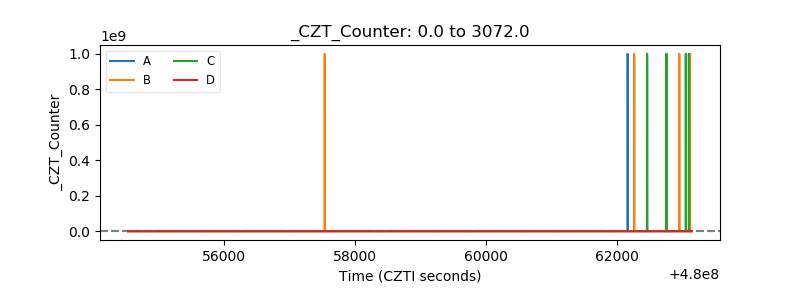 |
| +2.5 Volts monitor | 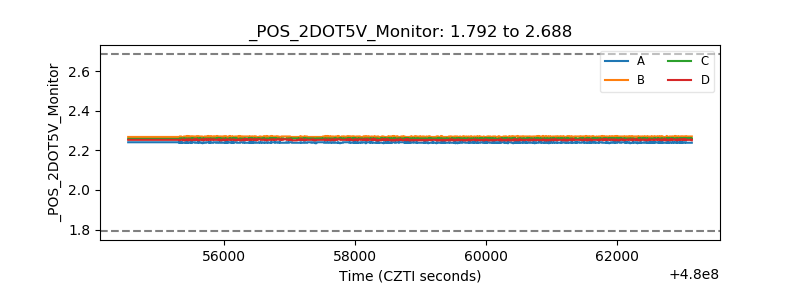 |
| +5 Volts monitor | 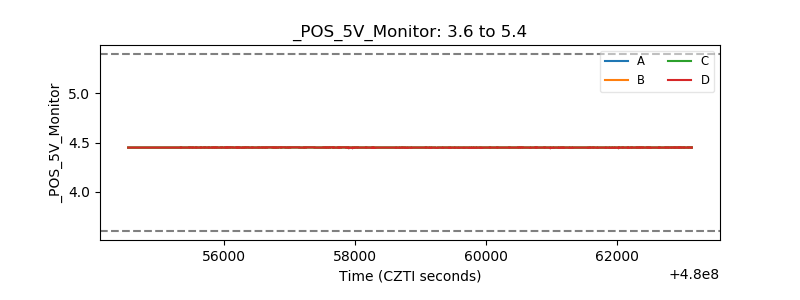 |
| _ROLL_ROT | 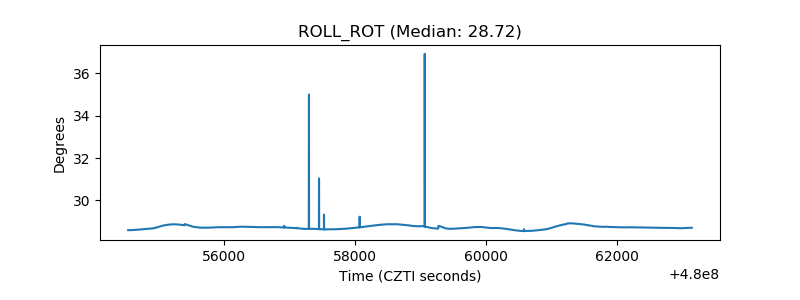 |
| _Roll_DEC | 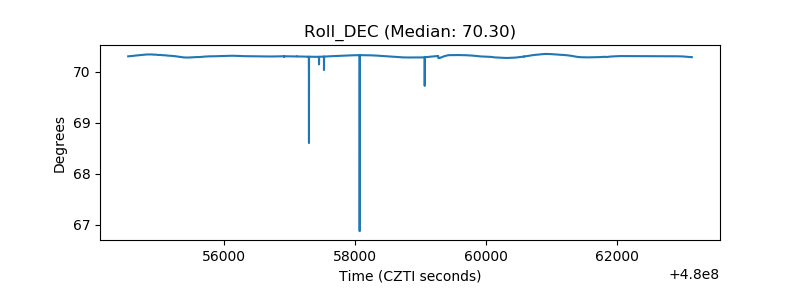 |
| _Roll_RA | 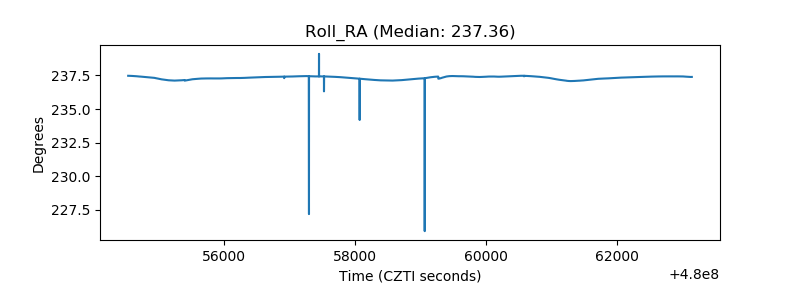 |
| Veto Counter | 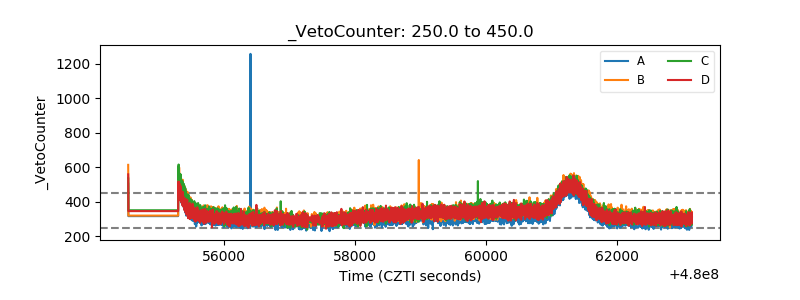 |