| Param | Original file | Final file |
|---|---|---|
| Filename | modeM0/AS1C07_001T01_9000006454_51238cztM0_level2.fits | modeM0/AS1C07_001T01_9000006454_51238cztM0_level2_quad_clean.evt |
| Size (bytes) | 757,995,840 | 96,076,800 |
| Size | 722.9 MB | 91.6 MB |
| Events in quadrant A | 6,230,938 | 610,287 |
| Events in quadrant B | 5,484,889 | 690,487 |
| Events in quadrant C | 7,829,161 | 588,728 |
| Events in quadrant D | 7,946,884 | 509,323 |
| Mode M0 | |||
|---|---|---|---|
| Quadrant | BADHDUFLAG | Total packets | Discarded packets |
| A | 0 | 23649 | 0 |
| B | 0 | 21388 | 0 |
| C | 0 | 28363 | 0 |
| D | 0 | 28668 | 1 |
| Mode SS | |||
|---|---|---|---|
| Quadrant | BADHDUFLAG | Total packets | Discarded packets |
| A | 0 | 146 | 0 |
| B | 0 | 146 | 0 |
| C | 0 | 146 | 0 |
| D | 0 | 146 | 0 |
| Quadrant | Total seconds | Saturated seconds | Saturation percentage |
|---|---|---|---|
| A | 7329 | 624 | 8.514122% |
| B | 7330 | 500 | 6.821282% |
| C | 7330 | 924 | 12.605730% |
| D | 7329 | 1354 | 18.474553% |
Noise dominated data is calculated using 1-second bins in cleaned event files. If a bin has >2000 counts, and if more than 50% of those come from <1% of pixels, then it is considered to be noise-dominated and hence unusable.
| Quadrant | # 1 sec bins | Bins with >0 counts | Bins with >2000 counts | High rate bins dominated by noise | Noise dominated (total time) | Noise dominated (detector-on time) | Marked lightcurve |
|---|---|---|---|---|---|---|---|
| A | 7329 | 7329 | 448 | 448 | 6.11% | 6.11% | 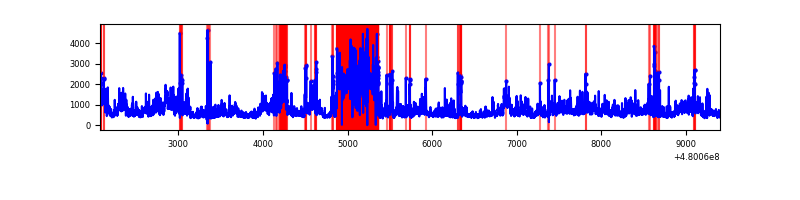 |
| B | 7330 | 7330 | 358 | 358 | 4.88% | 4.88% | 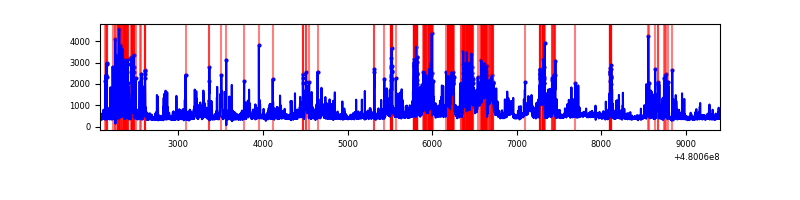 |
| C | 7330 | 7330 | 957 | 957 | 13.06% | 13.06% | 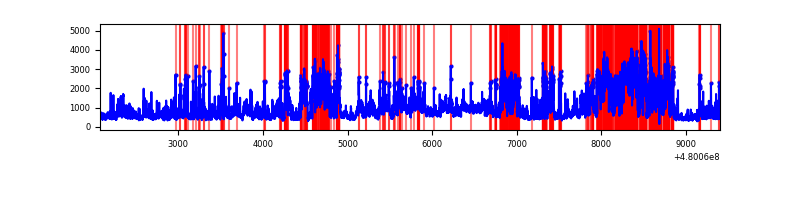 |
| D | 7329 | 7328 | 1357 | 1357 | 18.52% | 18.52% | 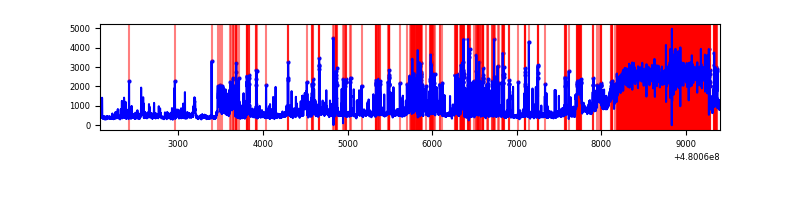 |
Top three noisy pixels from each quadrant. If the there are fewer than three noisy pixels in the level2.evt file, extra rows are filled as -1
| Pixel properties | Quadrant properties | ||||||
|---|---|---|---|---|---|---|---|
| Quadrant | DetID | PixID | Counts | Sigma | Mean | Median | Sigma |
| A | 8 | 26 | 1287758 | 7341.53 | 699 | 681 | 175.3 |
| A | 12 | 3 | 988006 | 5631.74 | 699 | 681 | 175.3 |
| A | 9 | 160 | 385930 | 2197.47 | 699 | 681 | 175.3 |
| B | 5 | 185 | 895546 | 5697.63 | 727 | 700 | 157.1 |
| B | 5 | 172 | 770472 | 4901.26 | 727 | 700 | 157.1 |
| B | 7 | 252 | 193155 | 1225.39 | 727 | 700 | 157.1 |
| C | 4 | 12 | 4086199 | 21630.23 | 691 | 688 | 188.9 |
| C | 13 | 3 | 242139 | 1278.33 | 691 | 688 | 188.9 |
| C | 4 | 13 | 200177 | 1056.17 | 691 | 688 | 188.9 |
| D | 12 | 20 | 2825881 | 15215.63 | 658 | 636 | 185.7 |
| D | 2 | 62 | 940558 | 5062.04 | 658 | 636 | 185.7 |
| D | 3 | 12 | 353853 | 1902.28 | 658 | 636 | 185.7 |
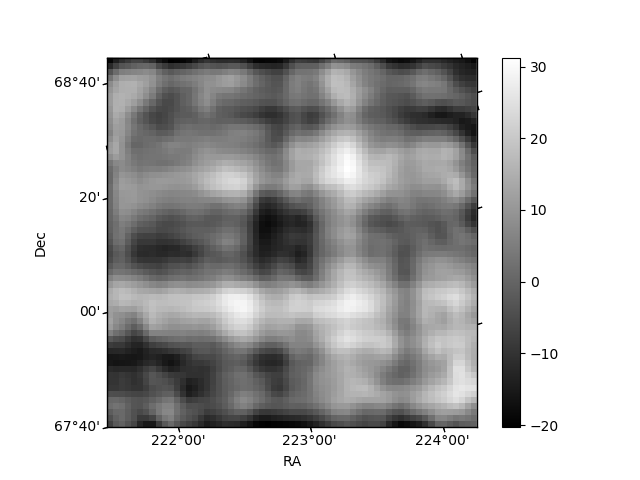
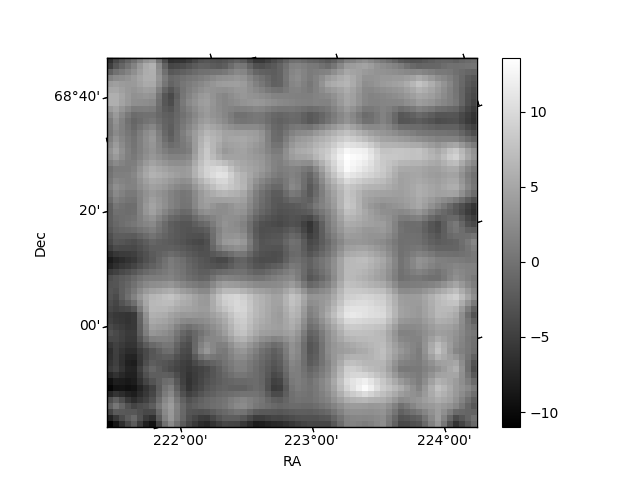
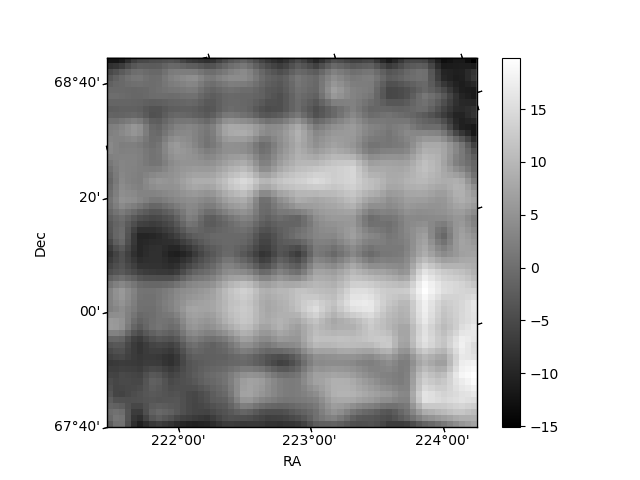
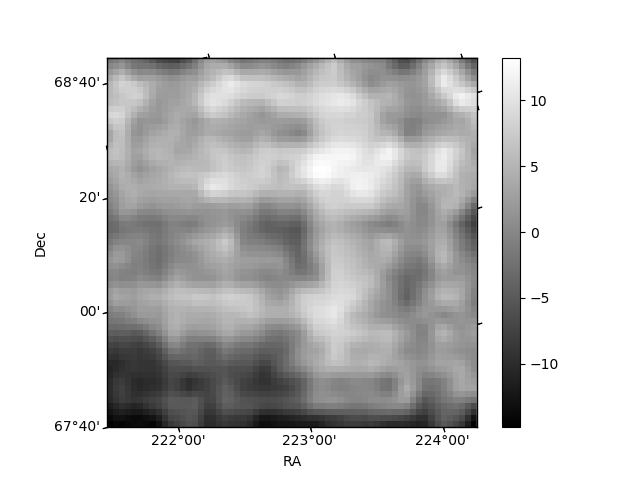
Histogram calculated using DETX and DETY for each event in the final _common_clean file
| Quadrant A | 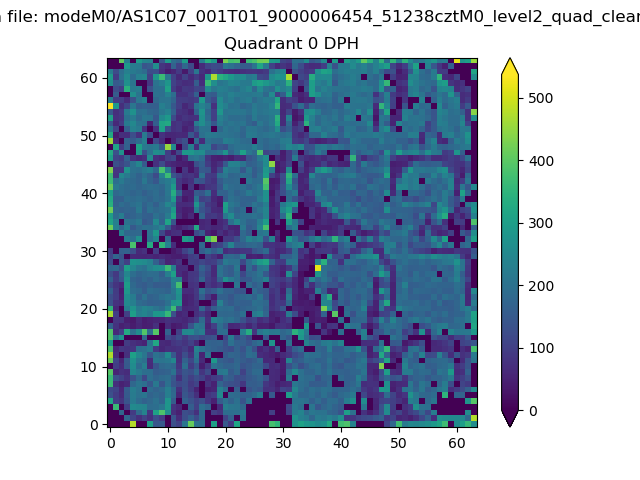 |
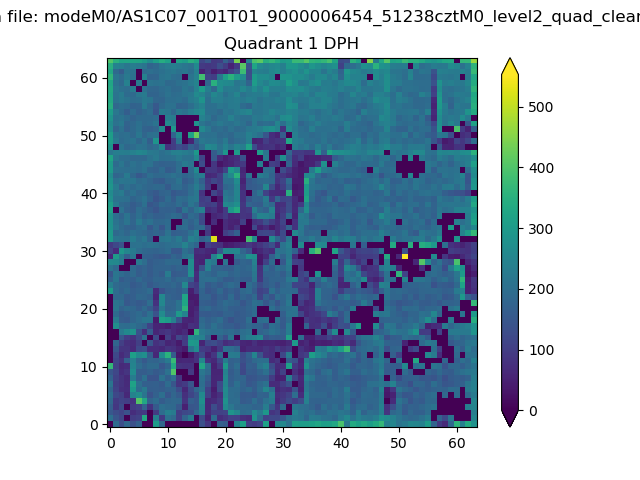 |
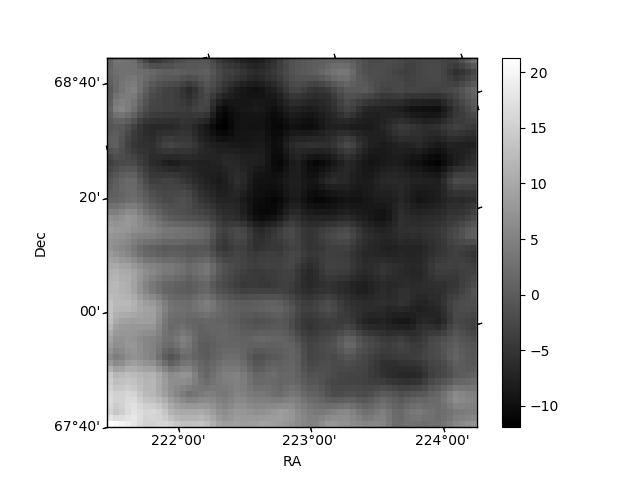
Quadrant B |
|---|---|---|---|
| Quadrant D | 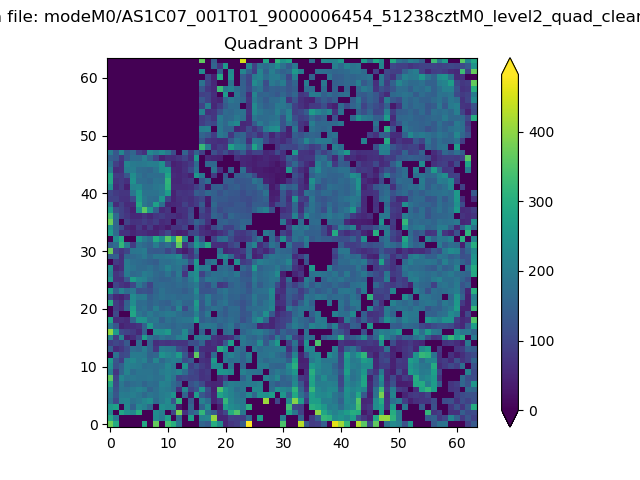 |
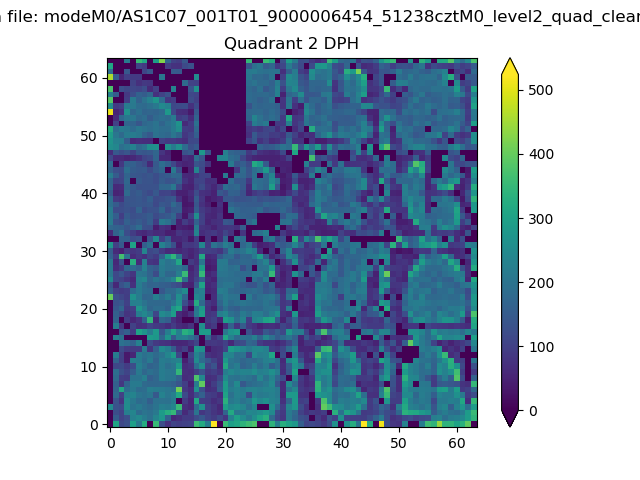 |
Quadrant C |
| Plot type | Count rate plots | Images |
|---|---|---|
| Comparison with Poisson distribution Blue bars denote a histogram of data divided into 1 sec bins. Red curve is a Poisson curve with rate = median count rate of data. |
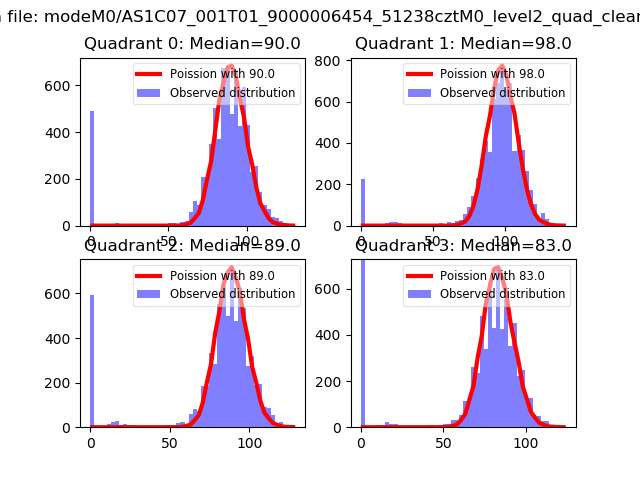 |
 |
| Quadrant-wise count rates Data is divided into 100 sec bins |
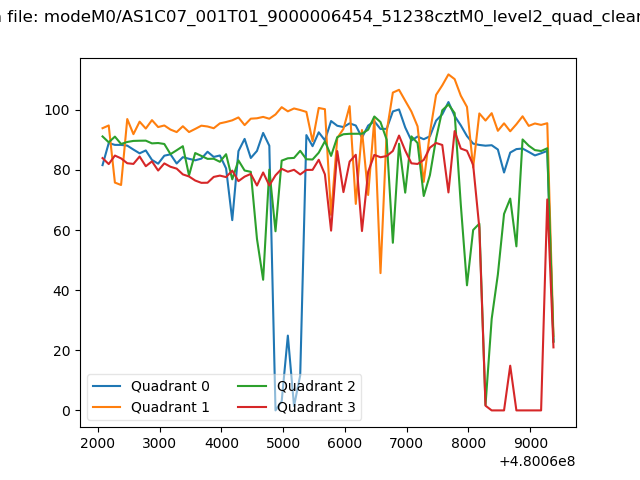 |
|
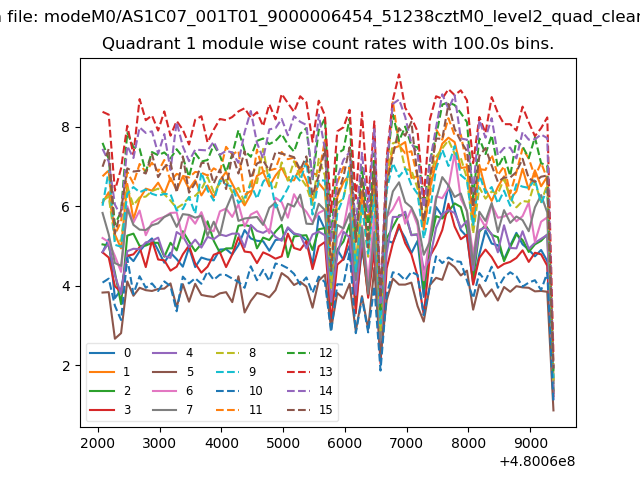
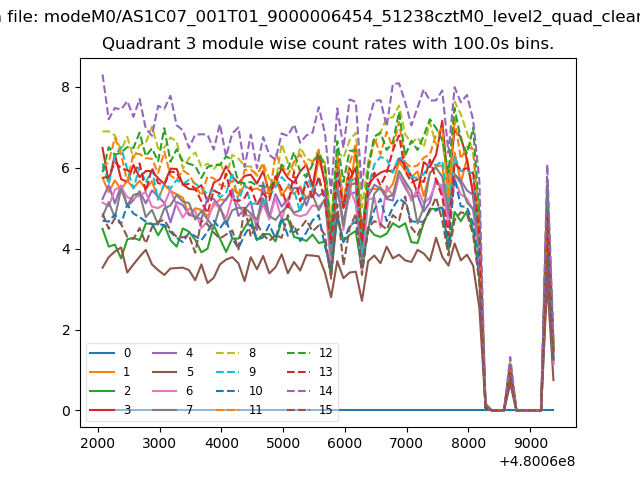
| Module-wise count rates for Quadrant A Data is divided into 100 sec bins |
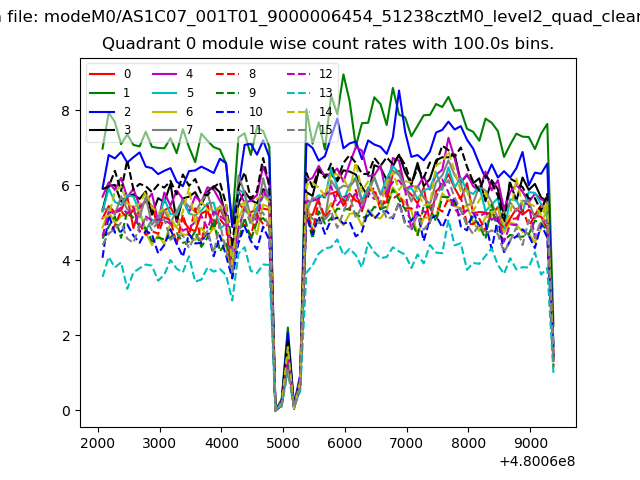 |
 |
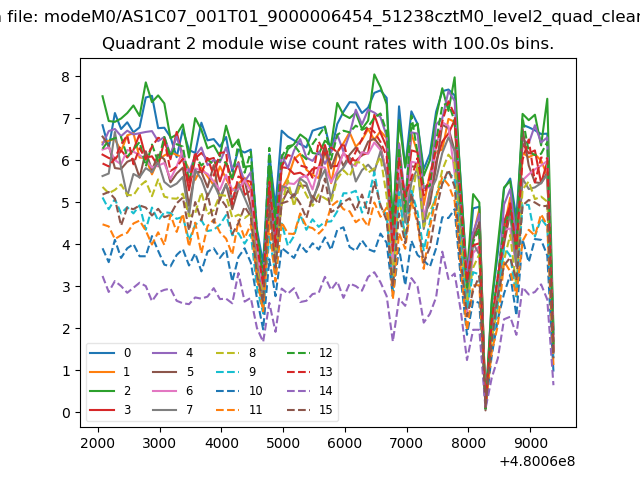
| Module-wise count rates for Quadrant B Data is divided into 100 sec bins |
 |
 |
| Module-wise count rates for Quadrant C Data is divided into 100 sec bins |
 |
 |
| Module-wise count rates for Quadrant D Data is divided into 100 sec bins |
 |
 |
| Parameter | Plot |
|---|---|
| CZT HV Monitor |  |
| D_VDD | 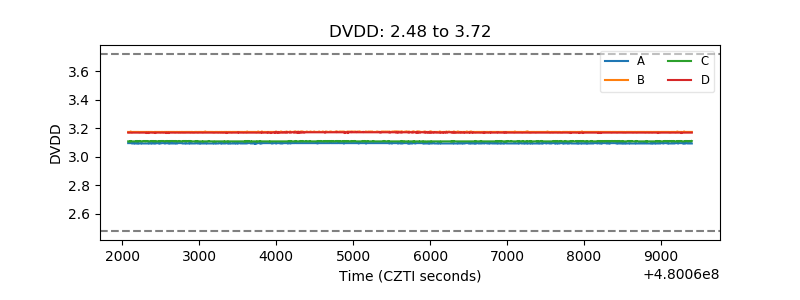 |
| Temperature 1 | 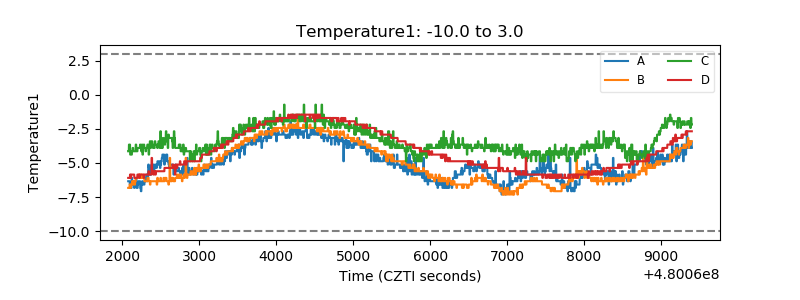 |
| Veto HV Monitor | 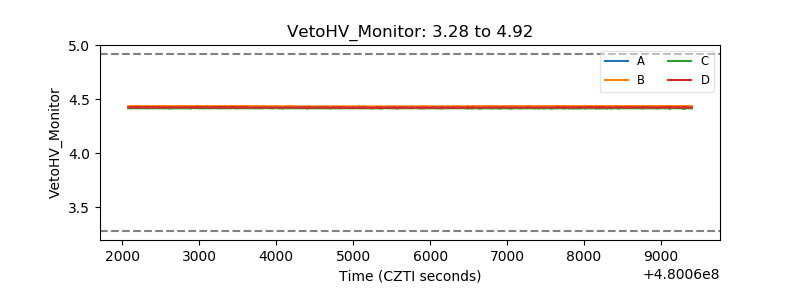 |
| Veto LLD | 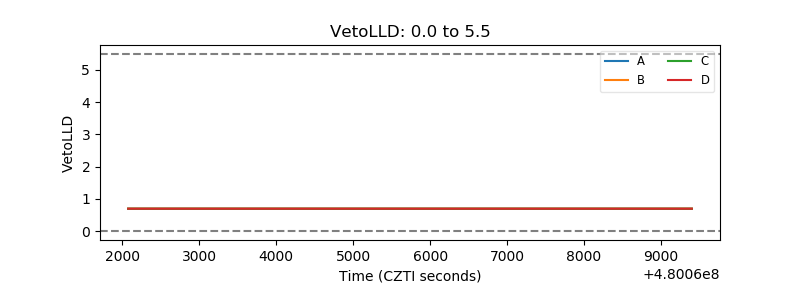 |
| Alpha Counter | 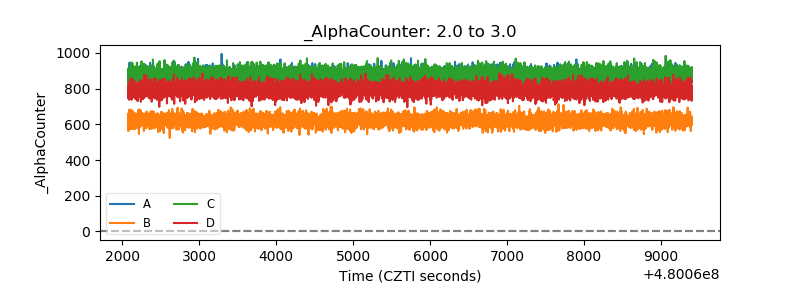 |
| _CPM_Rate | 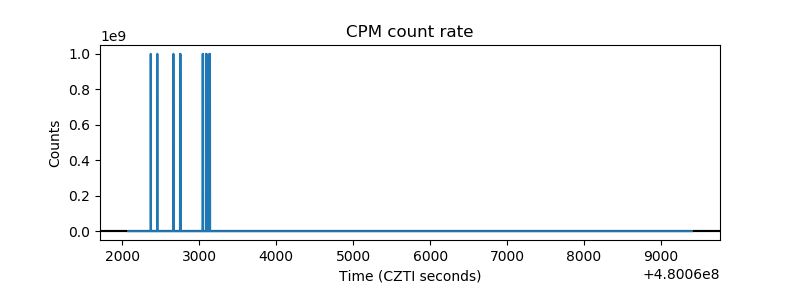 |
| CZT Counter | 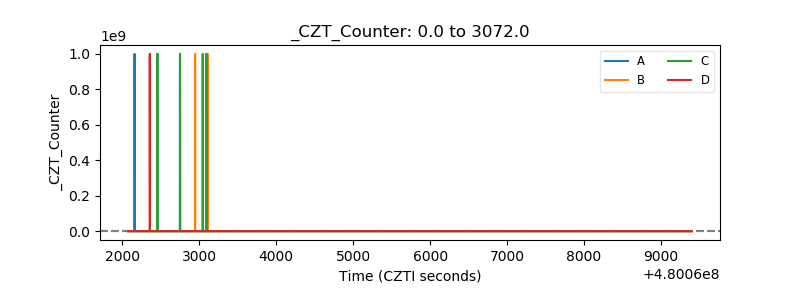 |
| +2.5 Volts monitor | 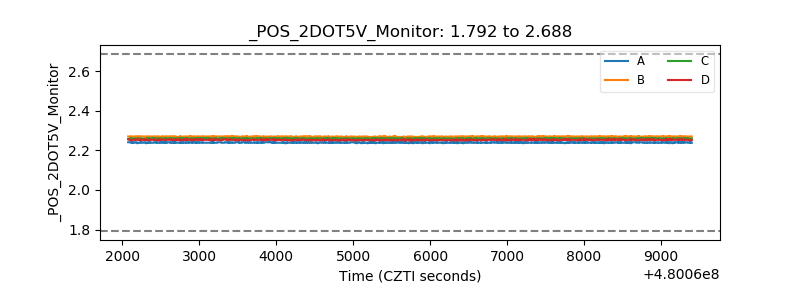 |
| +5 Volts monitor | 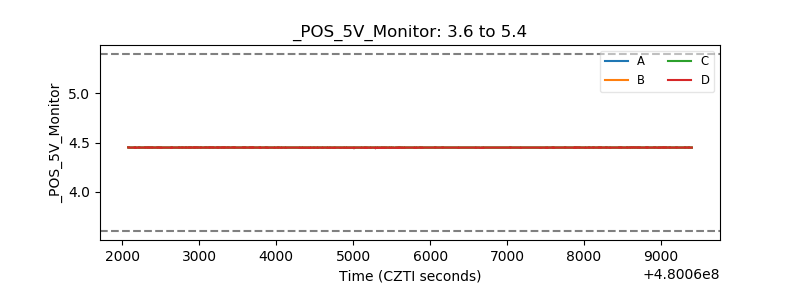 |
| _ROLL_ROT | 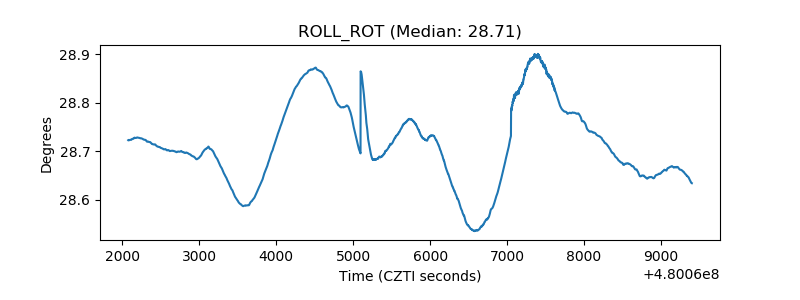 |
| _Roll_DEC | 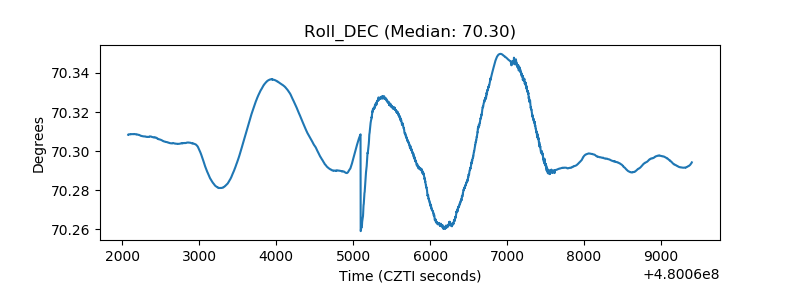 |
| _Roll_RA | 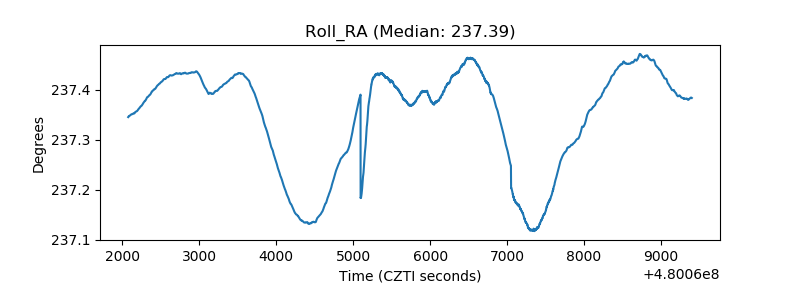 |
| Veto Counter | 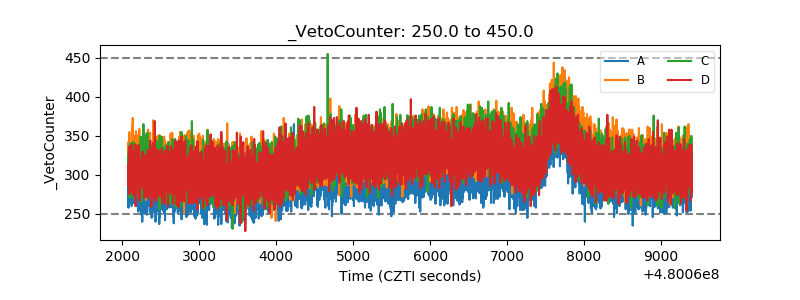 |