| Param | Original file | Final file |
|---|---|---|
| Filename | modeM0/AS1C07_001T01_9000006454_51239cztM0_level2.fits | modeM0/AS1C07_001T01_9000006454_51239cztM0_level2_quad_clean.evt |
| Size (bytes) | 736,381,440 | 91,059,840 |
| Size | 702.3 MB | 86.8 MB |
| Events in quadrant A | 4,967,249 | 608,122 |
| Events in quadrant B | 4,176,841 | 683,925 |
| Events in quadrant C | 6,727,477 | 569,149 |
| Events in quadrant D | 10,846,454 | 408,918 |
| Mode M0 | |||
|---|---|---|---|
| Quadrant | BADHDUFLAG | Total packets | Discarded packets |
| A | 0 | 19466 | 0 |
| B | 0 | 17241 | 0 |
| C | 0 | 24854 | 0 |
| D | 0 | 37163 | 5 |
| Mode SS | |||
|---|---|---|---|
| Quadrant | BADHDUFLAG | Total packets | Discarded packets |
| A | 0 | 140 | 0 |
| B | 0 | 140 | 0 |
| C | 0 | 140 | 0 |
| D | 0 | 140 | 0 |
| Quadrant | Total seconds | Saturated seconds | Saturation percentage |
|---|---|---|---|
| A | 6987 | 364 | 5.209675% |
| B | 6987 | 166 | 2.375841% |
| C | 6987 | 730 | 10.447975% |
| D | 6986 | 2310 | 33.066132% |
Noise dominated data is calculated using 1-second bins in cleaned event files. If a bin has >2000 counts, and if more than 50% of those come from <1% of pixels, then it is considered to be noise-dominated and hence unusable.
| Quadrant | # 1 sec bins | Bins with >0 counts | Bins with >2000 counts | High rate bins dominated by noise | Noise dominated (total time) | Noise dominated (detector-on time) | Marked lightcurve |
|---|---|---|---|---|---|---|---|
| A | 6987 | 6987 | 249 | 249 | 3.56% | 3.56% | 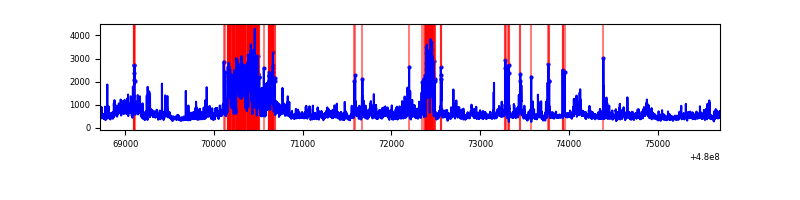 |
| B | 6987 | 6987 | 92 | 92 | 1.32% | 1.32% | 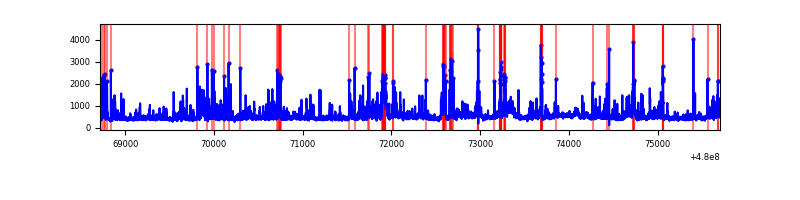 |
| C | 6987 | 6987 | 719 | 719 | 10.29% | 10.29% | 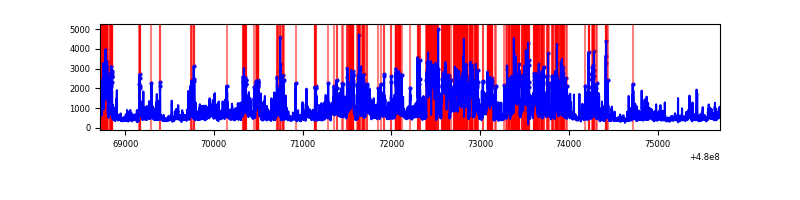 |
| D | 6986 | 6985 | 2211 | 2211 | 31.65% | 31.65% | 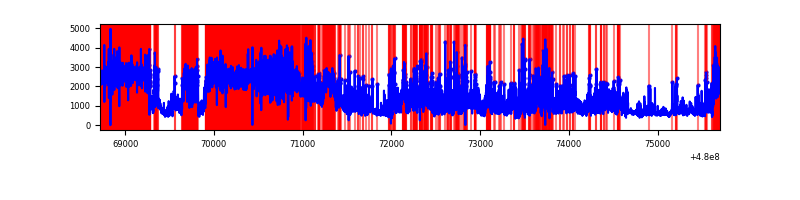 |
Top three noisy pixels from each quadrant. If the there are fewer than three noisy pixels in the level2.evt file, extra rows are filled as -1
| Pixel properties | Quadrant properties | ||||||
|---|---|---|---|---|---|---|---|
| Quadrant | DetID | PixID | Counts | Sigma | Mean | Median | Sigma |
| A | 12 | 250 | 645906 | 3691.91 | 705 | 687 | 174.8 |
| A | 12 | 3 | 456433 | 2607.75 | 705 | 687 | 174.8 |
| A | 9 | 160 | 374232 | 2137.4 | 705 | 687 | 174.8 |
| B | 7 | 252 | 300486 | 1998.51 | 710 | 686 | 150.0 |
| B | 10 | 254 | 223705 | 1486.68 | 710 | 686 | 150.0 |
| B | 5 | 185 | 174634 | 1159.56 | 710 | 686 | 150.0 |
| C | 4 | 12 | 1526198 | 8259.7 | 675 | 671 | 184.7 |
| C | 0 | 209 | 726106 | 3927.74 | 675 | 671 | 184.7 |
| C | 10 | 171 | 672984 | 3640.12 | 675 | 671 | 184.7 |
| D | 12 | 20 | 3760005 | 22951.5 | 577 | 558 | 163.8 |
| D | 2 | 62 | 2924842 | 17852.81 | 577 | 558 | 163.8 |
| D | 2 | 216 | 391775 | 2388.39 | 577 | 558 | 163.8 |
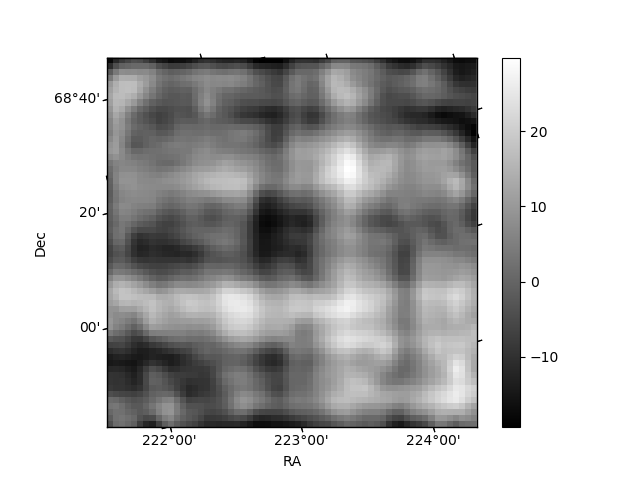
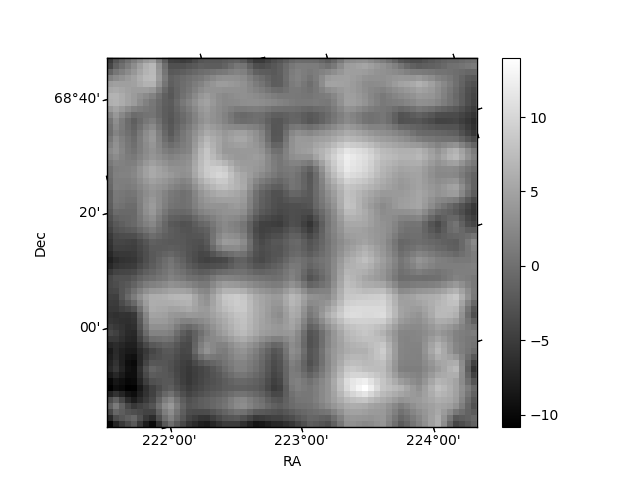
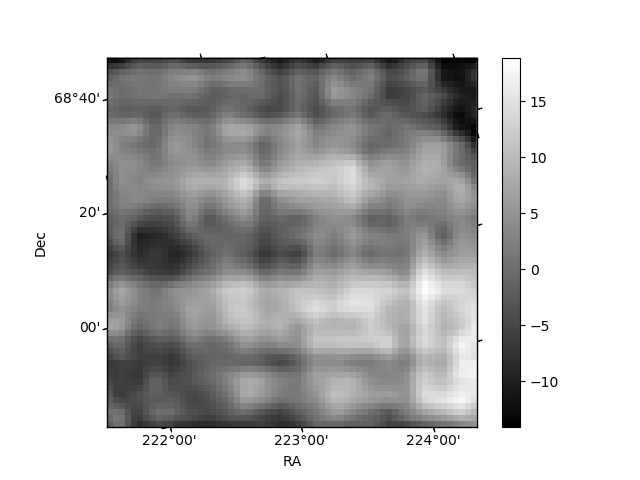
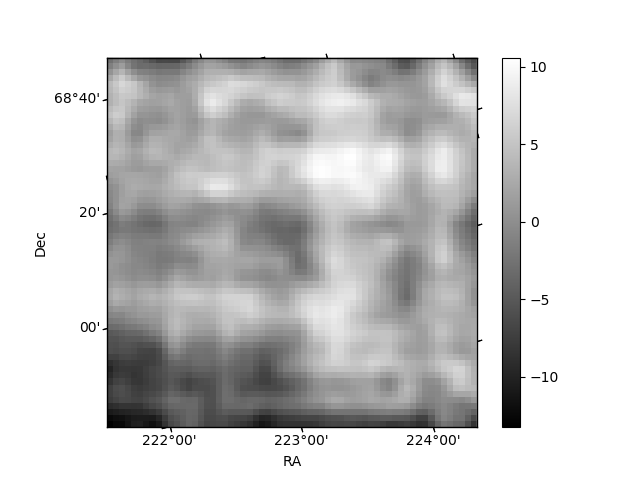
Histogram calculated using DETX and DETY for each event in the final _common_clean file
| Quadrant A | 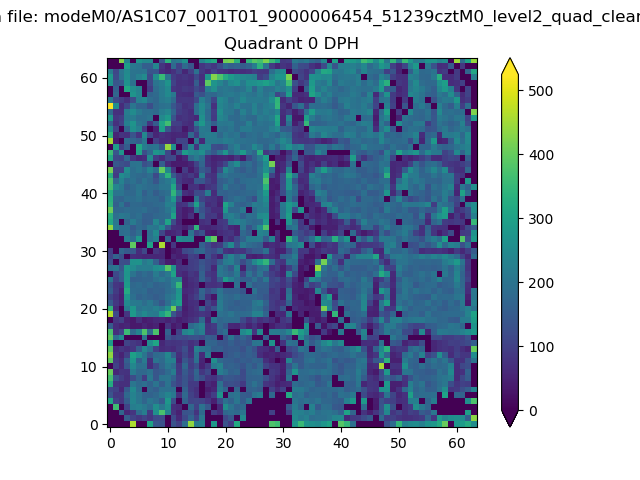 |
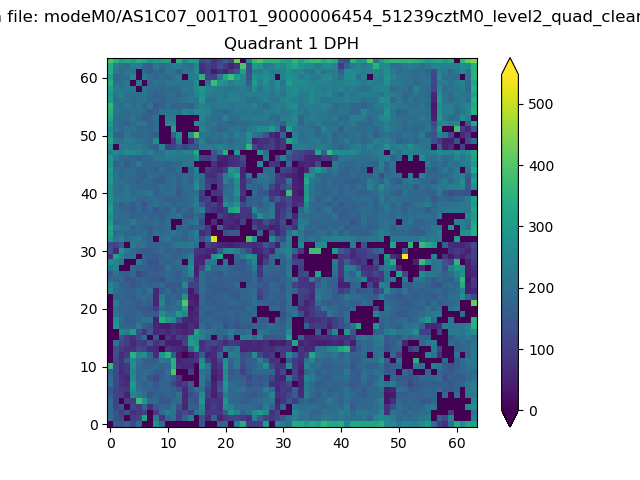 |
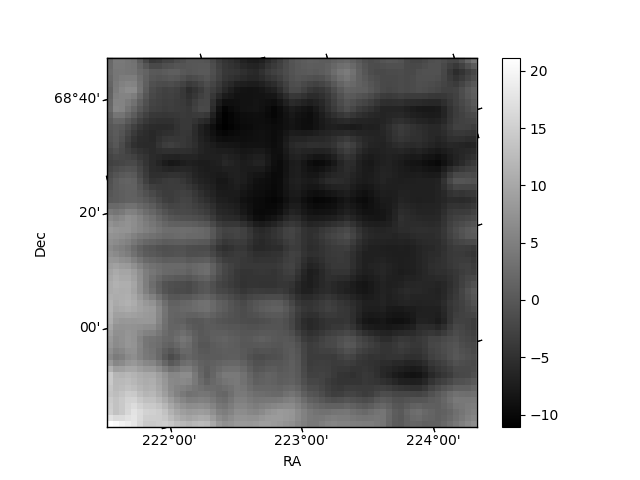
Quadrant B |
|---|---|---|---|
| Quadrant D | 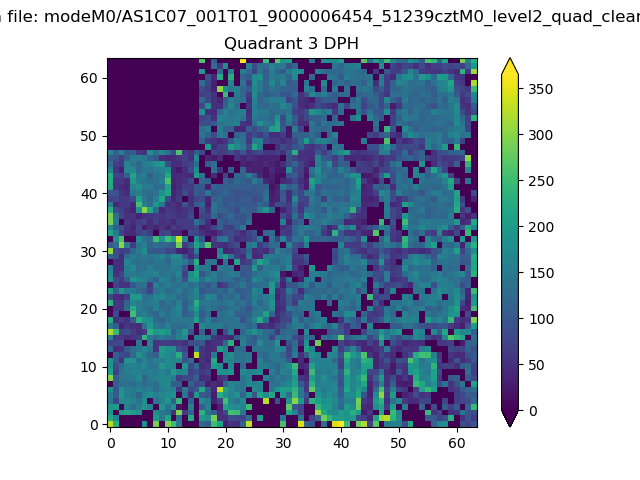 |
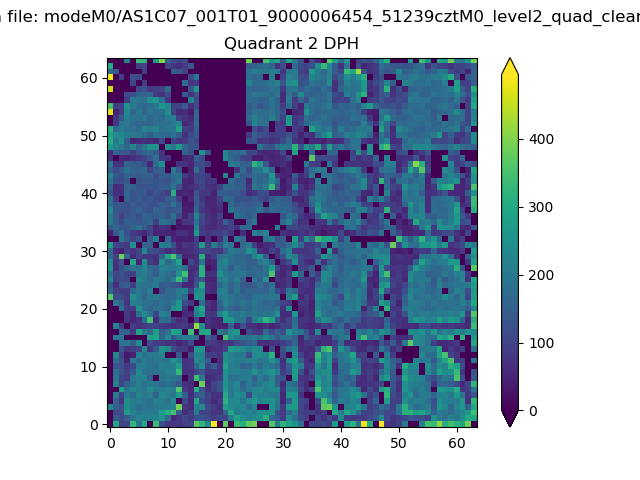 |
Quadrant C |
| Plot type | Count rate plots | Images |
|---|---|---|
| Comparison with Poisson distribution Blue bars denote a histogram of data divided into 1 sec bins. Red curve is a Poisson curve with rate = median count rate of data. |
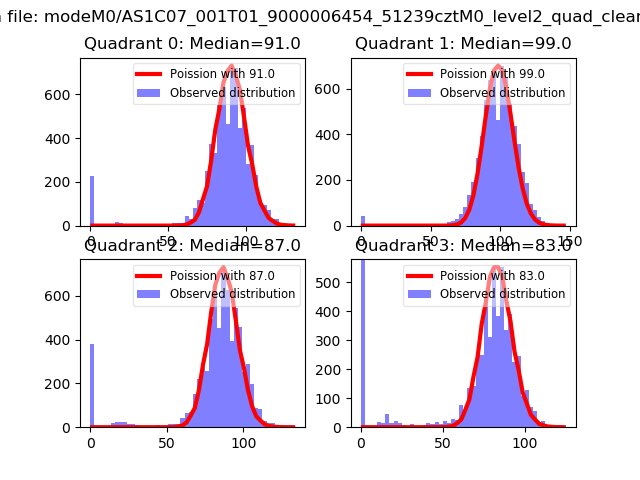 |
 |
| Quadrant-wise count rates Data is divided into 100 sec bins |
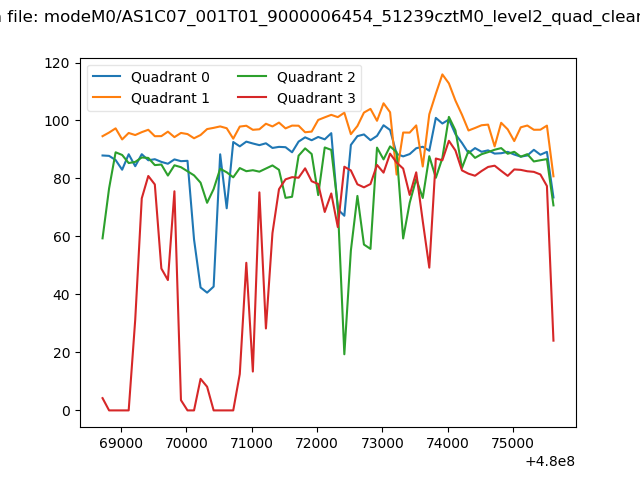 |
|
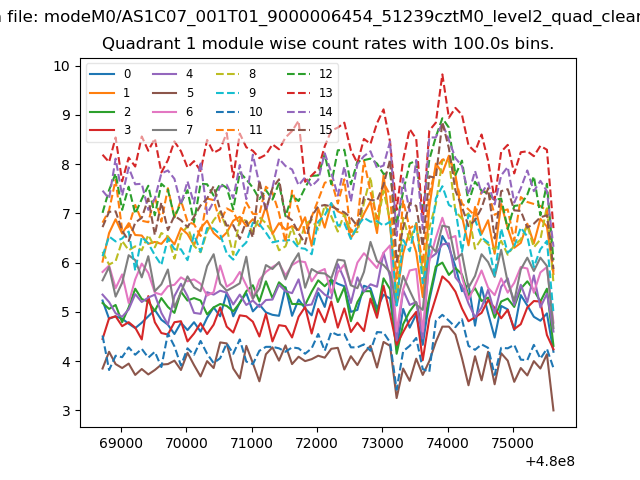
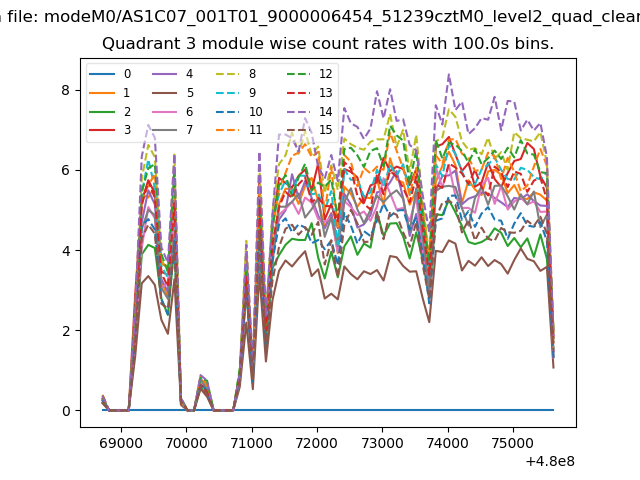
| Module-wise count rates for Quadrant A Data is divided into 100 sec bins |
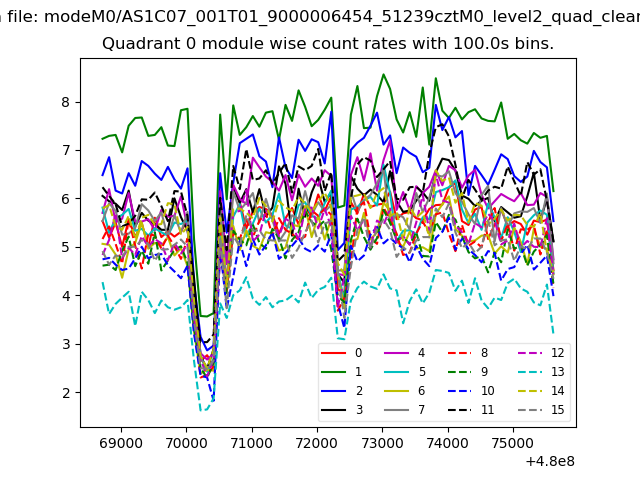 |
 |
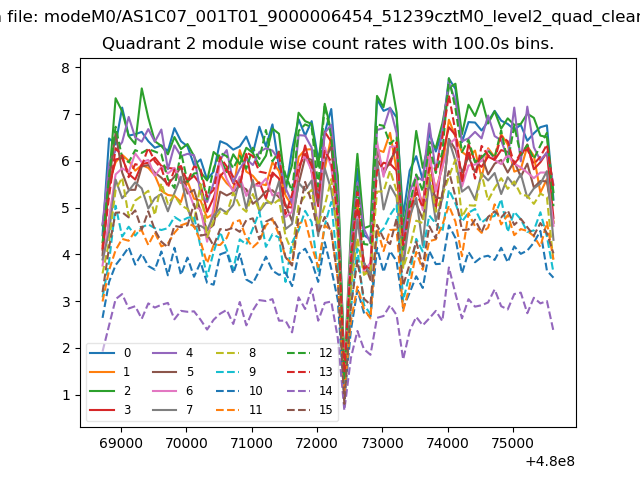
| Module-wise count rates for Quadrant B Data is divided into 100 sec bins |
 |
 |
| Module-wise count rates for Quadrant C Data is divided into 100 sec bins |
 |
 |
| Module-wise count rates for Quadrant D Data is divided into 100 sec bins |
 |
 |
| Parameter | Plot |
|---|---|
| CZT HV Monitor | 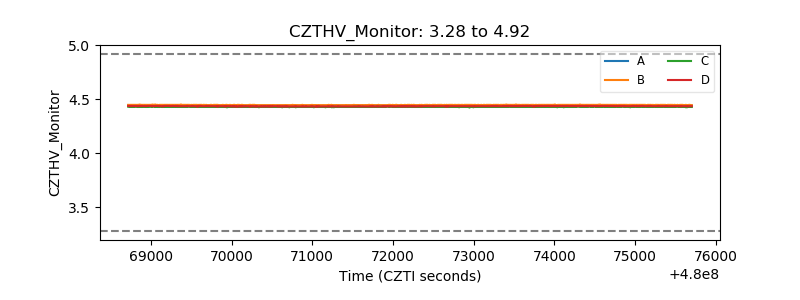 |
| D_VDD | 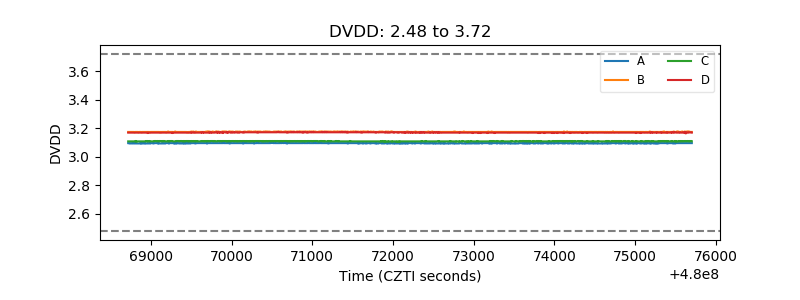 |
| Temperature 1 | 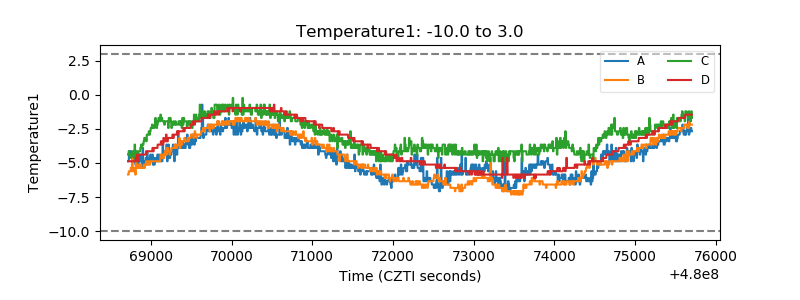 |
| Veto HV Monitor | 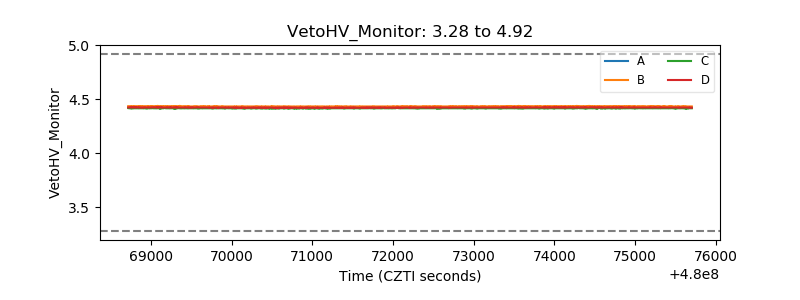 |
| Veto LLD | 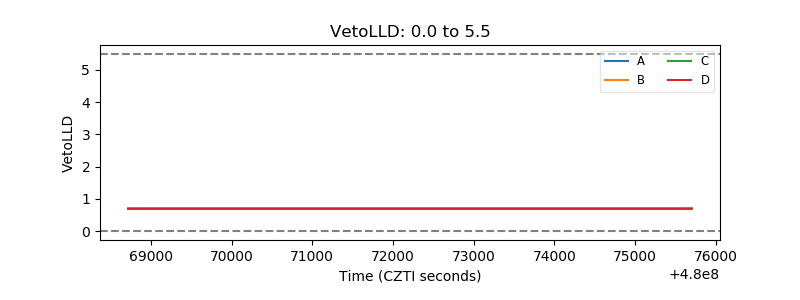 |
| Alpha Counter | 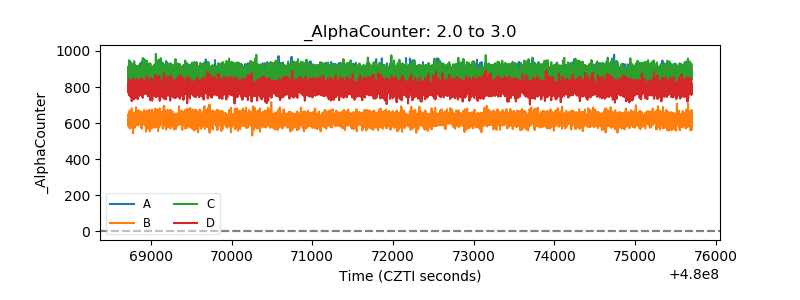 |
| _CPM_Rate | 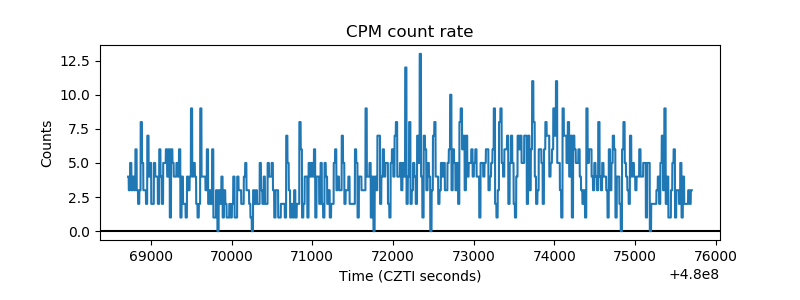 |
| CZT Counter | 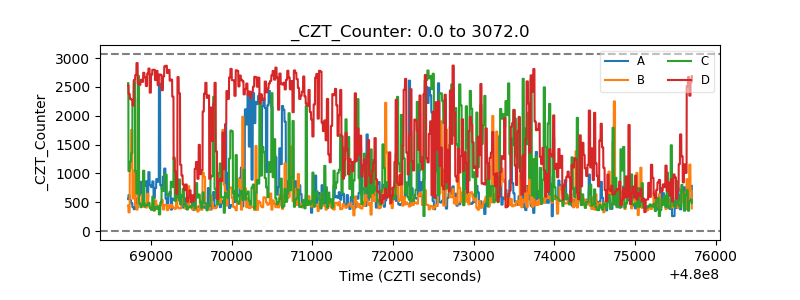 |
| +2.5 Volts monitor | 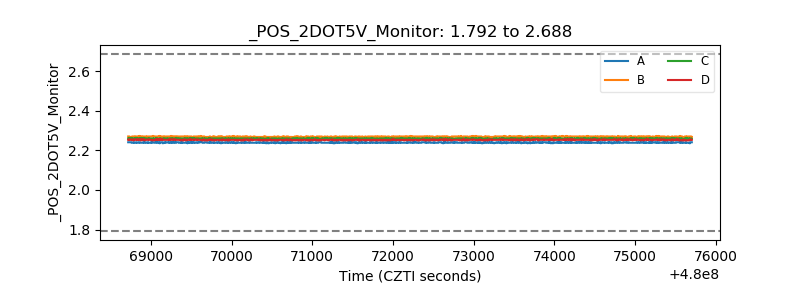 |
| +5 Volts monitor | 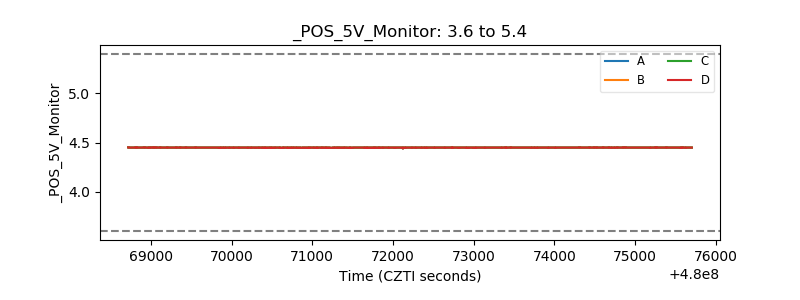 |
| _ROLL_ROT | 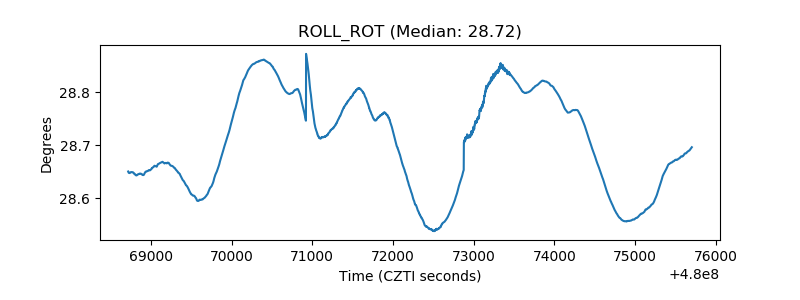 |
| _Roll_DEC | 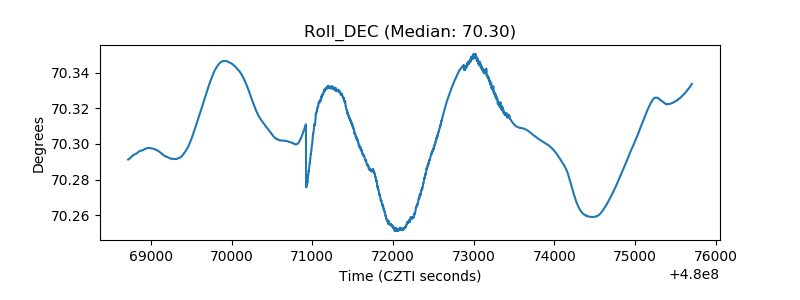 |
| _Roll_RA | 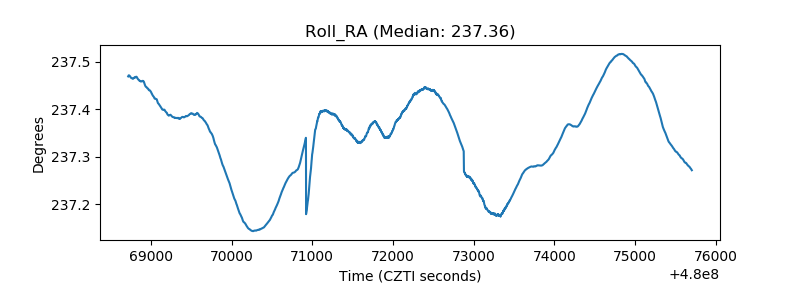 |
| Veto Counter | 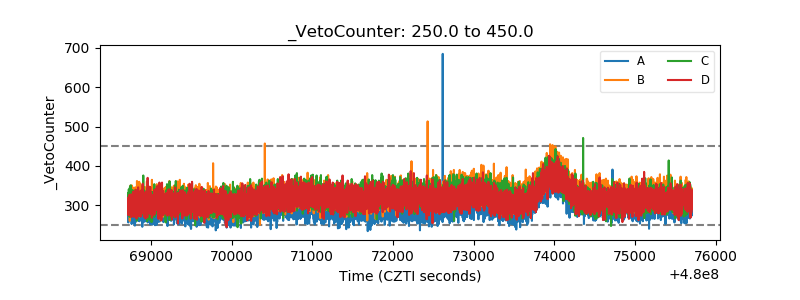 |