| Param | Original file | Final file |
|---|---|---|
| Filename | modeM0/AS1C07_001T01_9000006454_51242cztM0_level2.fits | modeM0/AS1C07_001T01_9000006454_51242cztM0_level2_quad_clean.evt |
| Size (bytes) | 1,851,209,280 | 250,447,680 |
| Size | 1.7 GB | 238.8 MB |
| Events in quadrant A | 13,156,690 | 1,677,878 |
| Events in quadrant B | 10,752,918 | 1,865,560 |
| Events in quadrant C | 22,822,064 | 1,363,040 |
| Events in quadrant D | 20,316,021 | 1,354,312 |
| Mode M0 | |||
|---|---|---|---|
| Quadrant | BADHDUFLAG | Total packets | Discarded packets |
| A | 0 | 52112 | 2 |
| B | 0 | 45249 | 2 |
| C | 0 | 81117 | 2 |
| D | 0 | 73785 | 2 |
| Mode SS | |||
|---|---|---|---|
| Quadrant | BADHDUFLAG | Total packets | Discarded packets |
| A | 0 | 386 | 0 |
| B | 0 | 386 | 0 |
| C | 0 | 386 | 0 |
| D | 0 | 386 | 0 |
| Mode M9 | |||
|---|---|---|---|
| Quadrant | BADHDUFLAG | Total packets | Discarded packets |
| A | 0 | 10 | 0 |
| B | 0 | 10 | 0 |
| C | 0 | 10 | 0 |
| D | 0 | 10 | 0 |
| Quadrant | Total seconds | Saturated seconds | Saturation percentage |
|---|---|---|---|
| A | 19173 | 881 | 4.595003% |
| B | 19173 | 599 | 3.124185% |
| C | 19173 | 3877 | 20.221144% |
| D | 19173 | 2906 | 15.156731% |
Noise dominated data is calculated using 1-second bins in cleaned event files. If a bin has >2000 counts, and if more than 50% of those come from <1% of pixels, then it is considered to be noise-dominated and hence unusable.
| Quadrant | # 1 sec bins | Bins with >0 counts | Bins with >2000 counts | High rate bins dominated by noise | Noise dominated (total time) | Noise dominated (detector-on time) | Marked lightcurve |
|---|---|---|---|---|---|---|---|
| A | 20153 | 19175 | 412 | 412 | 2.04% | 2.15% | 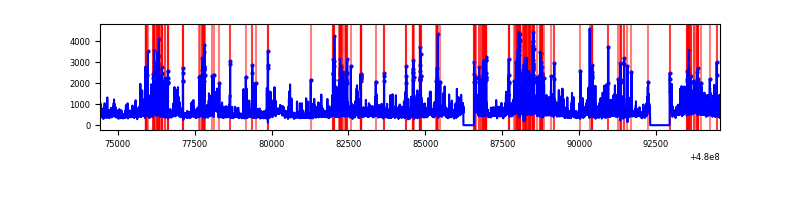 |
| B | 20153 | 19175 | 208 | 208 | 1.03% | 1.08% | 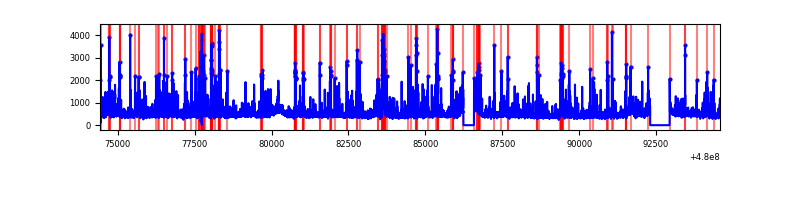 |
| C | 20153 | 19175 | 3326 | 3326 | 16.50% | 17.35% | 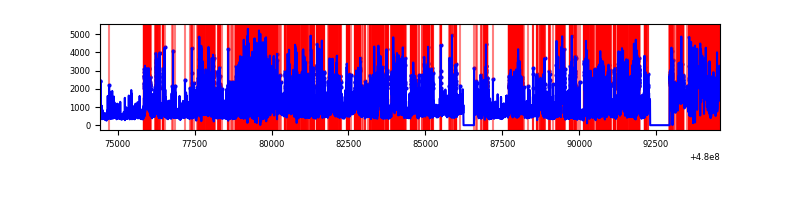 |
| D | 20153 | 19175 | 2617 | 2617 | 12.99% | 13.65% | 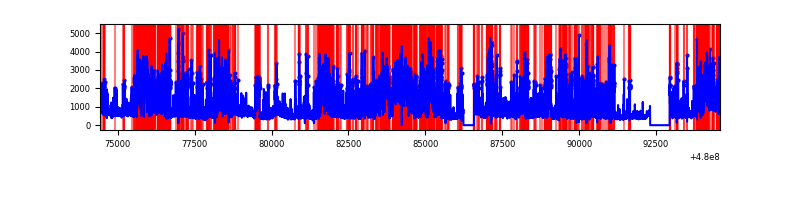 |
Top three noisy pixels from each quadrant. If the there are fewer than three noisy pixels in the level2.evt file, extra rows are filled as -1
| Pixel properties | Quadrant properties | ||||||
|---|---|---|---|---|---|---|---|
| Quadrant | DetID | PixID | Counts | Sigma | Mean | Median | Sigma |
| A | 12 | 3 | 1649867 | 3368.43 | 1992 | 1944 | 489.2 |
| A | 12 | 250 | 1046054 | 2134.21 | 1992 | 1944 | 489.2 |
| A | 9 | 160 | 604604 | 1231.87 | 1992 | 1944 | 489.2 |
| B | 7 | 252 | 772559 | 1831.19 | 1995 | 1924 | 420.8 |
| B | 4 | 171 | 347125 | 820.27 | 1995 | 1924 | 420.8 |
| B | 8 | 234 | 184693 | 434.3 | 1995 | 1924 | 420.8 |
| C | 4 | 12 | 9888711 | 19985.19 | 1809 | 1795 | 494.7 |
| C | 0 | 209 | 1375518 | 2776.81 | 1809 | 1795 | 494.7 |
| C | 4 | 13 | 1046223 | 2111.18 | 1809 | 1795 | 494.7 |
| D | 7 | 60 | 3204287 | 6226.71 | 1834 | 1771 | 514.3 |
| D | 2 | 62 | 1933418 | 3755.74 | 1834 | 1771 | 514.3 |
| D | 6 | 42 | 1514021 | 2940.29 | 1834 | 1771 | 514.3 |
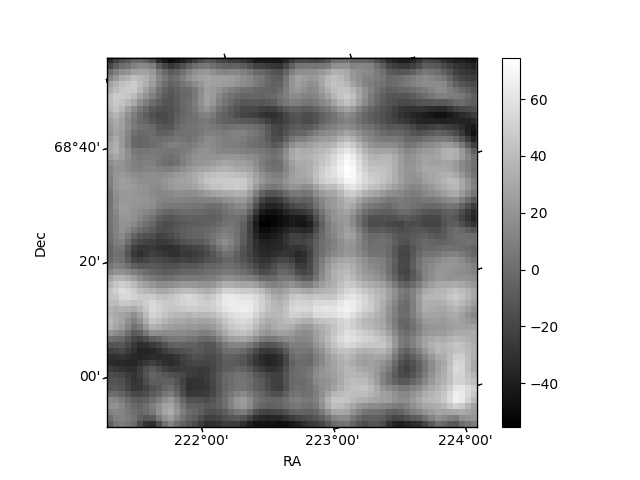
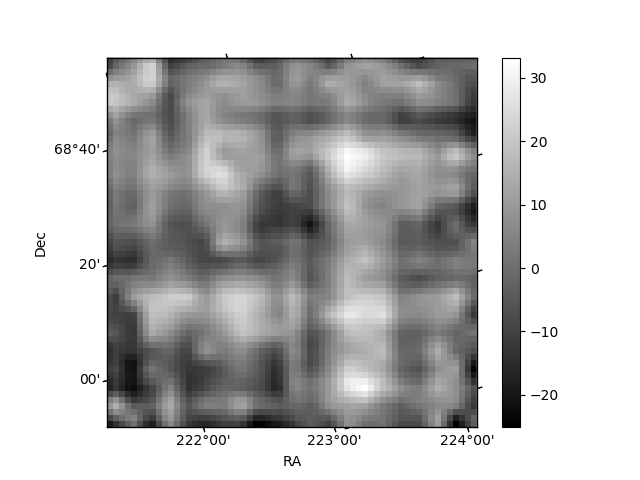
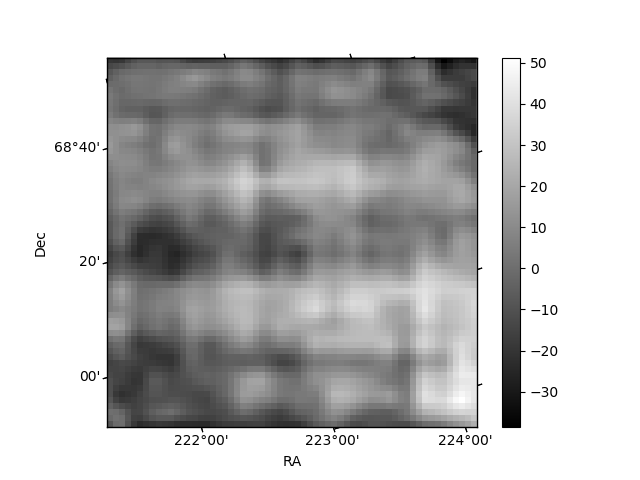
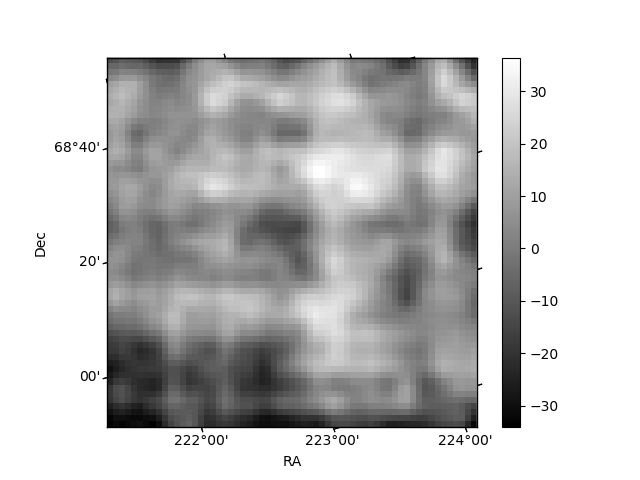
Histogram calculated using DETX and DETY for each event in the final _common_clean file
| Quadrant A | 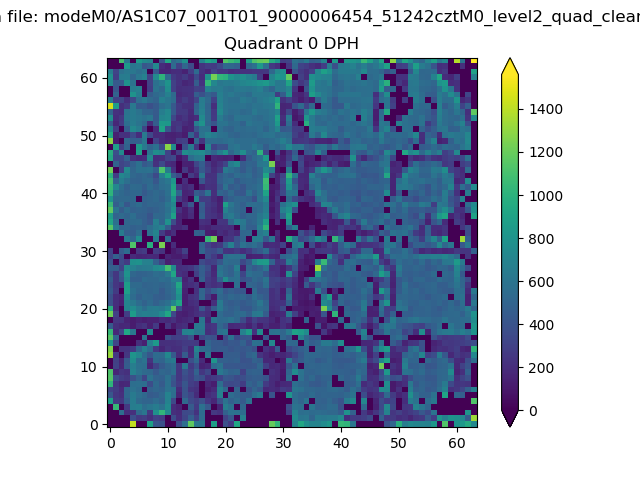 |
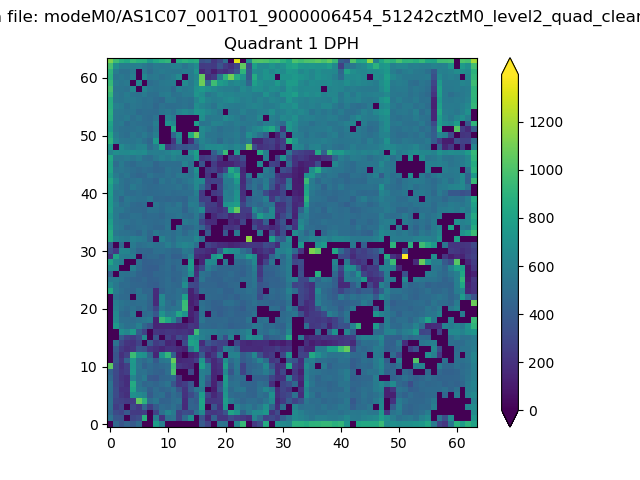 |
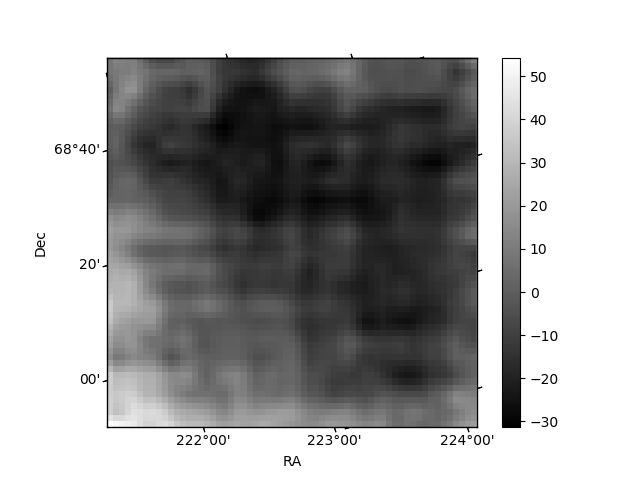
Quadrant B |
|---|---|---|---|
| Quadrant D | 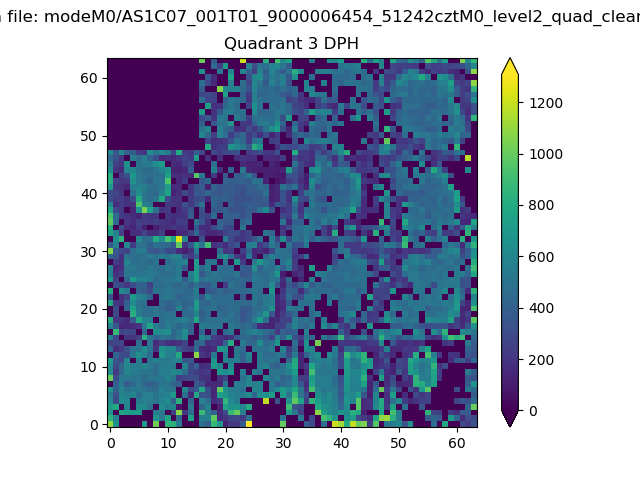 |
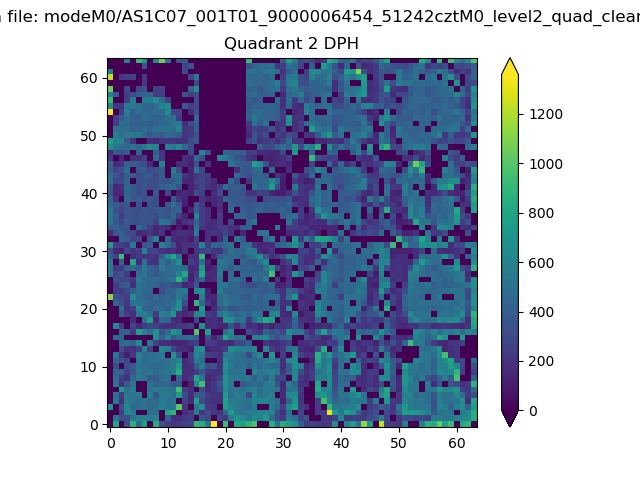 |
Quadrant C |
| Plot type | Count rate plots | Images |
|---|---|---|
| Comparison with Poisson distribution Blue bars denote a histogram of data divided into 1 sec bins. Red curve is a Poisson curve with rate = median count rate of data. |
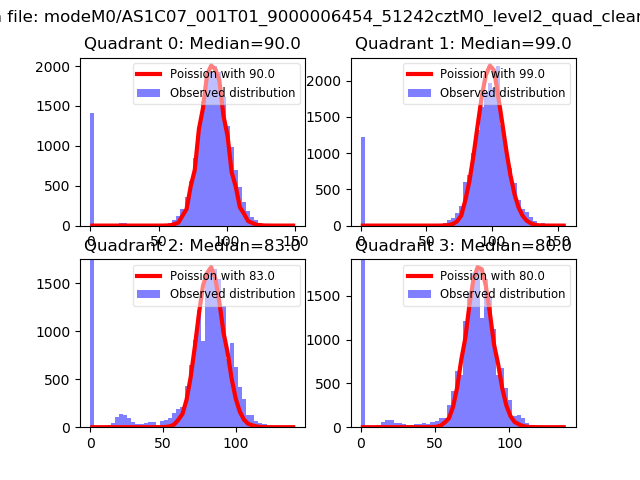 |
 |
| Quadrant-wise count rates Data is divided into 100 sec bins |
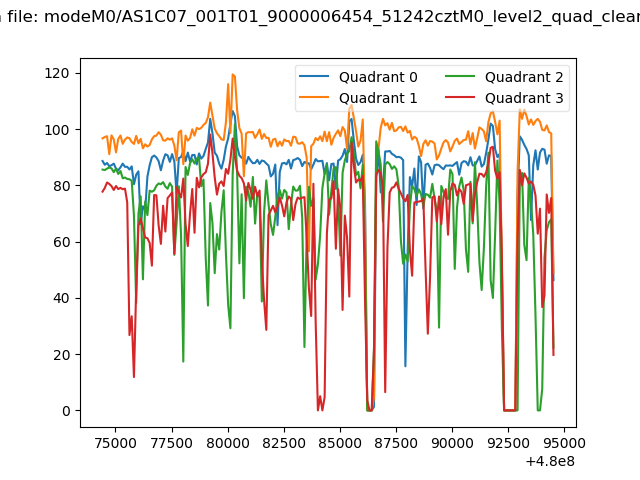 |
|
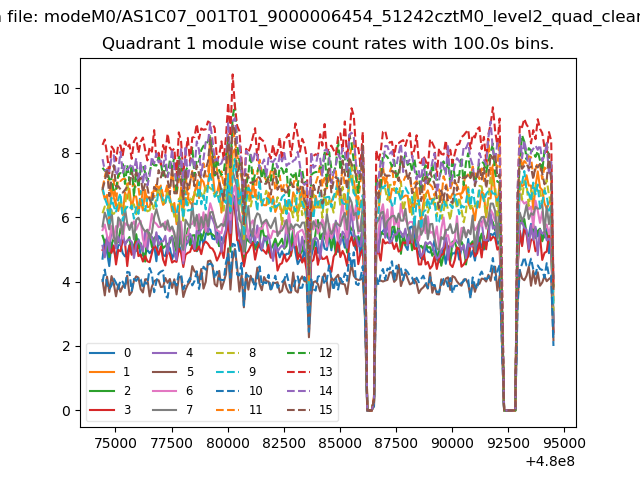
| Module-wise count rates for Quadrant A Data is divided into 100 sec bins |
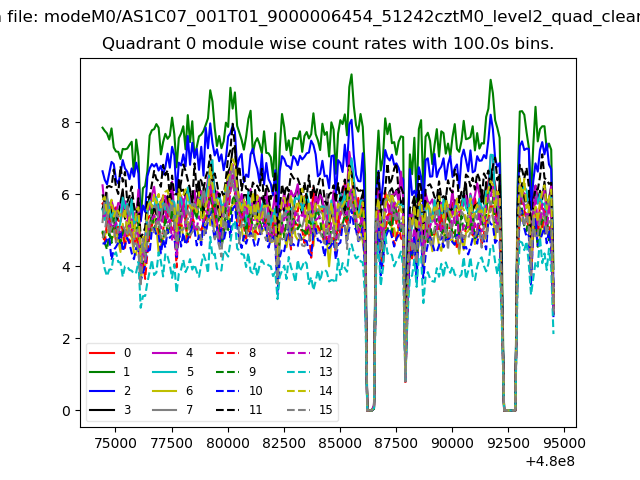 |
 |
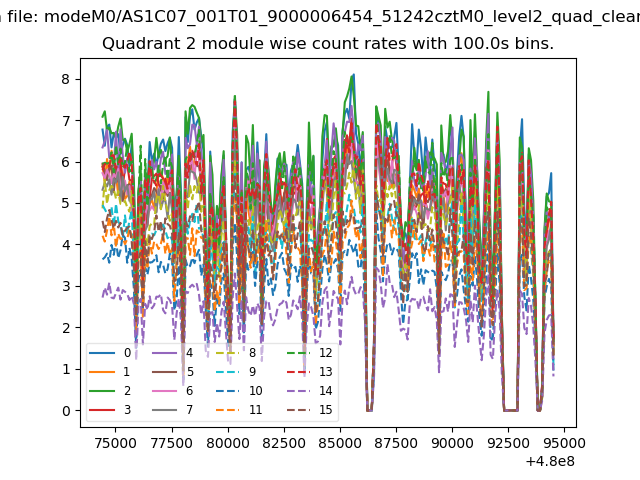
| Module-wise count rates for Quadrant B Data is divided into 100 sec bins |
 |
 |
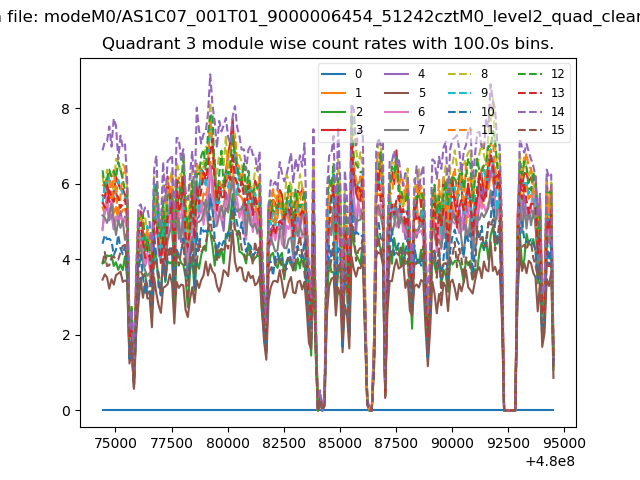
| Module-wise count rates for Quadrant C Data is divided into 100 sec bins |
 |
 |
| Module-wise count rates for Quadrant D Data is divided into 100 sec bins |
 |
 |
| Parameter | Plot |
|---|---|
| CZT HV Monitor | 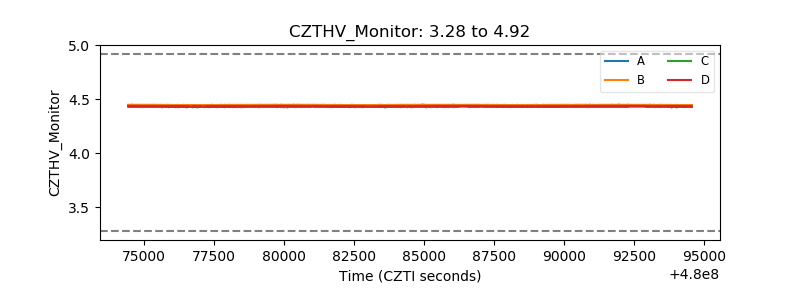 |
| D_VDD | 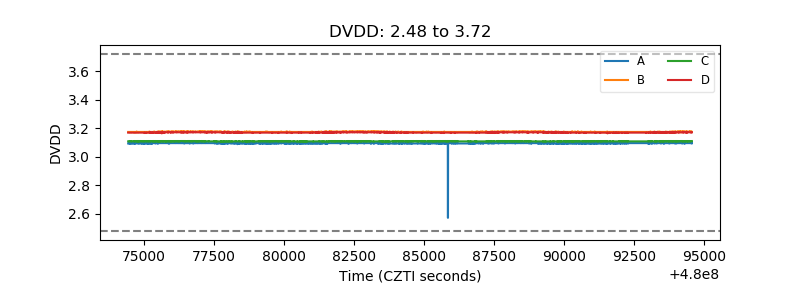 |
| Temperature 1 | 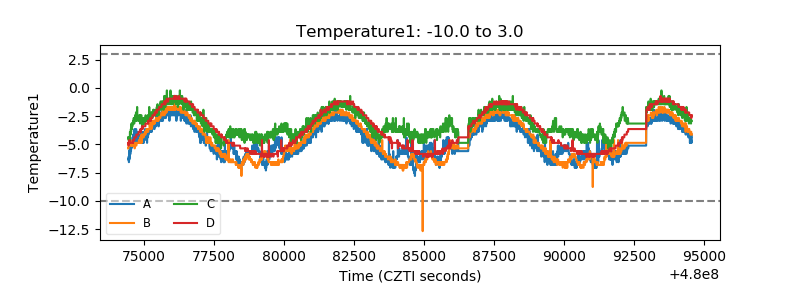 |
| Veto HV Monitor | 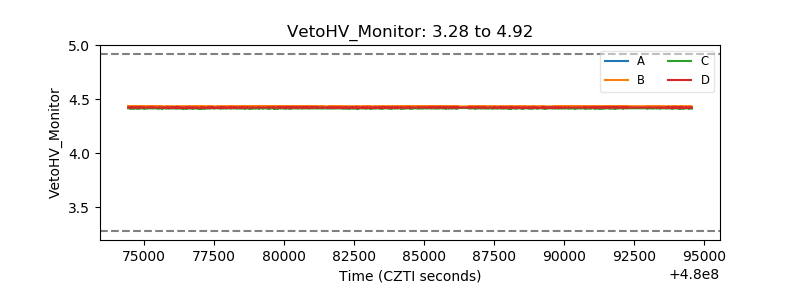 |
| Veto LLD | 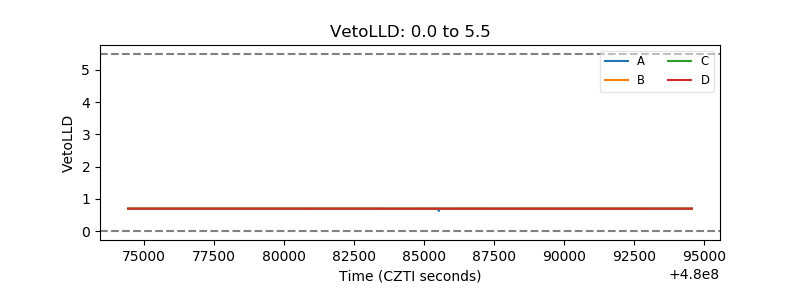 |
| Alpha Counter | 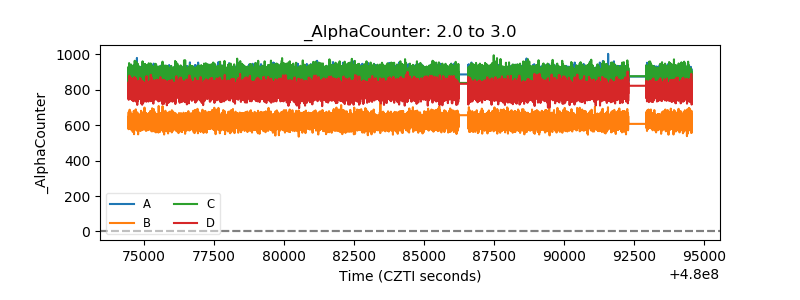 |
| _CPM_Rate | 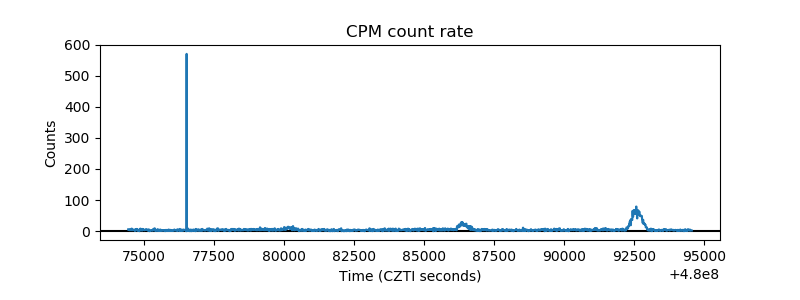 |
| CZT Counter | 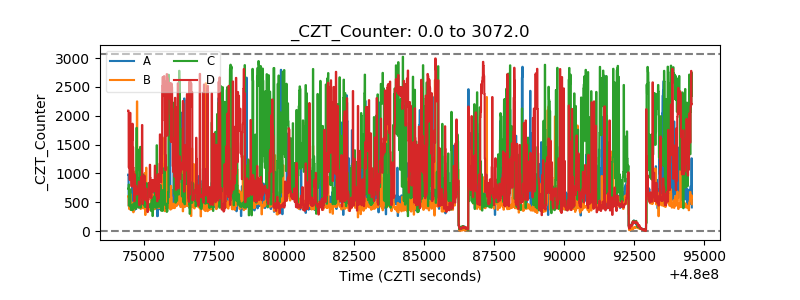 |
| +2.5 Volts monitor | 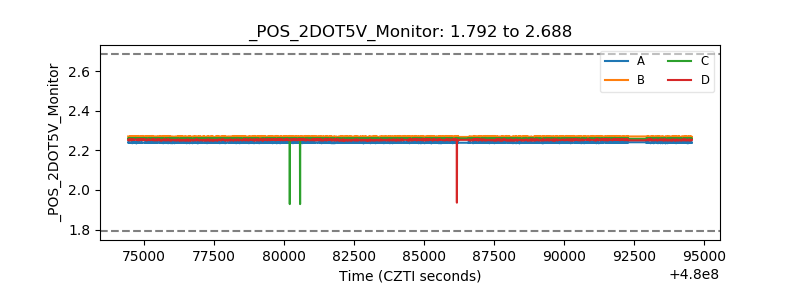 |
| +5 Volts monitor | 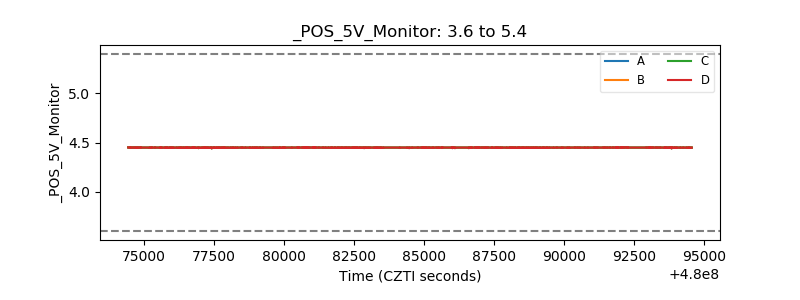 |
| _ROLL_ROT | 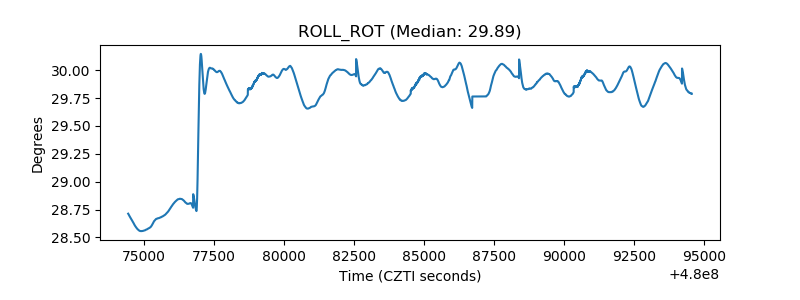 |
| _Roll_DEC | 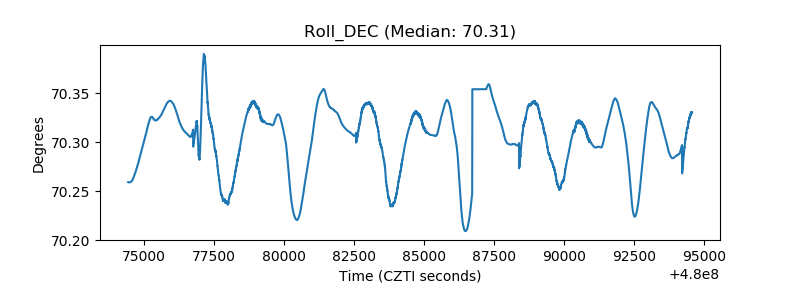 |
| _Roll_RA | 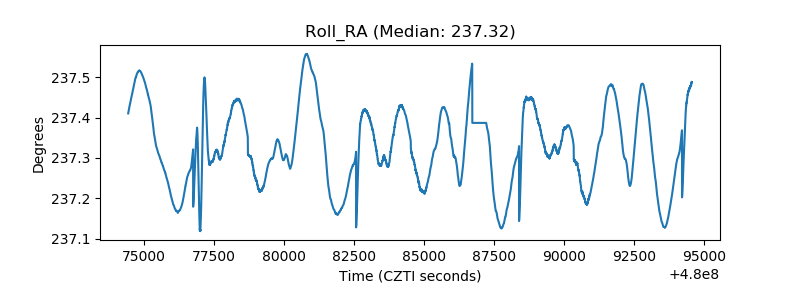 |
| Veto Counter | 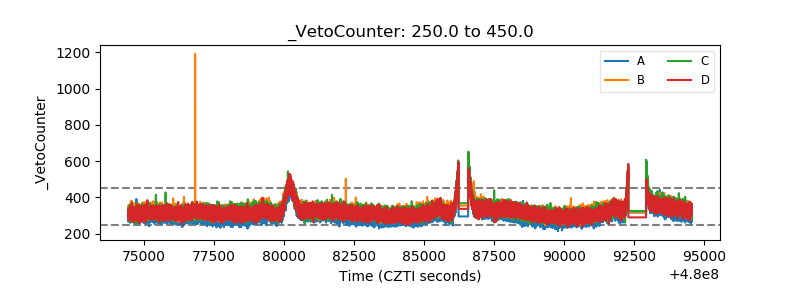 |