| Param | Original file | Final file |
|---|---|---|
| Filename | modeM0/AS1C07_001T01_9000006454_51243cztM0_level2.fits | modeM0/AS1C07_001T01_9000006454_51243cztM0_level2_quad_clean.evt |
| Size (bytes) | 728,366,400 | 77,342,400 |
| Size | 694.6 MB | 73.8 MB |
| Events in quadrant A | 4,941,357 | 554,212 |
| Events in quadrant B | 3,584,429 | 611,017 |
| Events in quadrant C | 12,470,826 | 263,766 |
| Events in quadrant D | 5,483,879 | 479,291 |
| Mode M0 | |||
|---|---|---|---|
| Quadrant | BADHDUFLAG | Total packets | Discarded packets |
| A | 0 | 19032 | 1 |
| B | 0 | 14935 | 1 |
| C | 0 | 41265 | 4 |
| D | 0 | 20717 | 1 |
| Mode SS | |||
|---|---|---|---|
| Quadrant | BADHDUFLAG | Total packets | Discarded packets |
| A | 0 | 124 | 0 |
| B | 0 | 124 | 0 |
| C | 0 | 124 | 0 |
| D | 0 | 124 | 0 |
| Mode M9 | |||
|---|---|---|---|
| Quadrant | BADHDUFLAG | Total packets | Discarded packets |
| A | 0 | 9 | 0 |
| B | 0 | 9 | 0 |
| C | 0 | 9 | 0 |
| D | 0 | 9 | 0 |
| Quadrant | Total seconds | Saturated seconds | Saturation percentage |
|---|---|---|---|
| A | 6213 | 229 | 3.685820% |
| B | 6214 | 167 | 2.687480% |
| C | 6213 | 3619 | 58.248833% |
| D | 6213 | 663 | 10.671173% |
Noise dominated data is calculated using 1-second bins in cleaned event files. If a bin has >2000 counts, and if more than 50% of those come from <1% of pixels, then it is considered to be noise-dominated and hence unusable.
| Quadrant | # 1 sec bins | Bins with >0 counts | Bins with >2000 counts | High rate bins dominated by noise | Noise dominated (total time) | Noise dominated (detector-on time) | Marked lightcurve |
|---|---|---|---|---|---|---|---|
| A | 7063 | 6214 | 117 | 117 | 1.66% | 1.88% | 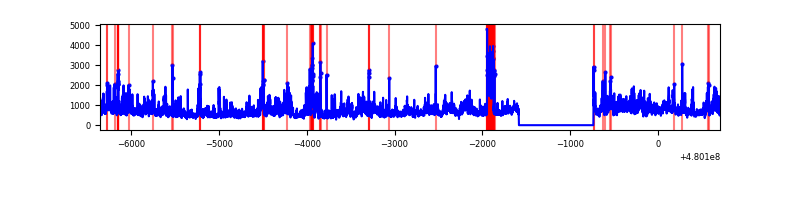 |
| B | 7064 | 6215 | 81 | 81 | 1.15% | 1.30% | 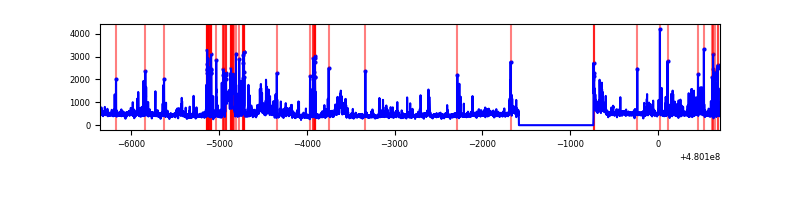 |
| C | 7062 | 6213 | 3447 | 3447 | 48.81% | 55.48% | 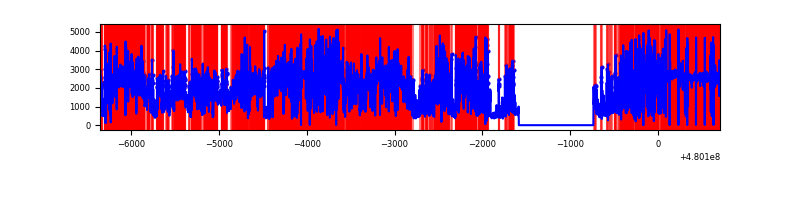 |
| D | 7063 | 6214 | 523 | 523 | 7.40% | 8.42% | 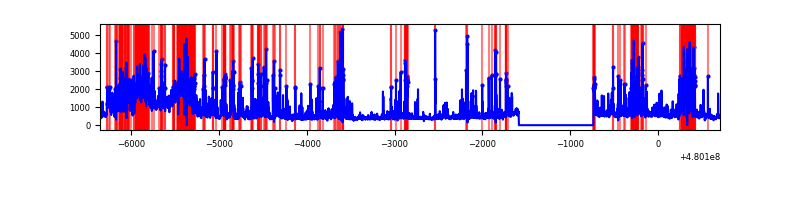 |
Top three noisy pixels from each quadrant. If the there are fewer than three noisy pixels in the level2.evt file, extra rows are filled as -1
| Pixel properties | Quadrant properties | ||||||
|---|---|---|---|---|---|---|---|
| Quadrant | DetID | PixID | Counts | Sigma | Mean | Median | Sigma |
| A | 12 | 3 | 1311286 | 8163.42 | 642 | 625 | 160.6 |
| A | 9 | 160 | 273929 | 1702.27 | 642 | 625 | 160.6 |
| A | 11 | 12 | 173018 | 1073.75 | 642 | 625 | 160.6 |
| B | 10 | 254 | 194954 | 1419.86 | 643 | 620 | 136.9 |
| B | 2 | 249 | 120769 | 877.84 | 643 | 620 | 136.9 |
| B | 10 | 14 | 100813 | 732.04 | 643 | 620 | 136.9 |
| C | 4 | 12 | 10170317 | 85301.49 | 433 | 429 | 119.2 |
| C | 0 | 145 | 103500 | 864.52 | 433 | 429 | 119.2 |
| C | 13 | 3 | 85640 | 714.72 | 433 | 429 | 119.2 |
| D | 3 | 12 | 1014832 | 5890.93 | 607 | 585 | 172.2 |
| D | 8 | 176 | 413401 | 2397.71 | 607 | 585 | 172.2 |
| D | 2 | 216 | 342101 | 1983.59 | 607 | 585 | 172.2 |
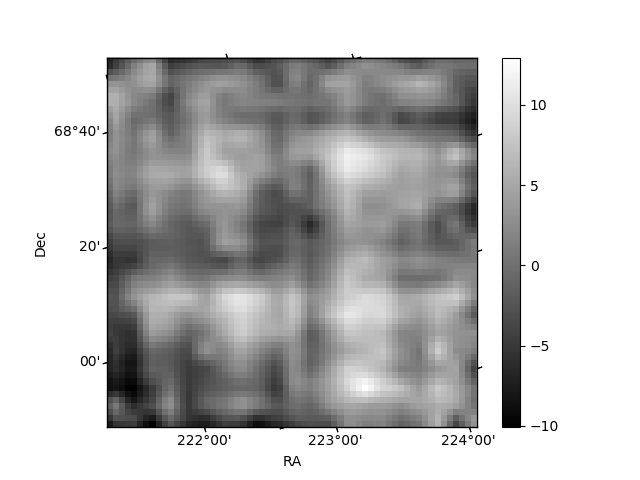
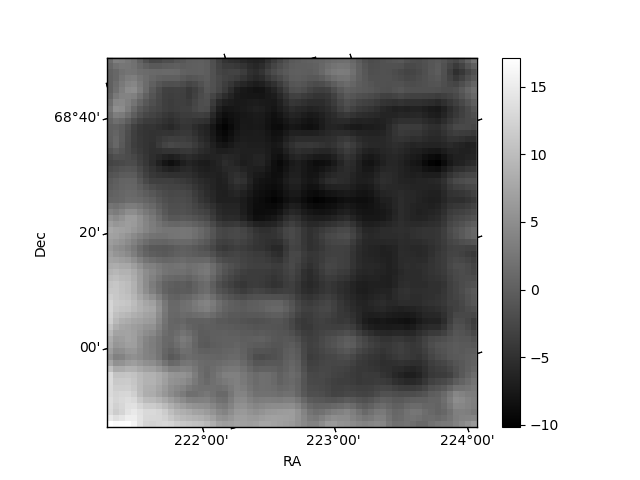
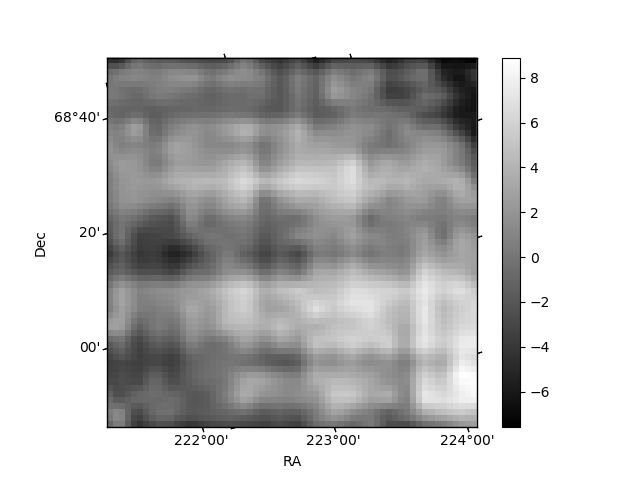
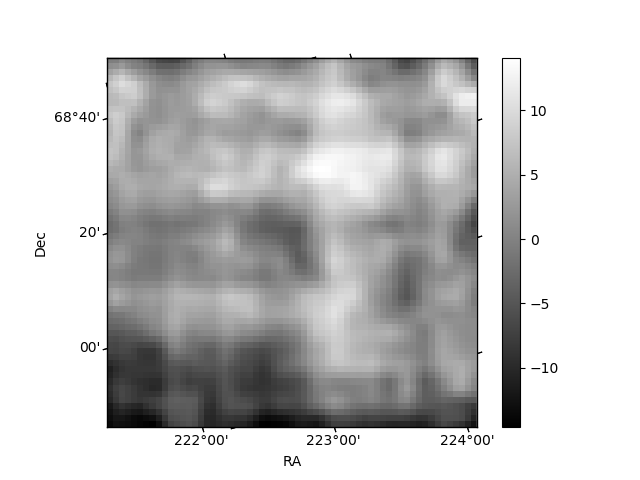
Histogram calculated using DETX and DETY for each event in the final _common_clean file
| Quadrant A | 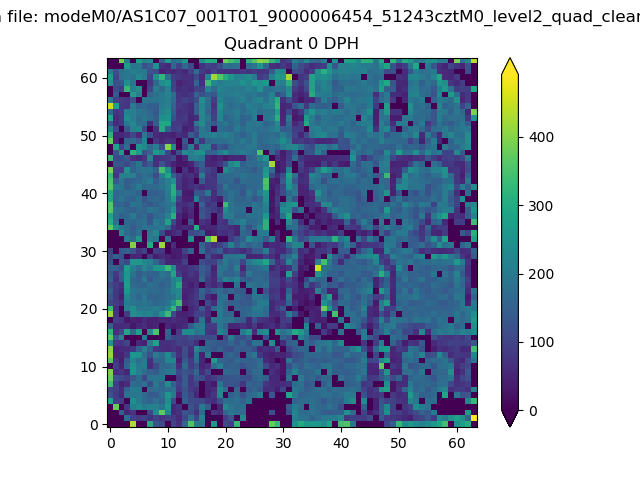 |
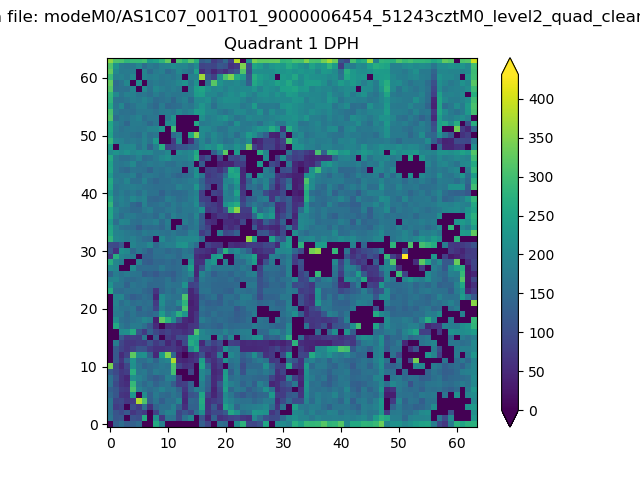 |
Quadrant B |
|---|---|---|---|
| Quadrant D | 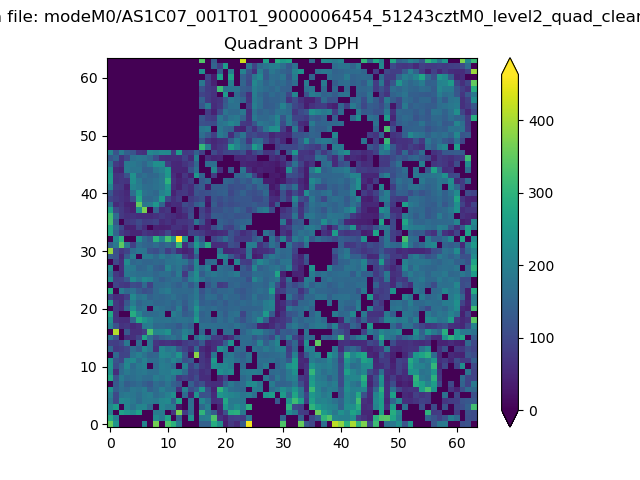 |
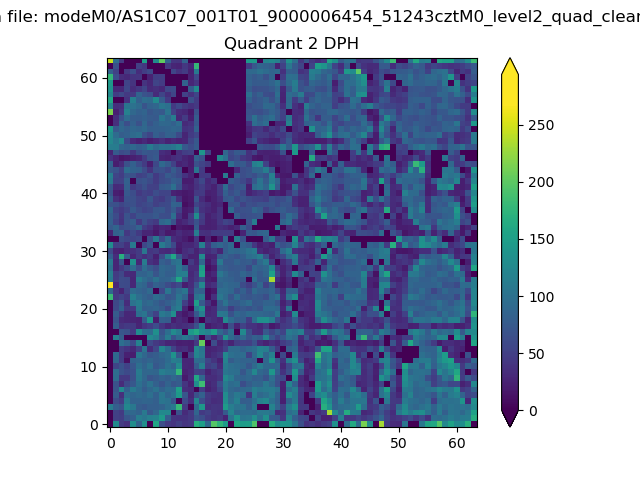 |
Quadrant C |
| Plot type | Count rate plots | Images |
|---|---|---|
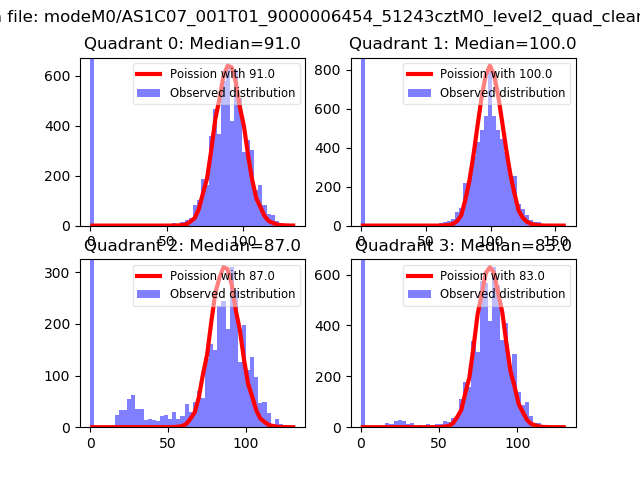
| Comparison with Poisson distribution Blue bars denote a histogram of data divided into 1 sec bins. Red curve is a Poisson curve with rate = median count rate of data. |
 |
 |
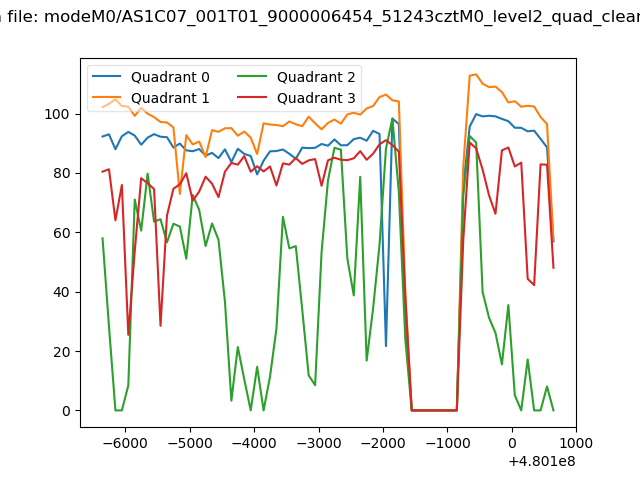
| Quadrant-wise count rates Data is divided into 100 sec bins |
 |
|
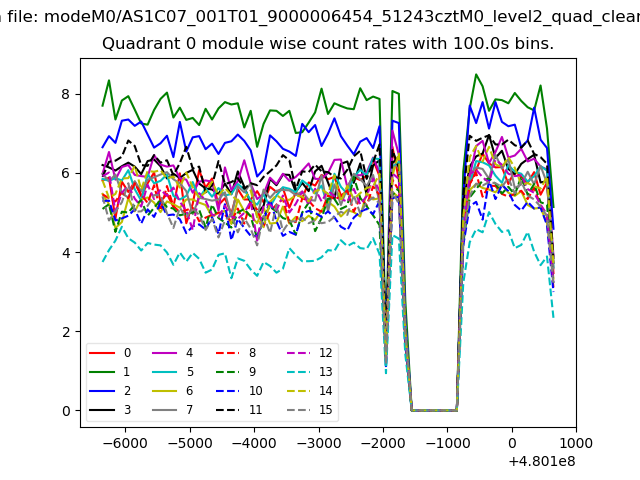
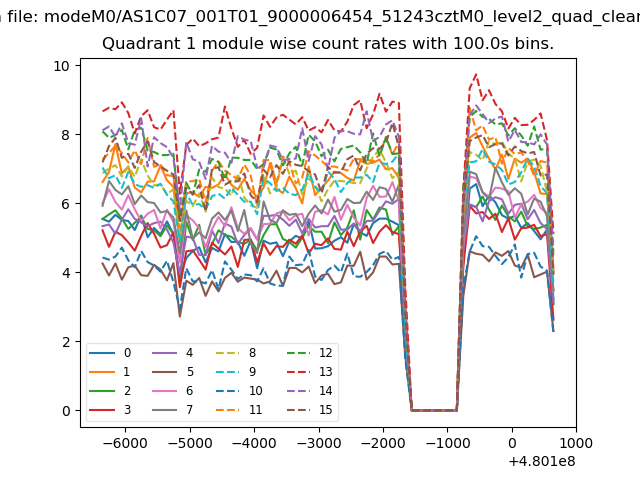
| Module-wise count rates for Quadrant A Data is divided into 100 sec bins |
 |
 |
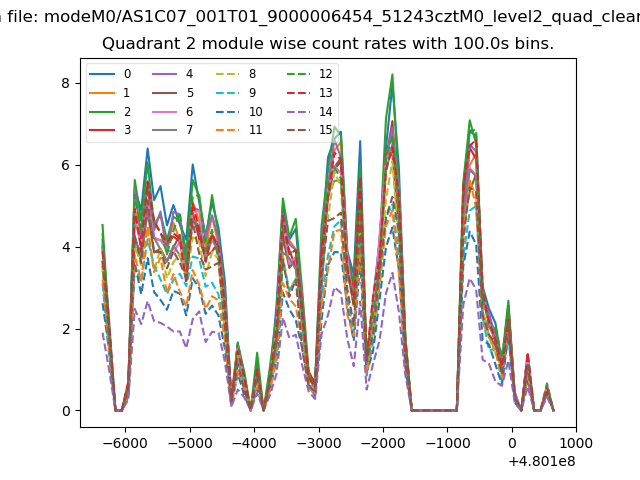
| Module-wise count rates for Quadrant B Data is divided into 100 sec bins |
 |
 |
| Module-wise count rates for Quadrant C Data is divided into 100 sec bins |
 |
 |
| Module-wise count rates for Quadrant D Data is divided into 100 sec bins |
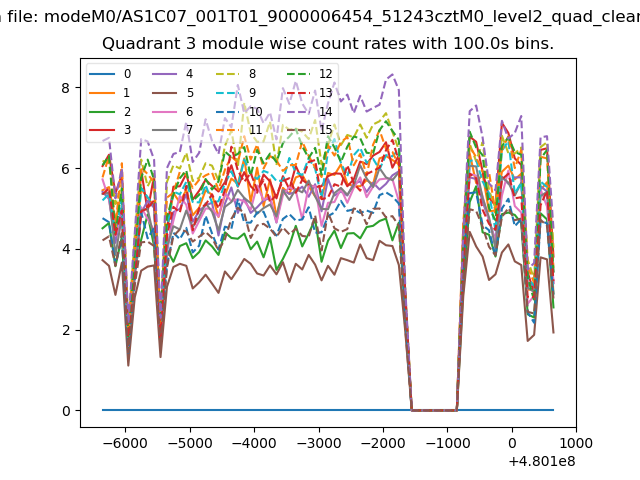 |
 |
| Parameter | Plot |
|---|---|
| CZT HV Monitor | 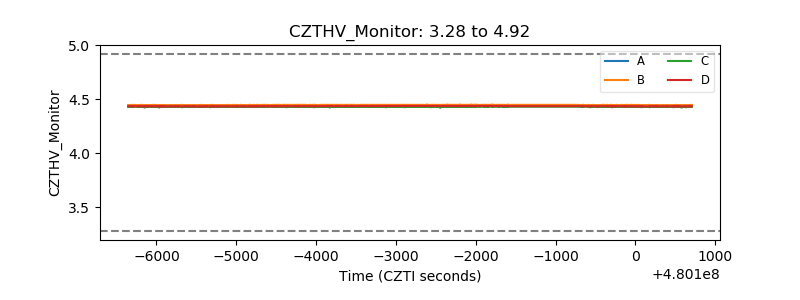 |
| D_VDD | 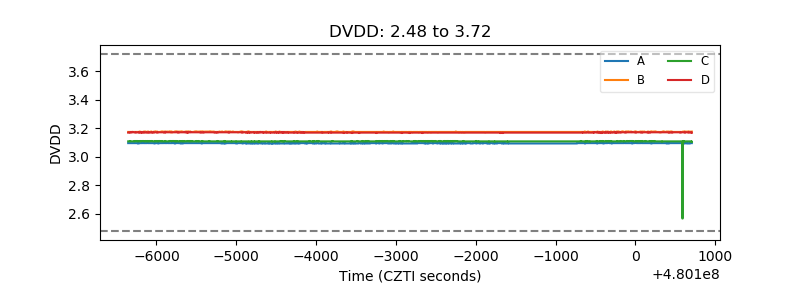 |
| Temperature 1 | 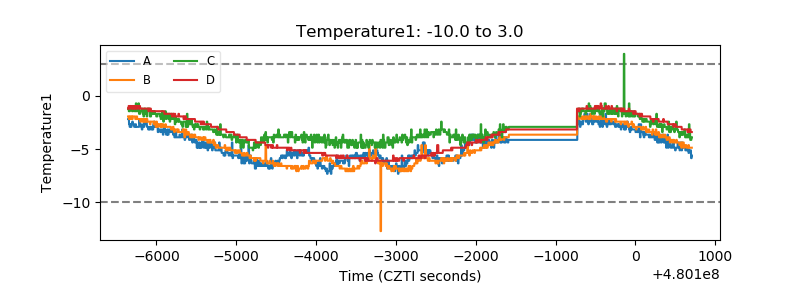 |
| Veto HV Monitor | 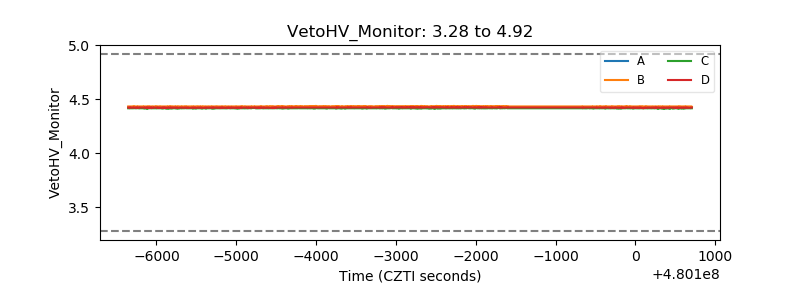 |
| Veto LLD | 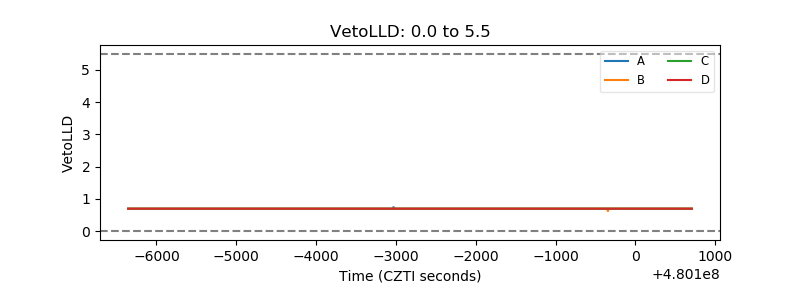 |
| Alpha Counter | 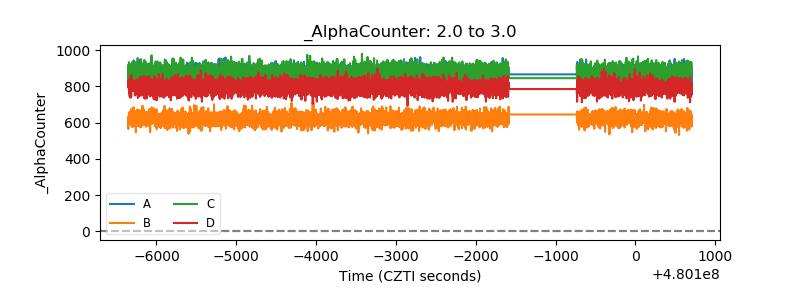 |
| _CPM_Rate | 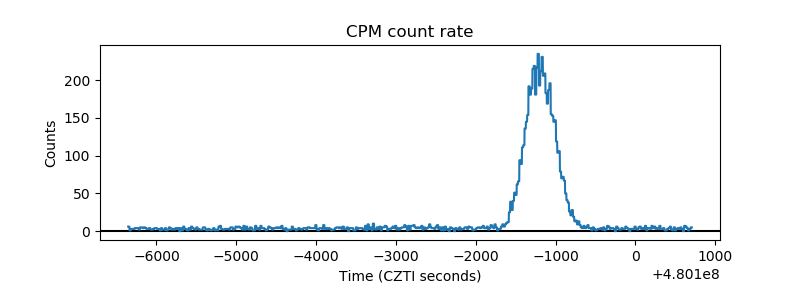 |
| CZT Counter | 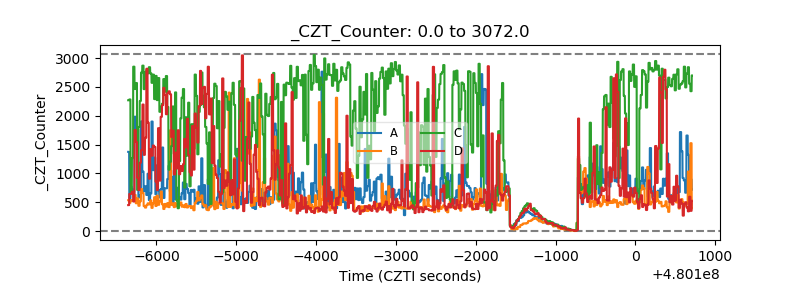 |
| +2.5 Volts monitor | 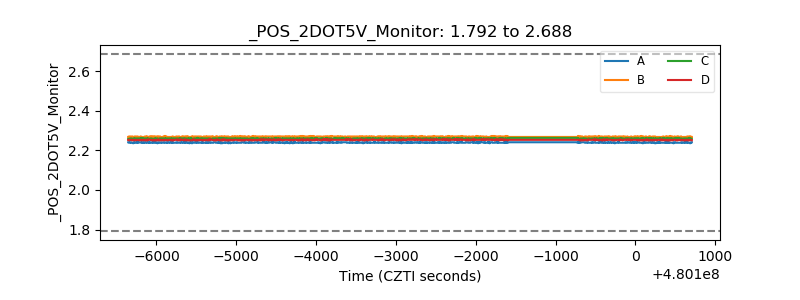 |
| +5 Volts monitor | 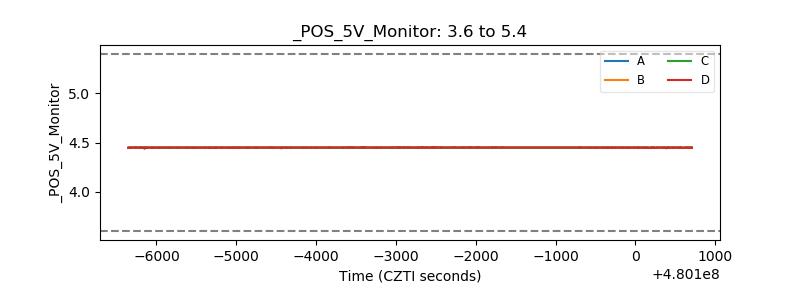 |
| _ROLL_ROT | 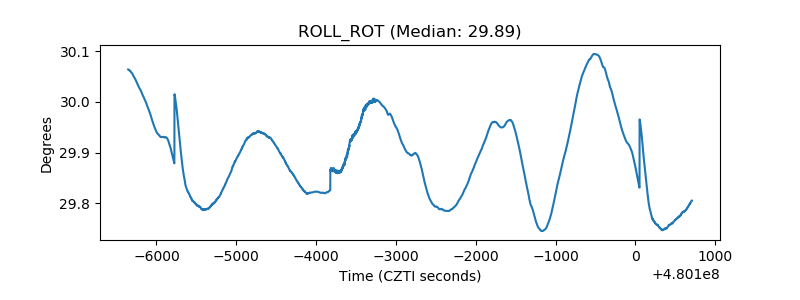 |
| _Roll_DEC | 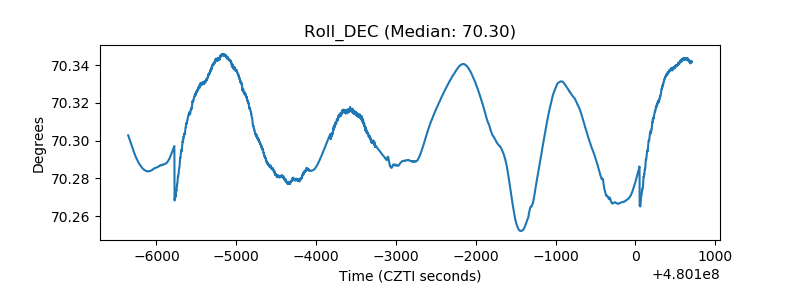 |
| _Roll_RA | 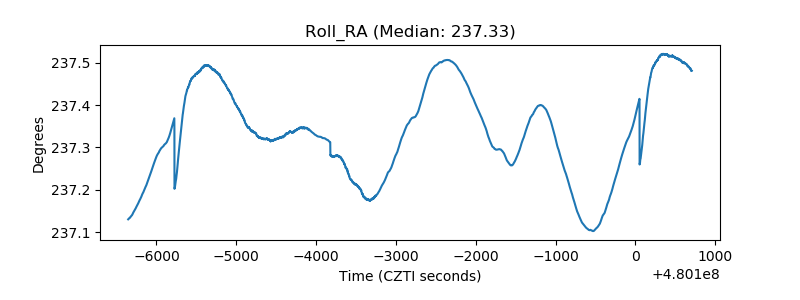 |
| Veto Counter | 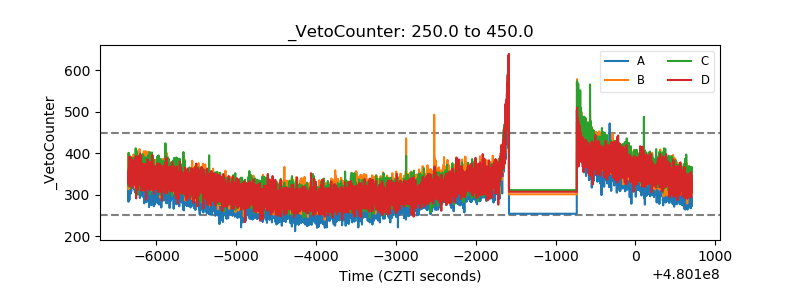 |