| Param | Original file | Final file |
|---|---|---|
| Filename | modeM0/AS1C07_001T01_9000006454_51245cztM0_level2.fits | modeM0/AS1C07_001T01_9000006454_51245cztM0_level2_quad_clean.evt |
| Size (bytes) | 691,793,280 | 76,320,000 |
| Size | 659.7 MB | 72.8 MB |
| Events in quadrant A | 5,025,428 | 555,327 |
| Events in quadrant B | 3,641,659 | 617,612 |
| Events in quadrant C | 12,258,385 | 209,005 |
| Events in quadrant D | 4,205,184 | 499,720 |
| Mode M0 | |||
|---|---|---|---|
| Quadrant | BADHDUFLAG | Total packets | Discarded packets |
| A | 0 | 19271 | 1 |
| B | 0 | 15013 | 1 |
| C | 0 | 40446 | 1 |
| D | 0 | 16855 | 1 |
| Mode SS | |||
|---|---|---|---|
| Quadrant | BADHDUFLAG | Total packets | Discarded packets |
| A | 0 | 124 | 0 |
| B | 0 | 124 | 0 |
| C | 0 | 124 | 0 |
| D | 0 | 124 | 0 |
| Mode M9 | |||
|---|---|---|---|
| Quadrant | BADHDUFLAG | Total packets | Discarded packets |
| A | 0 | 10 | 0 |
| B | 0 | 10 | 0 |
| C | 0 | 10 | 0 |
| D | 0 | 10 | 0 |
| Quadrant | Total seconds | Saturated seconds | Saturation percentage |
|---|---|---|---|
| A | 6148 | 310 | 5.042290% |
| B | 6149 | 141 | 2.293056% |
| C | 6148 | 4090 | 66.525699% |
| D | 6148 | 419 | 6.815224% |
Noise dominated data is calculated using 1-second bins in cleaned event files. If a bin has >2000 counts, and if more than 50% of those come from <1% of pixels, then it is considered to be noise-dominated and hence unusable.
| Quadrant | # 1 sec bins | Bins with >0 counts | Bins with >2000 counts | High rate bins dominated by noise | Noise dominated (total time) | Noise dominated (detector-on time) | Marked lightcurve |
|---|---|---|---|---|---|---|---|
| A | 7128 | 6149 | 139 | 139 | 1.95% | 2.26% | 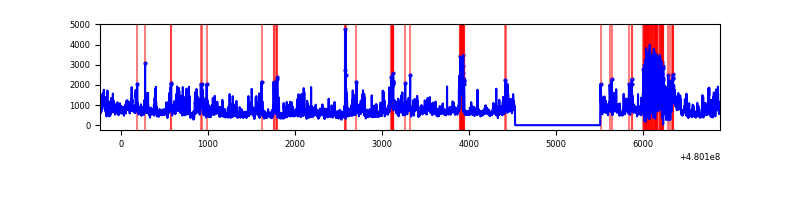 |
| B | 7129 | 6150 | 58 | 58 | 0.81% | 0.94% | 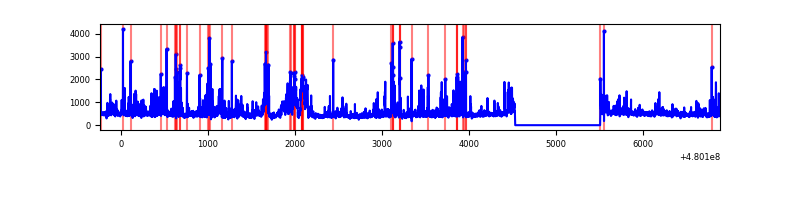 |
| C | 7128 | 6148 | 3765 | 3765 | 52.82% | 61.24% | 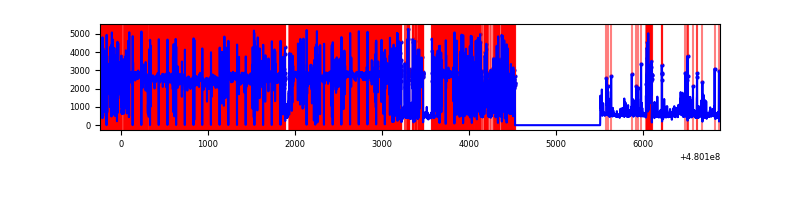 |
| D | 7128 | 6149 | 277 | 277 | 3.89% | 4.50% | 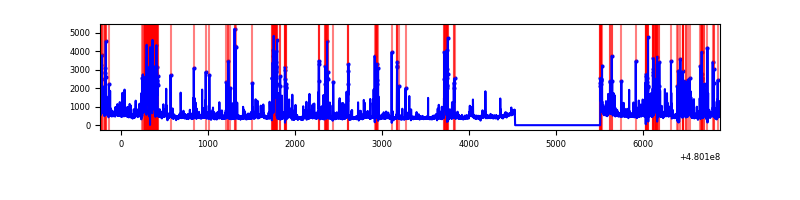 |
Top three noisy pixels from each quadrant. If the there are fewer than three noisy pixels in the level2.evt file, extra rows are filled as -1
| Pixel properties | Quadrant properties | ||||||
|---|---|---|---|---|---|---|---|
| Quadrant | DetID | PixID | Counts | Sigma | Mean | Median | Sigma |
| A | 12 | 3 | 1270263 | 8024.7 | 630 | 616 | 158.2 |
| A | 9 | 160 | 250584 | 1579.9 | 630 | 616 | 158.2 |
| A | 12 | 194 | 148600 | 935.32 | 630 | 616 | 158.2 |
| B | 10 | 254 | 303460 | 2222.73 | 640 | 619 | 136.2 |
| B | 7 | 252 | 126679 | 925.23 | 640 | 619 | 136.2 |
| B | 8 | 128 | 91811 | 669.31 | 640 | 619 | 136.2 |
| C | 4 | 12 | 10600467 | 120577.42 | 317 | 315 | 87.9 |
| C | 13 | 3 | 116225 | 1318.48 | 317 | 315 | 87.9 |
| C | 10 | 171 | 80991 | 917.69 | 317 | 315 | 87.9 |
| D | 8 | 176 | 358327 | 2097.32 | 610 | 588 | 170.6 |
| D | 3 | 12 | 341719 | 1999.95 | 610 | 588 | 170.6 |
| D | 2 | 216 | 159933 | 934.19 | 610 | 588 | 170.6 |
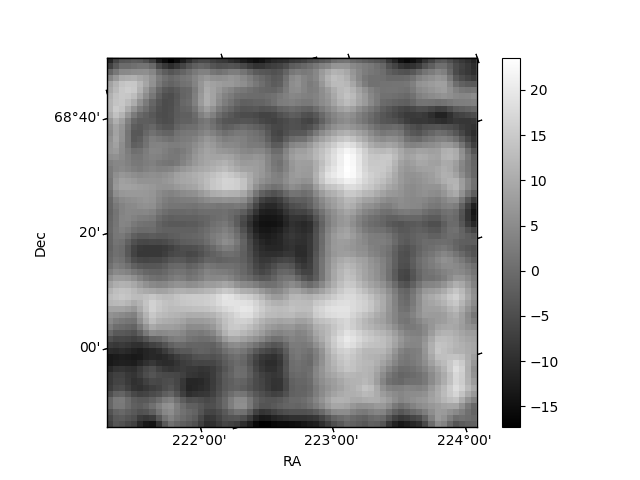
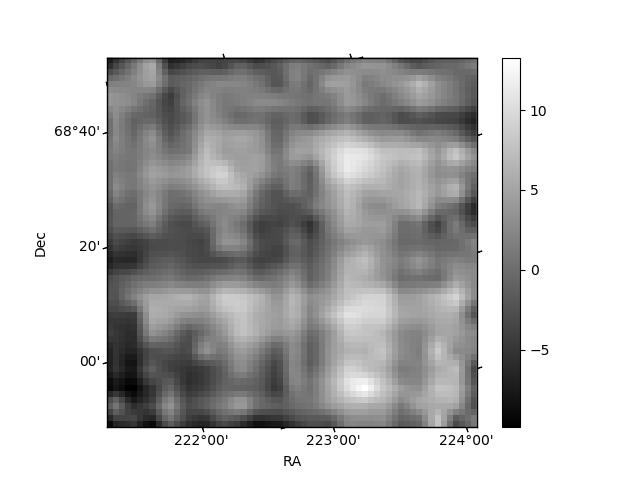
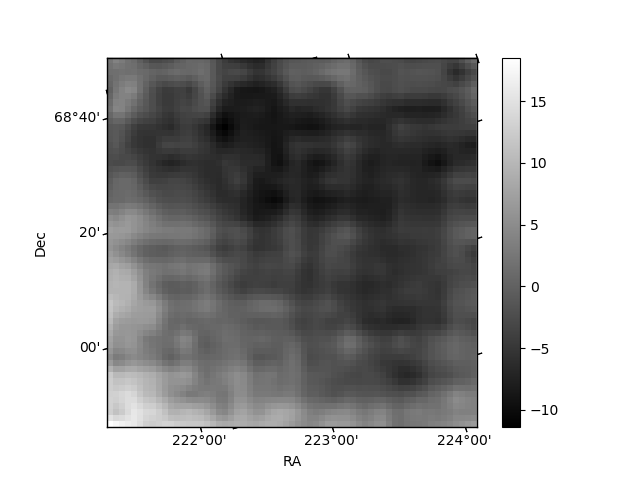
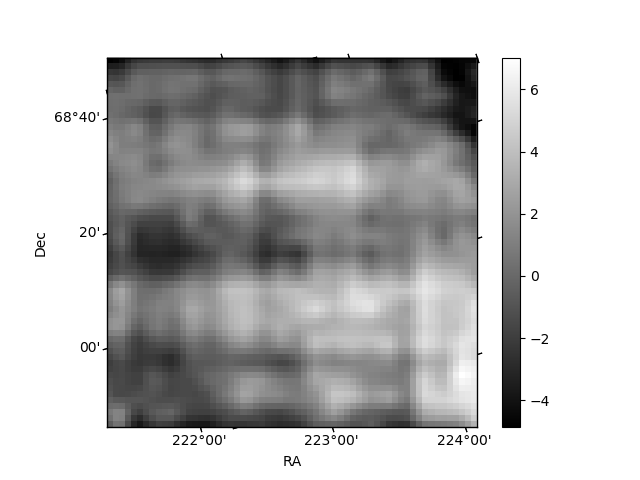
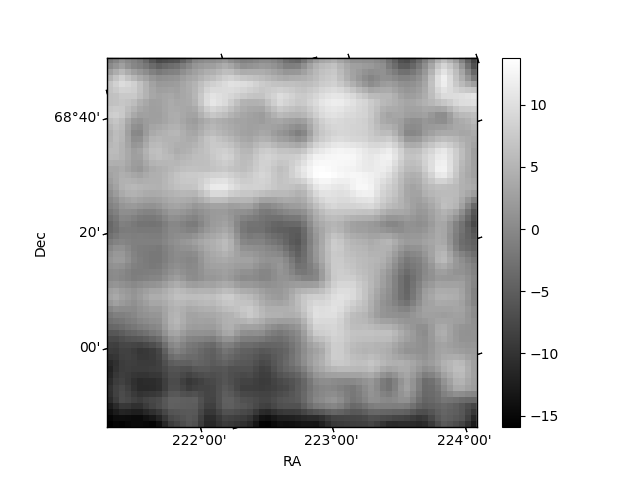
Histogram calculated using DETX and DETY for each event in the final _common_clean file
| Quadrant A | 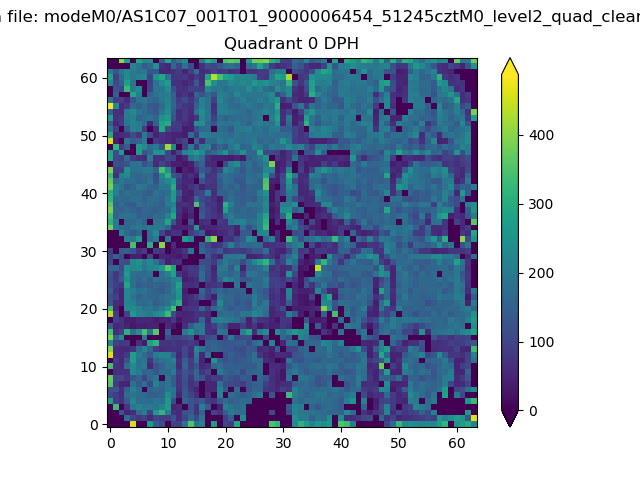 |
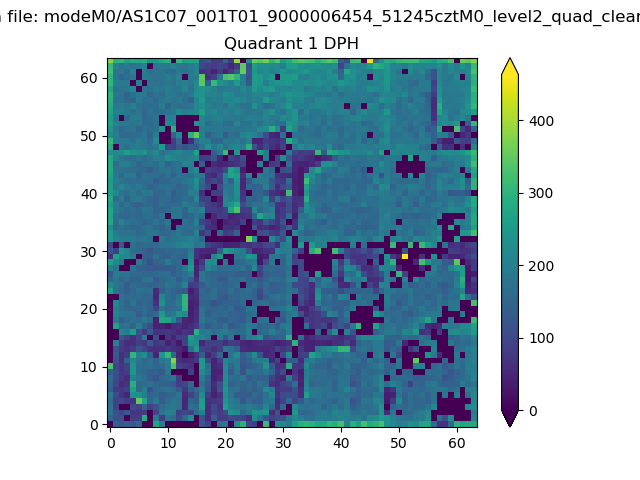 |
Quadrant B |
|---|---|---|---|
| Quadrant D | 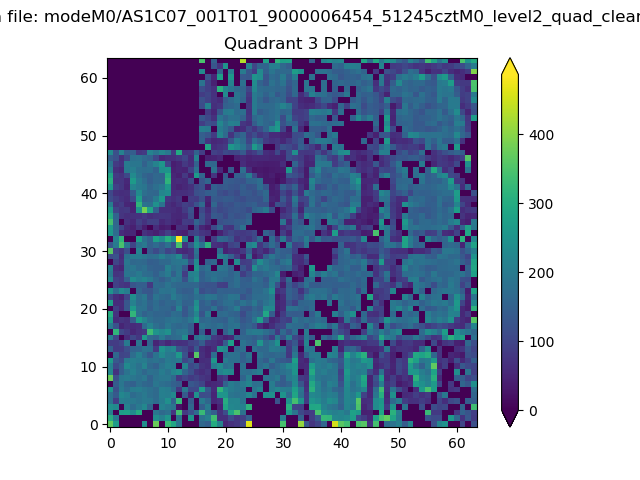 |
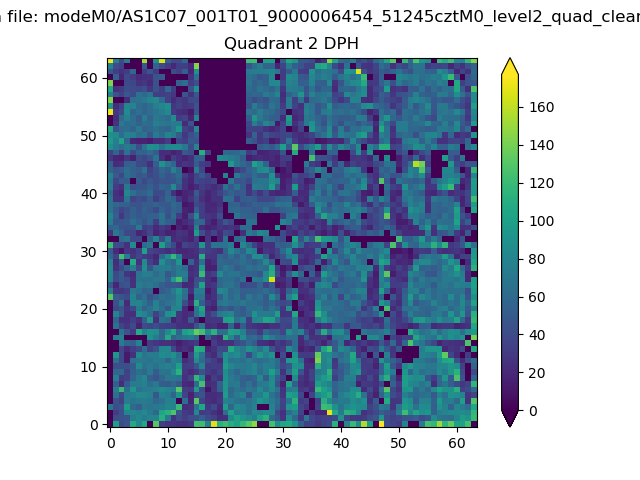 |
Quadrant C |
| Plot type | Count rate plots | Images |
|---|---|---|
| Comparison with Poisson distribution Blue bars denote a histogram of data divided into 1 sec bins. Red curve is a Poisson curve with rate = median count rate of data. |
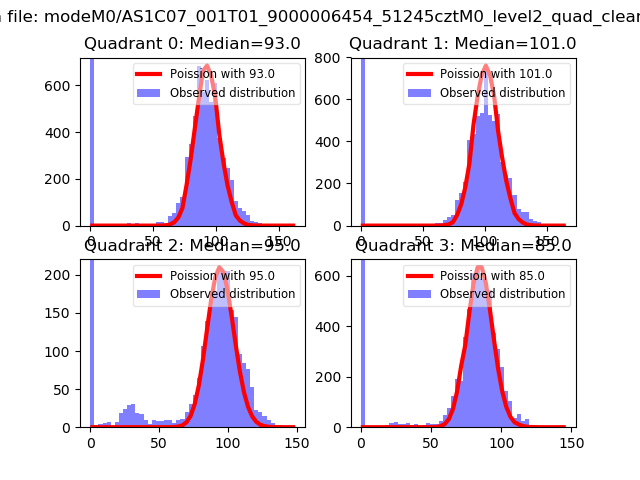 |
 |
| Quadrant-wise count rates Data is divided into 100 sec bins |
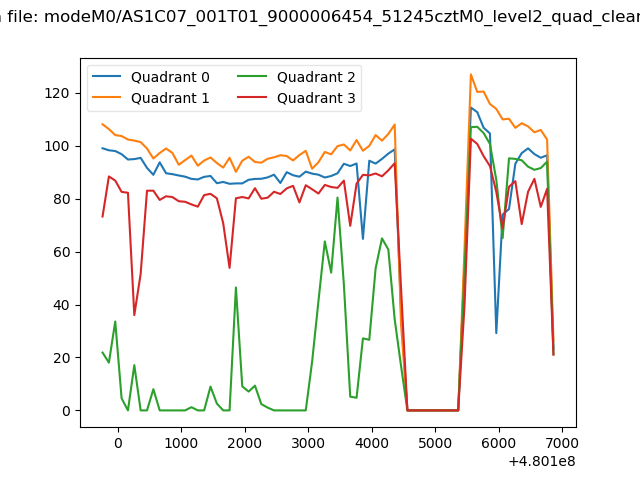 |
|
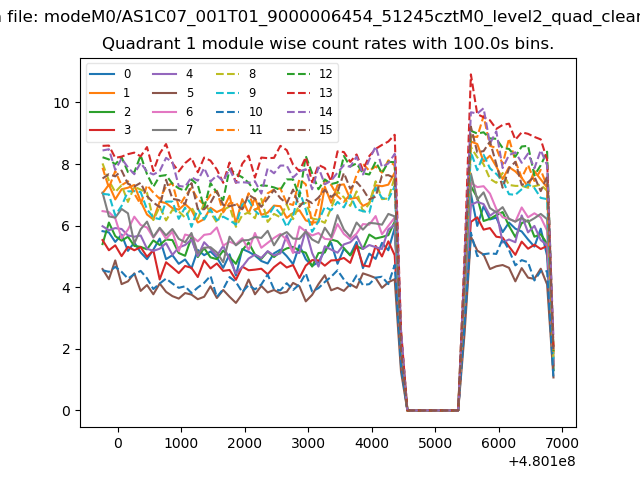
| Module-wise count rates for Quadrant A Data is divided into 100 sec bins |
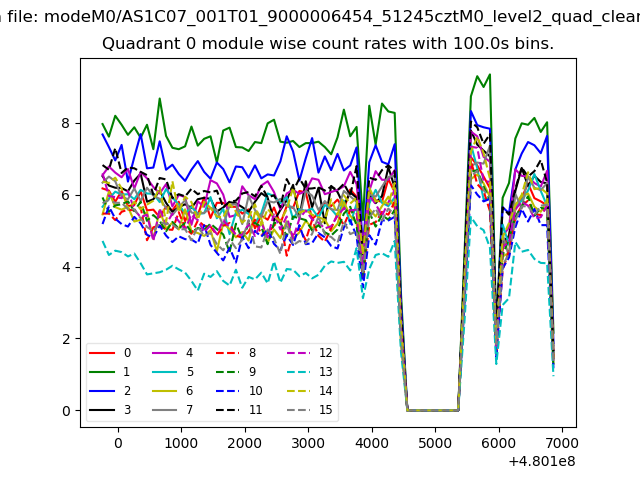 |
 |
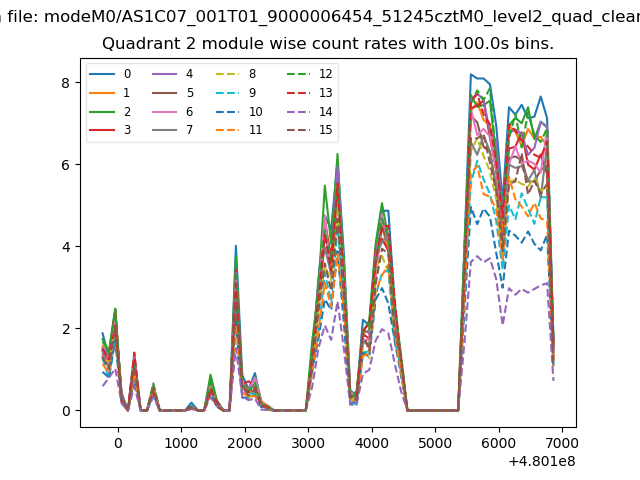
| Module-wise count rates for Quadrant B Data is divided into 100 sec bins |
 |
 |
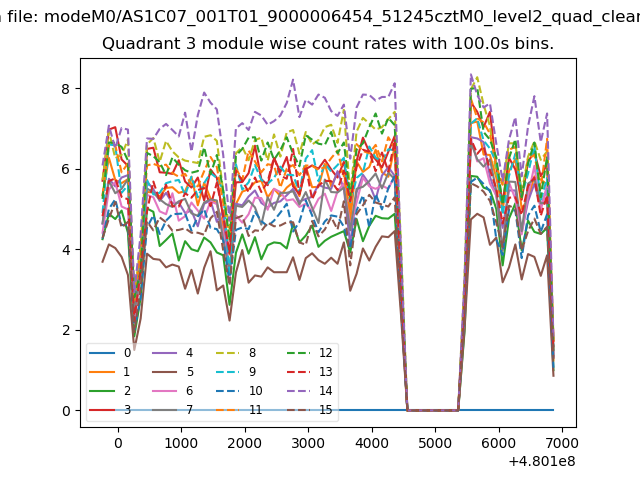
| Module-wise count rates for Quadrant C Data is divided into 100 sec bins |
 |
 |
| Module-wise count rates for Quadrant D Data is divided into 100 sec bins |
 |
 |
| Parameter | Plot |
|---|---|
| CZT HV Monitor | 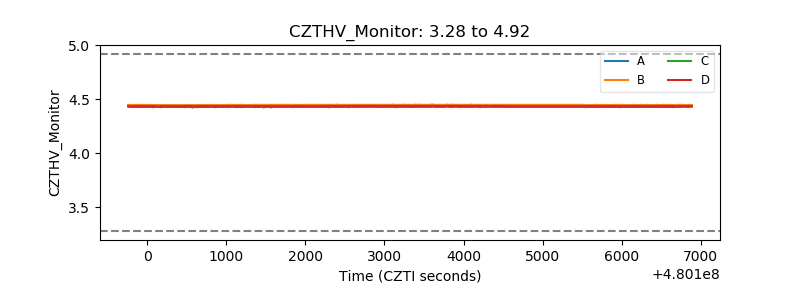 |
| D_VDD | 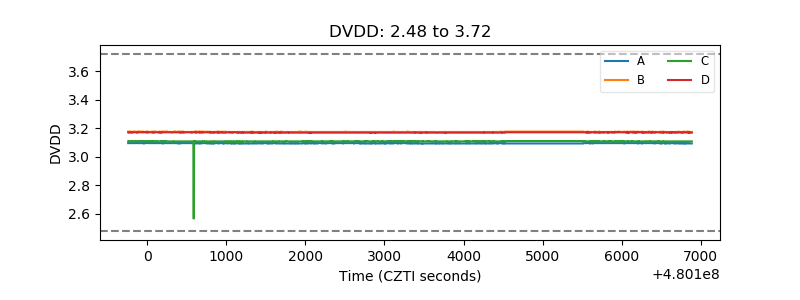 |
| Temperature 1 | 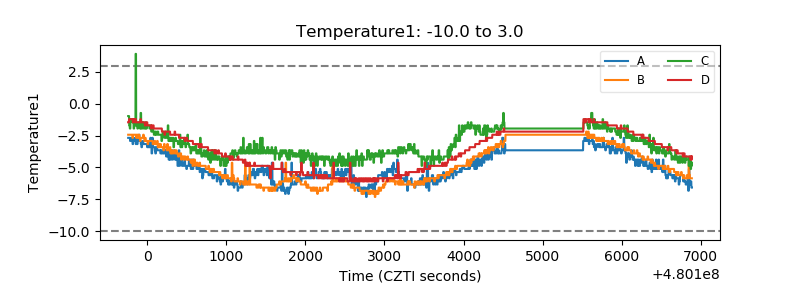 |
| Veto HV Monitor | 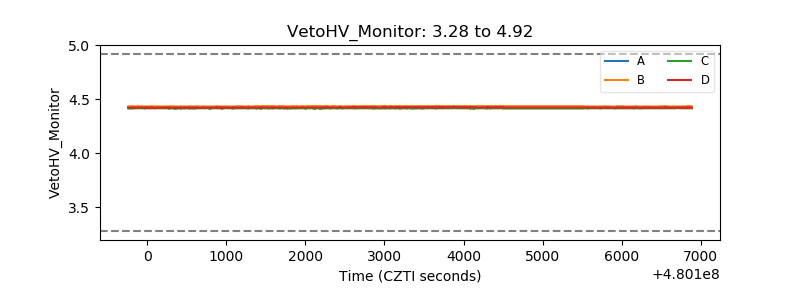 |
| Veto LLD | 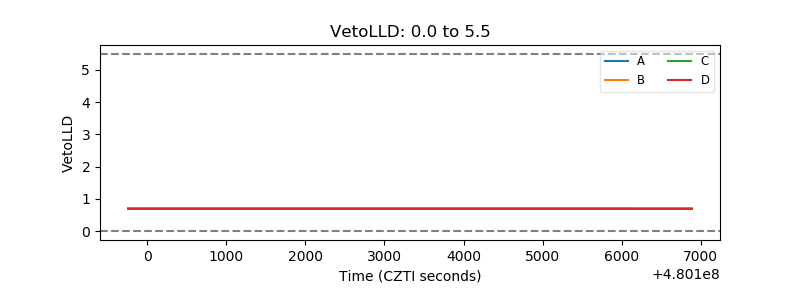 |
| Alpha Counter | 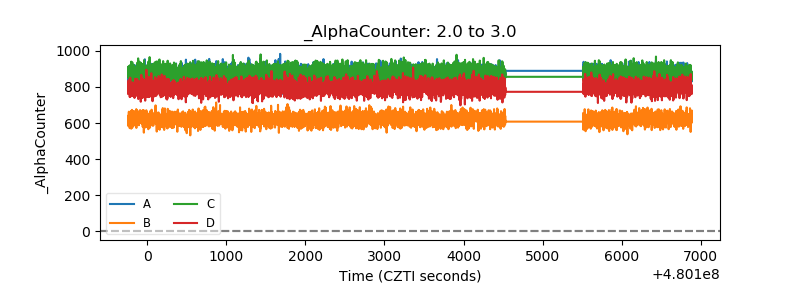 |
| _CPM_Rate | 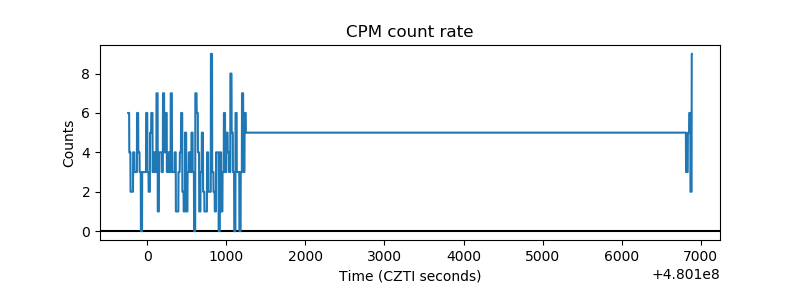 |
| CZT Counter | 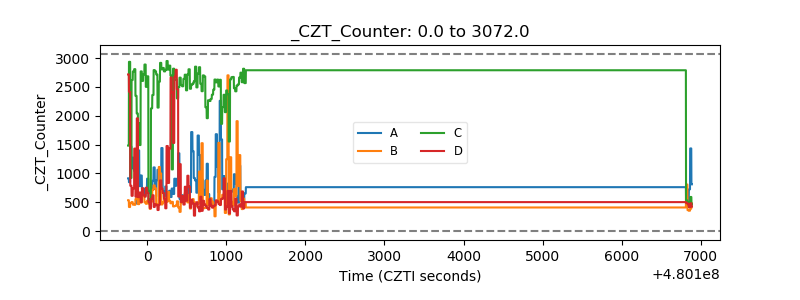 |
| +2.5 Volts monitor | 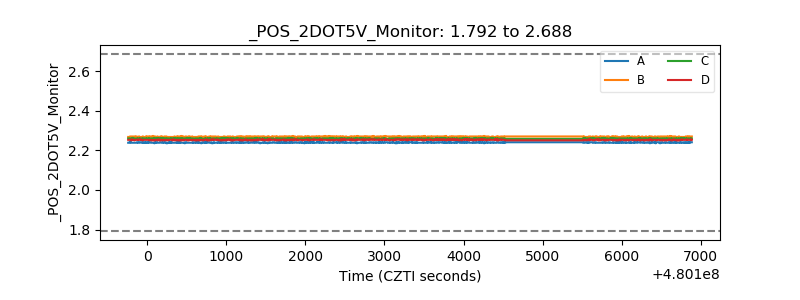 |
| +5 Volts monitor | 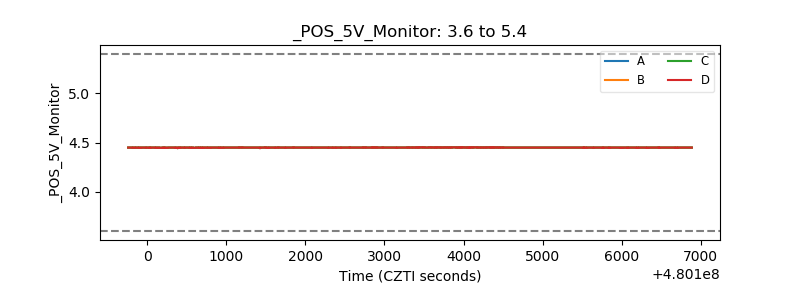 |
| _ROLL_ROT | 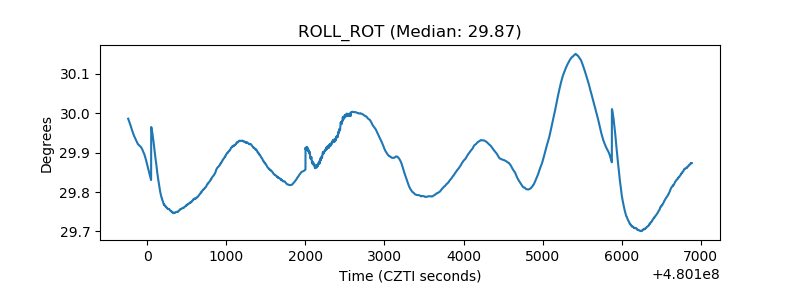 |
| _Roll_DEC | 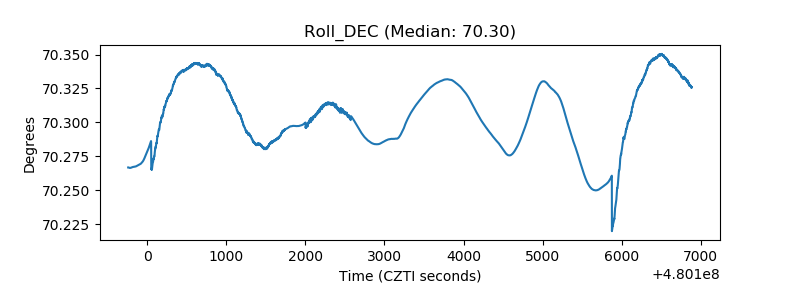 |
| _Roll_RA | 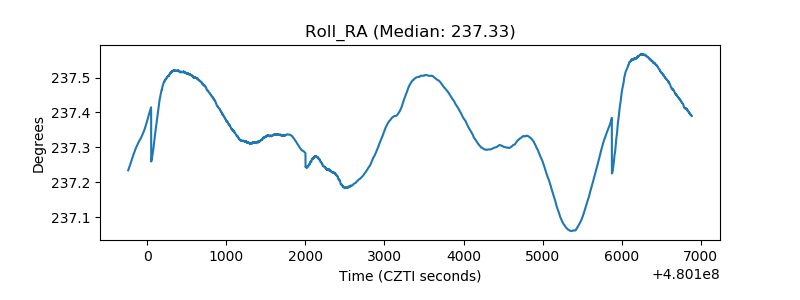 |
| Veto Counter | 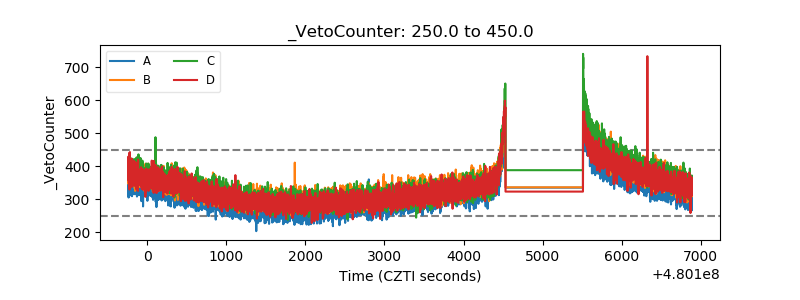 |