| Param | Original file | Final file |
|---|---|---|
| Filename | modeM0/AS1C07_001T01_9000006454_51246cztM0_level2.fits | modeM0/AS1C07_001T01_9000006454_51246cztM0_level2_quad_clean.evt |
| Size (bytes) | 600,330,240 | 92,168,640 |
| Size | 572.5 MB | 87.9 MB |
| Events in quadrant A | 5,424,741 | 615,876 |
| Events in quadrant B | 3,939,870 | 680,979 |
| Events in quadrant C | 7,459,861 | 473,144 |
| Events in quadrant D | 4,884,444 | 559,299 |
| Mode M0 | |||
|---|---|---|---|
| Quadrant | BADHDUFLAG | Total packets | Discarded packets |
| A | 0 | 20752 | 2 |
| B | 0 | 16358 | 2 |
| C | 0 | 26783 | 2 |
| D | 0 | 19140 | 2 |
| Mode SS | |||
|---|---|---|---|
| Quadrant | BADHDUFLAG | Total packets | Discarded packets |
| A | 0 | 136 | 0 |
| B | 0 | 136 | 0 |
| C | 0 | 136 | 0 |
| D | 0 | 136 | 0 |
| Mode M9 | |||
|---|---|---|---|
| Quadrant | BADHDUFLAG | Total packets | Discarded packets |
| A | 0 | 22 | 0 |
| B | 0 | 22 | 0 |
| C | 0 | 22 | 0 |
| D | 0 | 22 | 0 |
| Quadrant | Total seconds | Saturated seconds | Saturation percentage |
|---|---|---|---|
| A | 6619 | 341 | 5.151836% |
| B | 6620 | 236 | 3.564955% |
| C | 6619 | 1729 | 26.121771% |
| D | 6619 | 433 | 6.541774% |
Noise dominated data is calculated using 1-second bins in cleaned event files. If a bin has >2000 counts, and if more than 50% of those come from <1% of pixels, then it is considered to be noise-dominated and hence unusable.
| Quadrant | # 1 sec bins | Bins with >0 counts | Bins with >2000 counts | High rate bins dominated by noise | Noise dominated (total time) | Noise dominated (detector-on time) | Marked lightcurve |
|---|---|---|---|---|---|---|---|
| A | 8734 | 6621 | 135 | 135 | 1.55% | 2.04% |  |
| B | 8735 | 6622 | 97 | 97 | 1.11% | 1.46% | 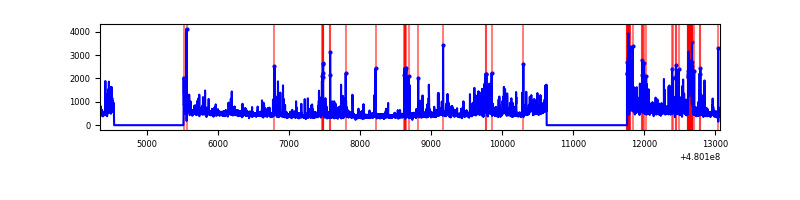 |
| C | 8734 | 6620 | 1453 | 1453 | 16.64% | 21.95% | 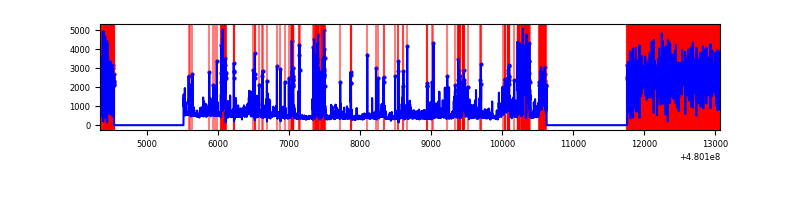 |
| D | 8734 | 6621 | 313 | 313 | 3.58% | 4.73% |  |
Top three noisy pixels from each quadrant. If the there are fewer than three noisy pixels in the level2.evt file, extra rows are filled as -1
| Pixel properties | Quadrant properties | ||||||
|---|---|---|---|---|---|---|---|
| Quadrant | DetID | PixID | Counts | Sigma | Mean | Median | Sigma |
| A | 12 | 3 | 1529133 | 8878.75 | 693 | 676 | 172.1 |
| A | 12 | 194 | 176834 | 1023.3 | 693 | 676 | 172.1 |
| A | 3 | 114 | 114132 | 659.06 | 693 | 676 | 172.1 |
| B | 5 | 172 | 288621 | 1939.59 | 701 | 678 | 148.5 |
| B | 7 | 252 | 198675 | 1333.71 | 701 | 678 | 148.5 |
| B | 8 | 234 | 139581 | 935.65 | 701 | 678 | 148.5 |
| C | 4 | 12 | 4393472 | 26703.04 | 596 | 591 | 164.5 |
| C | 13 | 3 | 199304 | 1207.92 | 596 | 591 | 164.5 |
| C | 4 | 13 | 109404 | 661.44 | 596 | 591 | 164.5 |
| D | 8 | 176 | 746540 | 3903.0 | 676 | 649 | 191.1 |
| D | 7 | 96 | 346786 | 1811.22 | 676 | 649 | 191.1 |
| D | 2 | 216 | 282682 | 1475.78 | 676 | 649 | 191.1 |
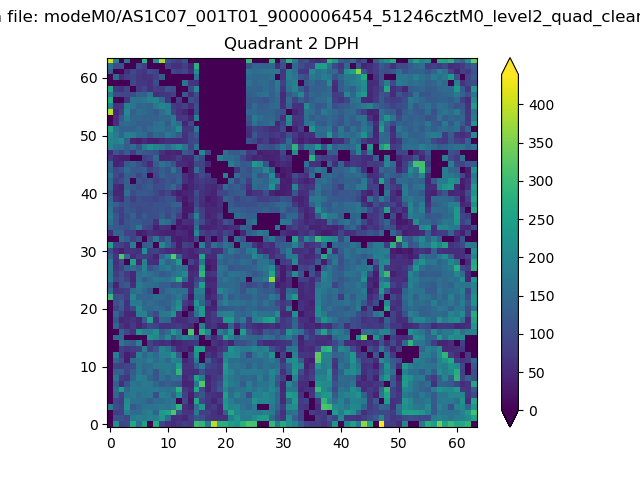
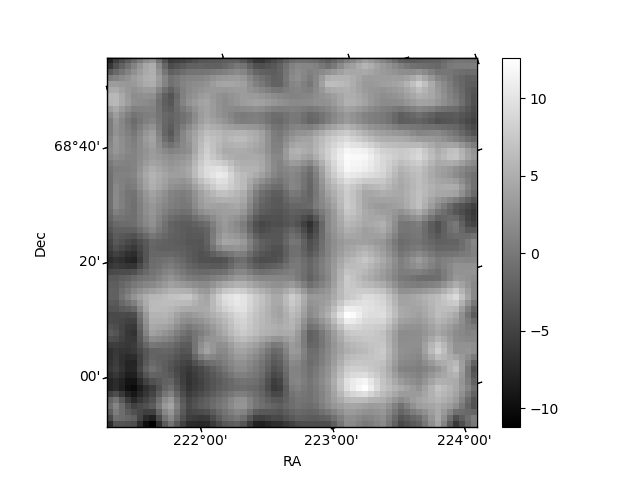
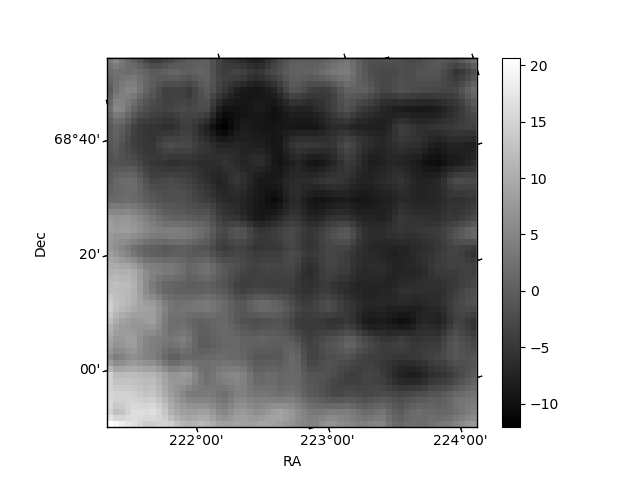
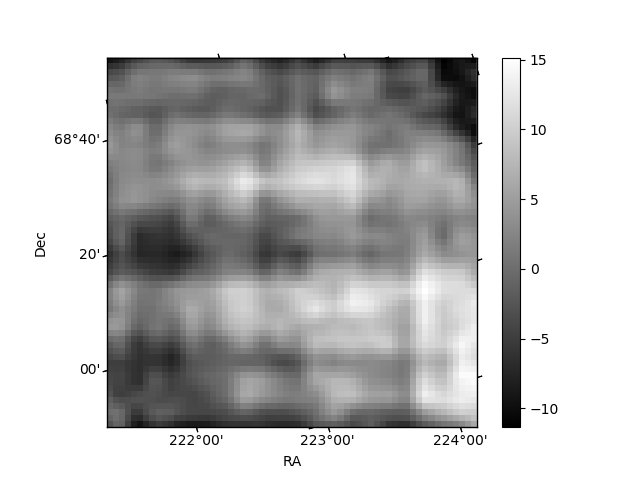
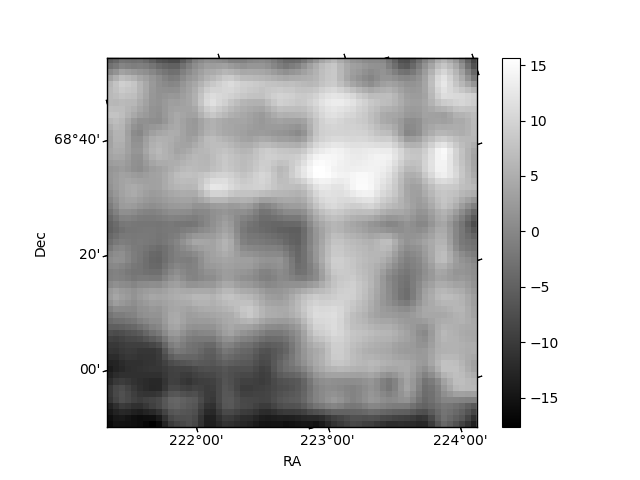
Histogram calculated using DETX and DETY for each event in the final _common_clean file
| Quadrant A | 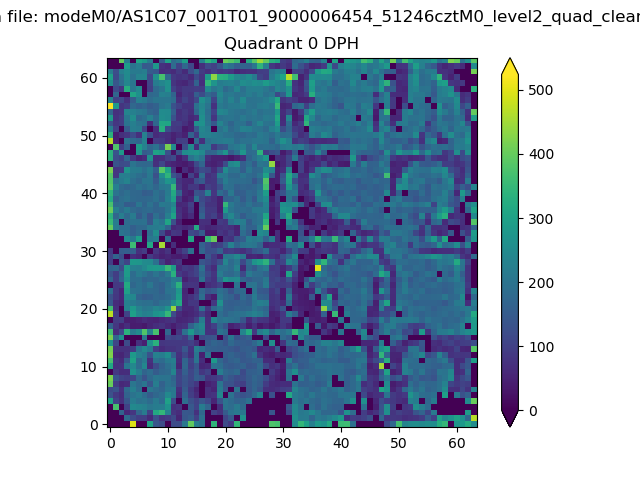 |
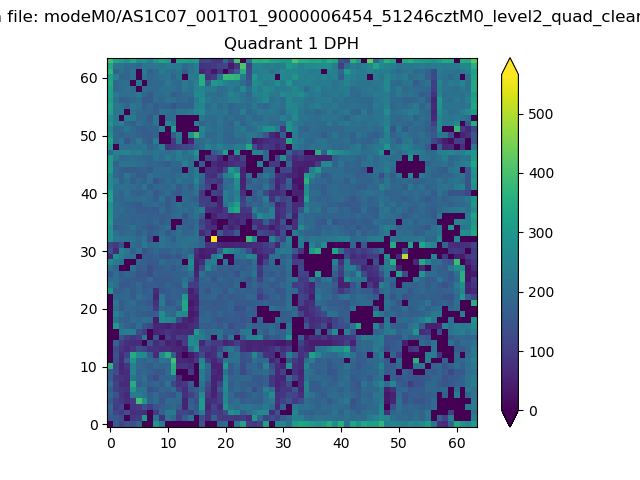 |
Quadrant B |
|---|---|---|---|
| Quadrant D | 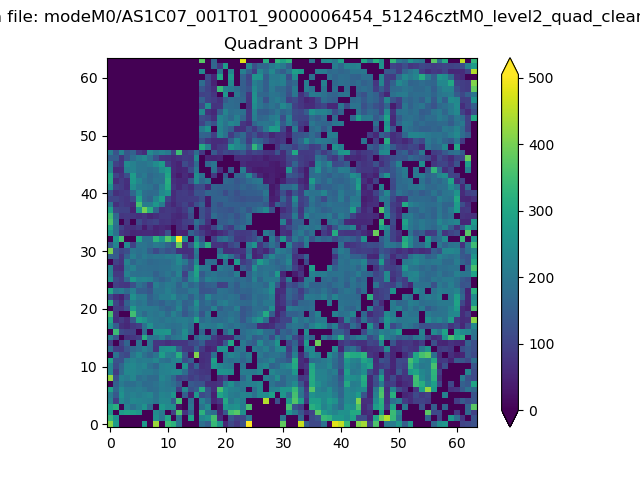 |
 |
Quadrant C |
| Plot type | Count rate plots | Images |
|---|---|---|
| Comparison with Poisson distribution Blue bars denote a histogram of data divided into 1 sec bins. Red curve is a Poisson curve with rate = median count rate of data. |
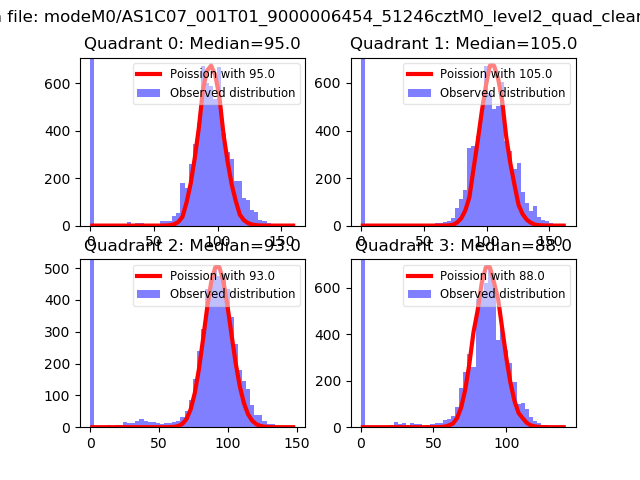 |
 |
| Quadrant-wise count rates Data is divided into 100 sec bins |
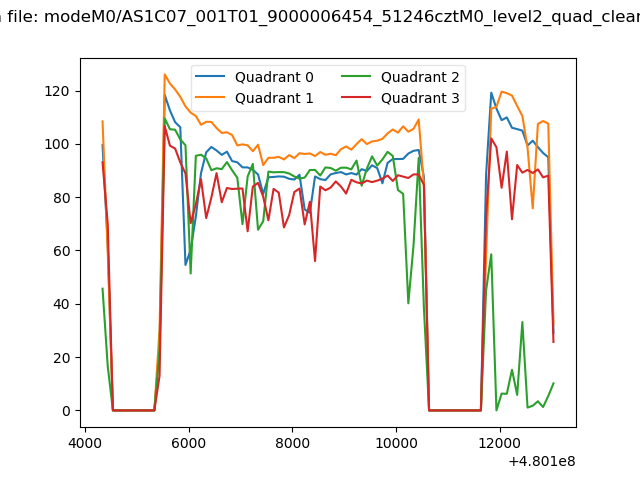 |
|
| Module-wise count rates for Quadrant A Data is divided into 100 sec bins |
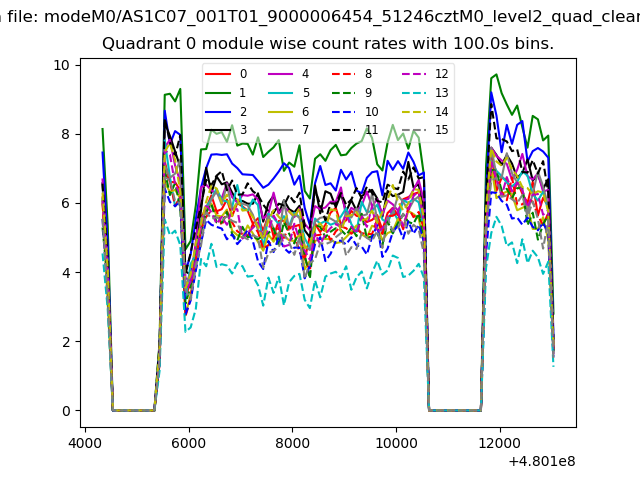 |
 |
| Module-wise count rates for Quadrant B Data is divided into 100 sec bins |
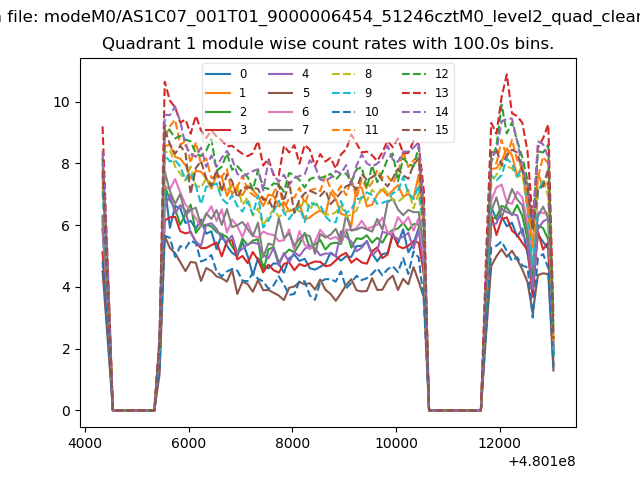 |
 |
| Module-wise count rates for Quadrant C Data is divided into 100 sec bins |
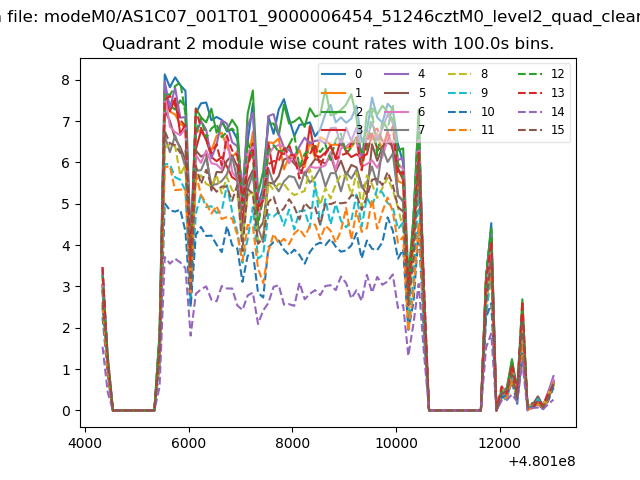 |
 |
| Module-wise count rates for Quadrant D Data is divided into 100 sec bins |
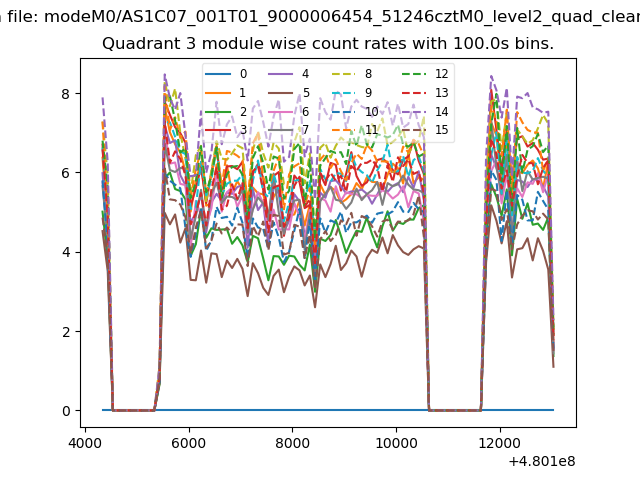 |
 |
| Parameter | Plot |
|---|---|
| CZT HV Monitor | 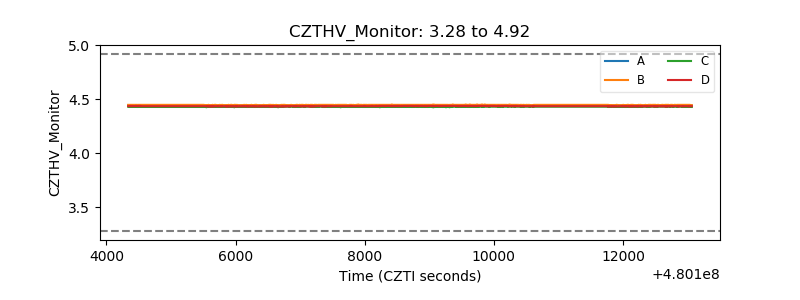 |
| D_VDD | 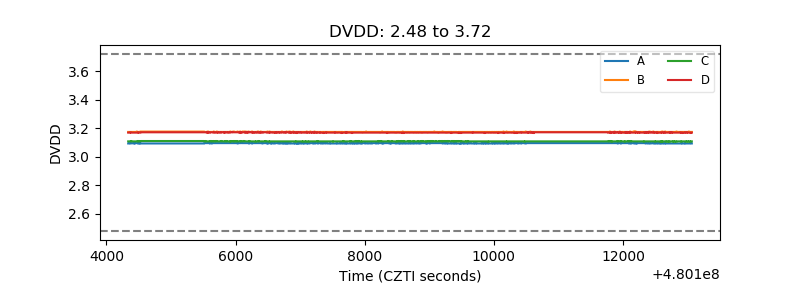 |
| Temperature 1 | 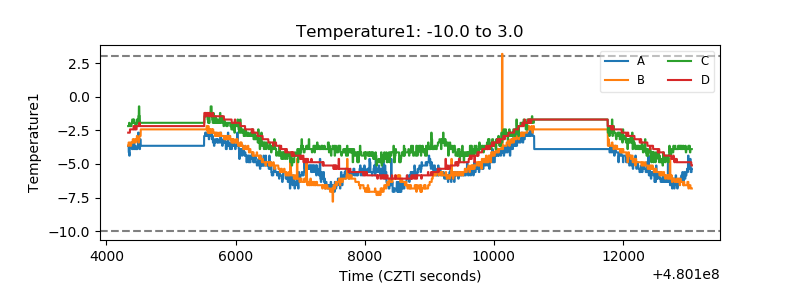 |
| Veto HV Monitor | 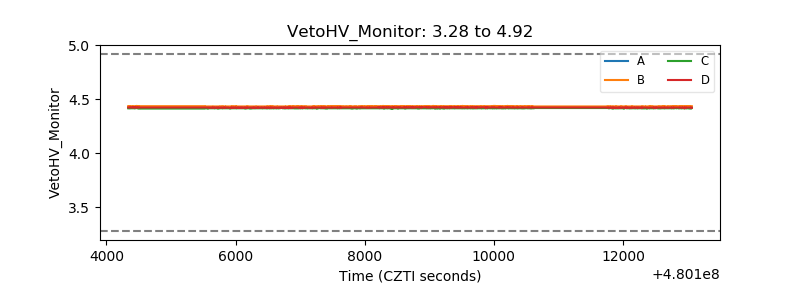 |
| Veto LLD |  |
| Alpha Counter | 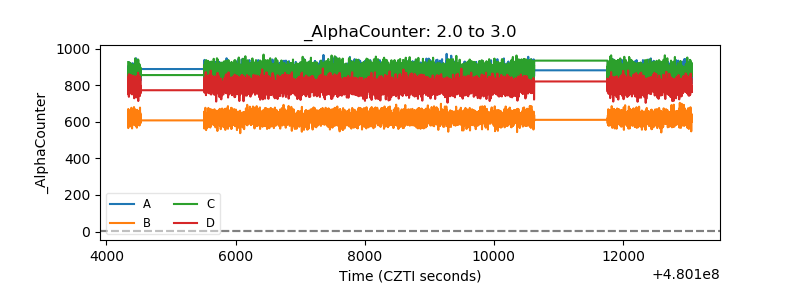 |
| _CPM_Rate | 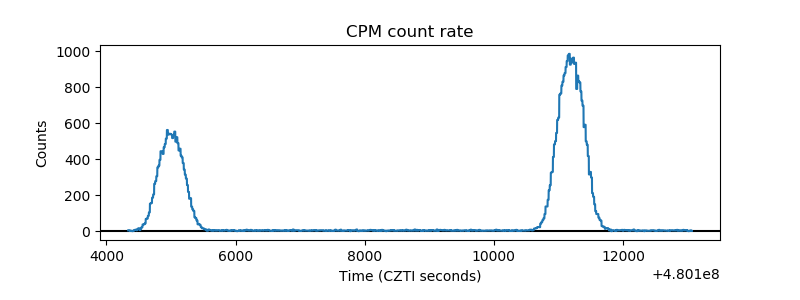 |
| CZT Counter | 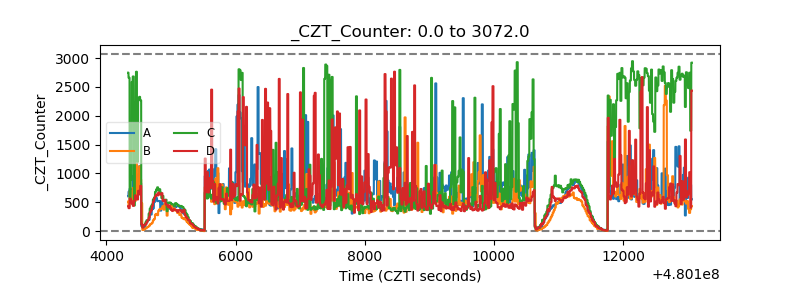 |
| +2.5 Volts monitor | 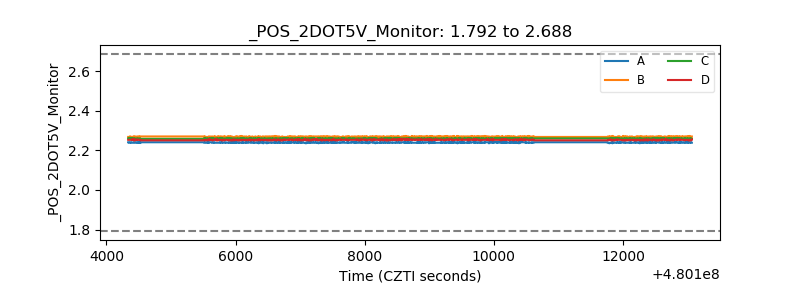 |
| +5 Volts monitor | 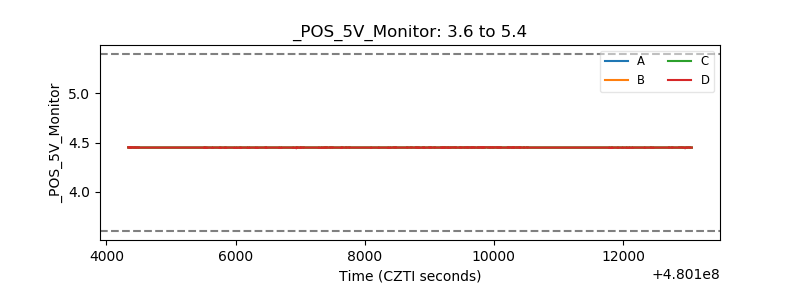 |
| _ROLL_ROT | 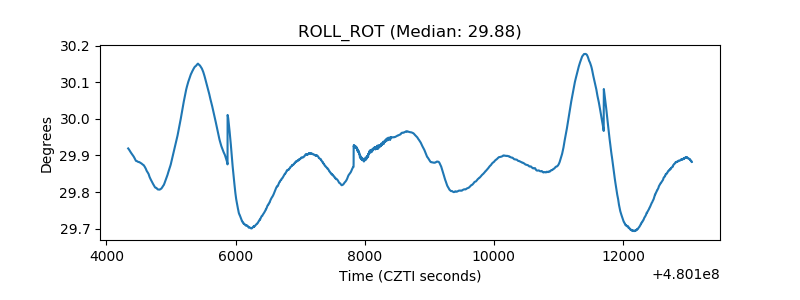 |
| _Roll_DEC | 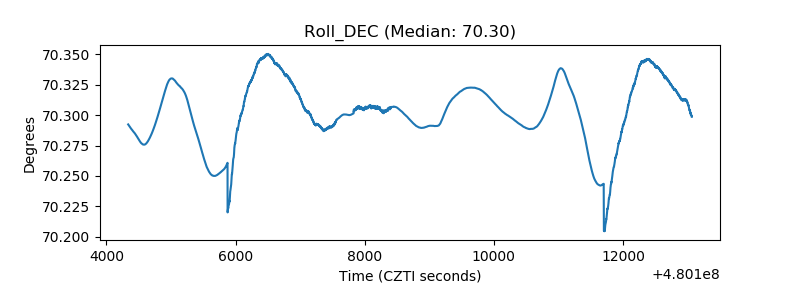 |
| _Roll_RA | 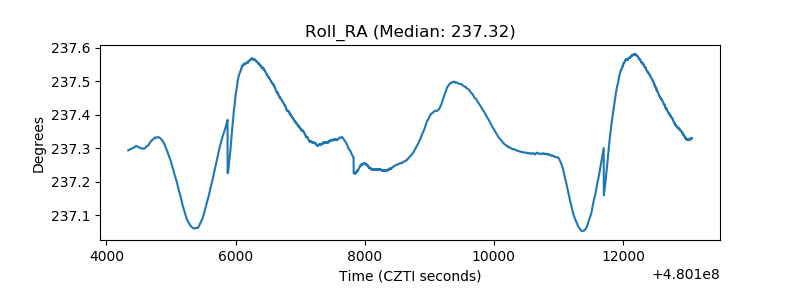 |
| Veto Counter | 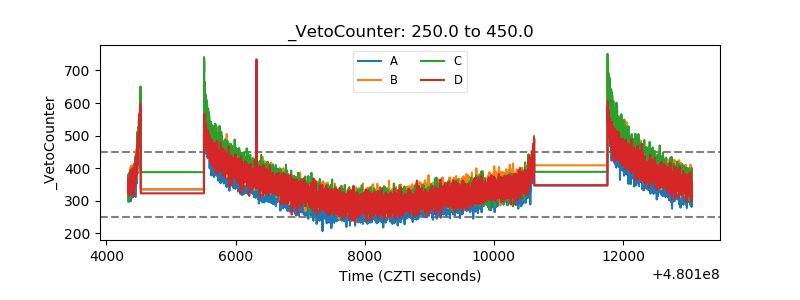 |