| Param | Original file | Final file |
|---|---|---|
| Filename | modeM0/AS1C07_001T01_9000006454_51247cztM0_level2.fits | modeM0/AS1C07_001T01_9000006454_51247cztM0_level2_quad_clean.evt |
| Size (bytes) | 646,482,240 | 88,272,000 |
| Size | 616.5 MB | 84.2 MB |
| Events in quadrant A | 5,329,705 | 612,835 |
| Events in quadrant B | 3,760,985 | 668,229 |
| Events in quadrant C | 9,835,148 | 400,479 |
| Events in quadrant D | 4,514,653 | 549,575 |
| Mode M0 | |||
|---|---|---|---|
| Quadrant | BADHDUFLAG | Total packets | Discarded packets |
| A | 0 | 20331 | 2 |
| B | 0 | 15639 | 2 |
| C | 0 | 33703 | 2 |
| D | 0 | 17930 | 2 |
| Mode SS | |||
|---|---|---|---|
| Quadrant | BADHDUFLAG | Total packets | Discarded packets |
| A | 0 | 128 | 0 |
| B | 0 | 128 | 0 |
| C | 0 | 128 | 0 |
| D | 0 | 128 | 0 |
| Mode M9 | |||
|---|---|---|---|
| Quadrant | BADHDUFLAG | Total packets | Discarded packets |
| A | 0 | 15 | 0 |
| B | 0 | 16 | 0 |
| C | 0 | 16 | 0 |
| D | 0 | 16 | 0 |
| Quadrant | Total seconds | Saturated seconds | Saturation percentage |
|---|---|---|---|
| A | 6328 | 155 | 2.449431% |
| B | 6328 | 248 | 3.919090% |
| C | 6328 | 2451 | 38.732617% |
| D | 6328 | 330 | 5.214918% |
Noise dominated data is calculated using 1-second bins in cleaned event files. If a bin has >2000 counts, and if more than 50% of those come from <1% of pixels, then it is considered to be noise-dominated and hence unusable.
| Quadrant | # 1 sec bins | Bins with >0 counts | Bins with >2000 counts | High rate bins dominated by noise | Noise dominated (total time) | Noise dominated (detector-on time) | Marked lightcurve |
|---|---|---|---|---|---|---|---|
| A | 7483 | 6329 | 103 | 103 | 1.38% | 1.63% | 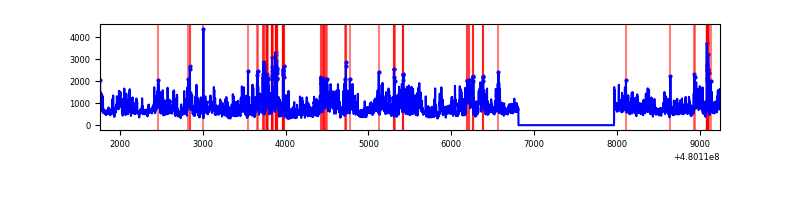 |
| B | 7483 | 6329 | 123 | 123 | 1.64% | 1.94% | 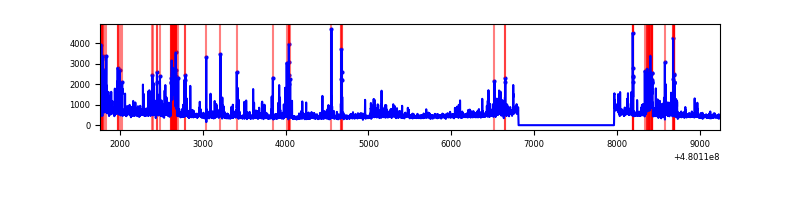 |
| C | 7483 | 6329 | 2183 | 2183 | 29.17% | 34.49% | 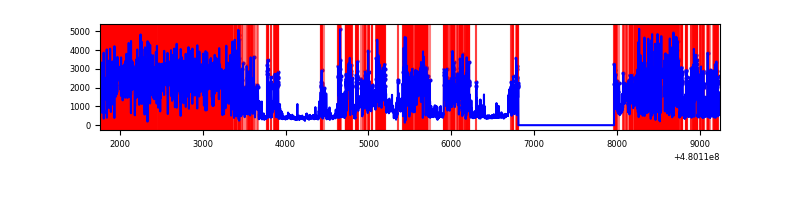 |
| D | 7483 | 6328 | 248 | 248 | 3.31% | 3.92% | 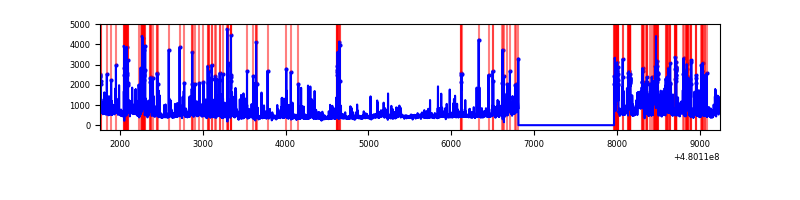 |
Top three noisy pixels from each quadrant. If the there are fewer than three noisy pixels in the level2.evt file, extra rows are filled as -1
| Pixel properties | Quadrant properties | ||||||
|---|---|---|---|---|---|---|---|
| Quadrant | DetID | PixID | Counts | Sigma | Mean | Median | Sigma |
| A | 12 | 3 | 1902435 | 11411.58 | 671 | 656 | 166.7 |
| A | 12 | 194 | 219099 | 1310.76 | 671 | 656 | 166.7 |
| A | 5 | 240 | 90444 | 538.77 | 671 | 656 | 166.7 |
| B | 7 | 252 | 276070 | 1930.84 | 671 | 648 | 142.6 |
| B | 5 | 172 | 173081 | 1208.84 | 671 | 648 | 142.6 |
| B | 8 | 128 | 162263 | 1133.0 | 671 | 648 | 142.6 |
| C | 4 | 12 | 7144193 | 48048.4 | 539 | 536 | 148.7 |
| C | 13 | 3 | 116059 | 777.01 | 539 | 536 | 148.7 |
| C | 12 | 247 | 102658 | 686.87 | 539 | 536 | 148.7 |
| D | 8 | 176 | 485936 | 2667.84 | 646 | 624 | 181.9 |
| D | 2 | 216 | 323604 | 1775.48 | 646 | 624 | 181.9 |
| D | 3 | 12 | 258655 | 1418.44 | 646 | 624 | 181.9 |
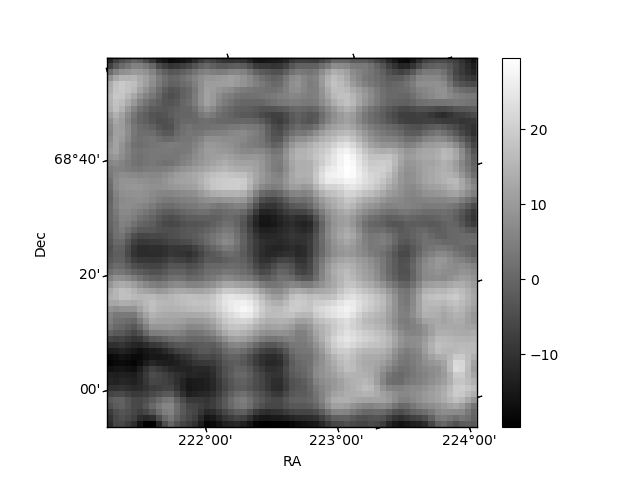
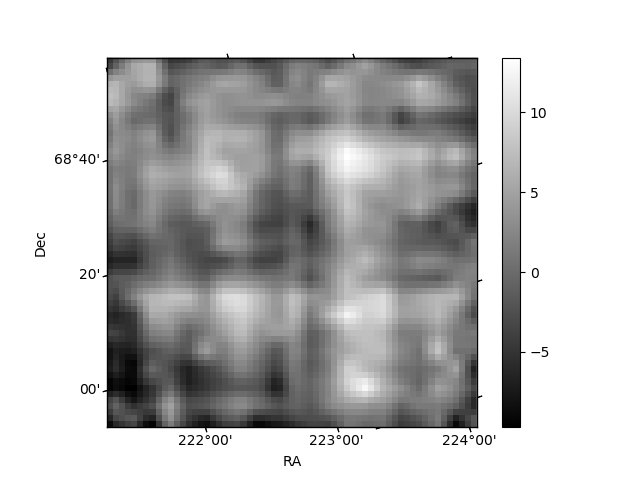
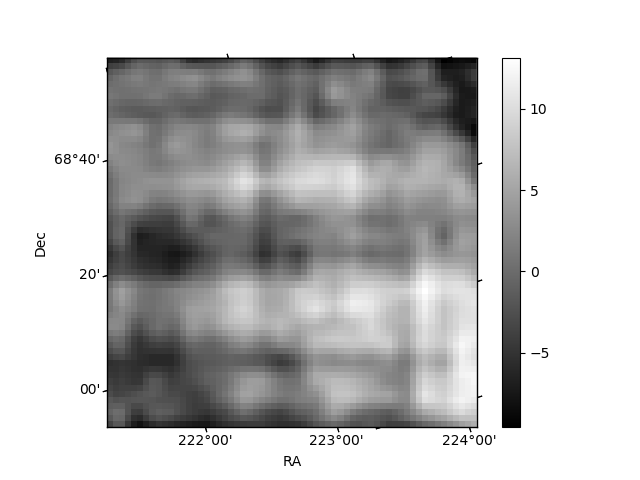
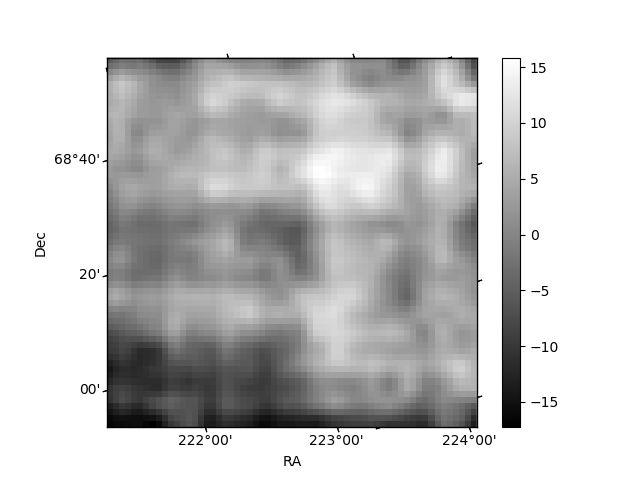
Histogram calculated using DETX and DETY for each event in the final _common_clean file
| Quadrant A | 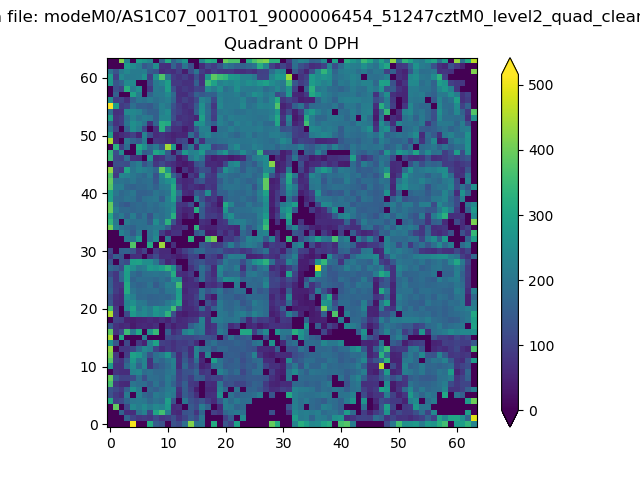 |
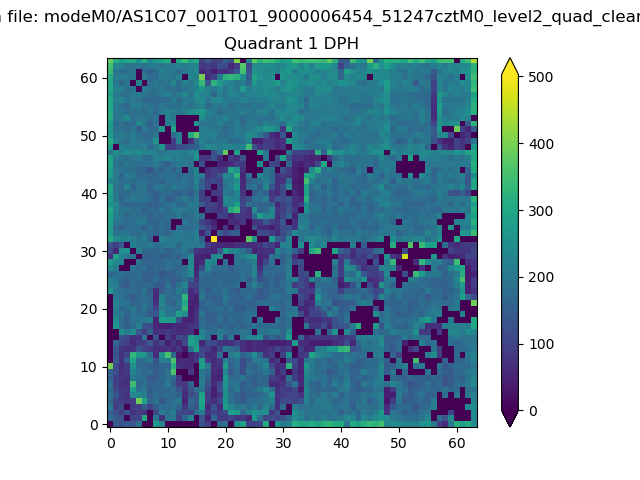 |
Quadrant B |
|---|---|---|---|
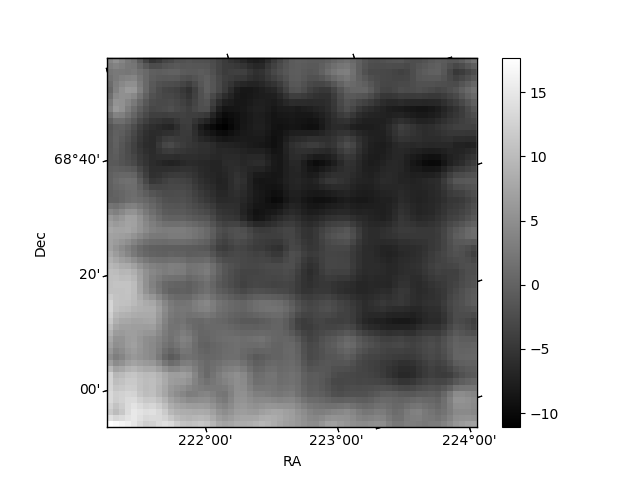
| Quadrant D | 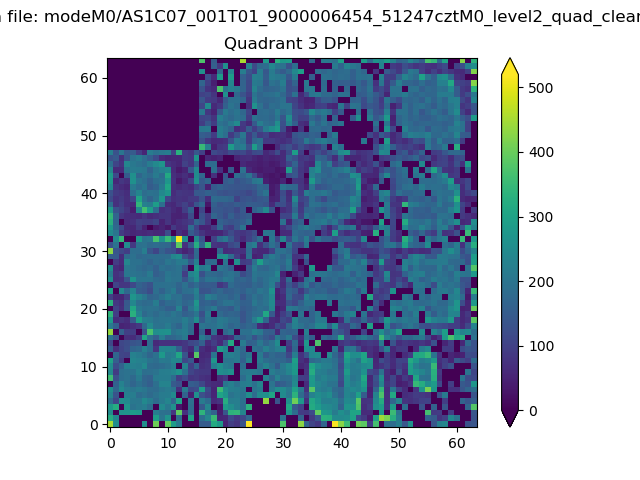 |
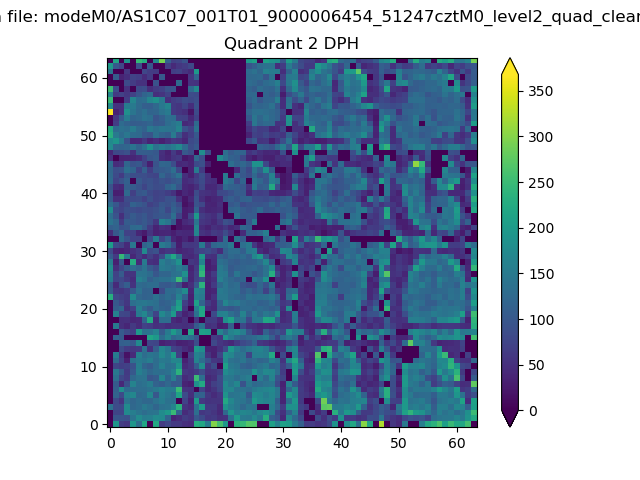 |
Quadrant C |
| Plot type | Count rate plots | Images |
|---|---|---|
| Comparison with Poisson distribution Blue bars denote a histogram of data divided into 1 sec bins. Red curve is a Poisson curve with rate = median count rate of data. |
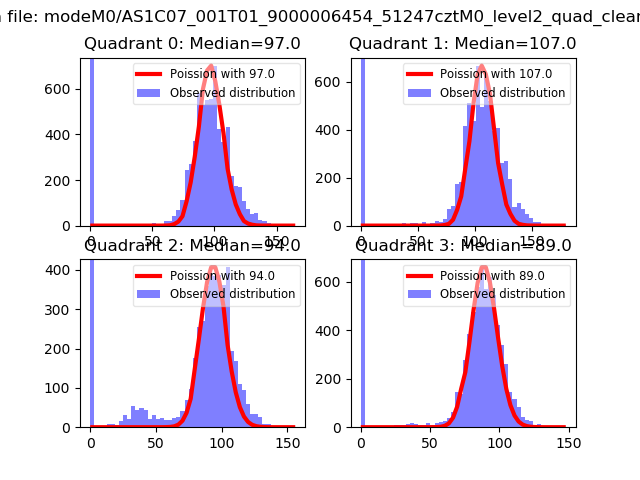 |
 |
| Quadrant-wise count rates Data is divided into 100 sec bins |
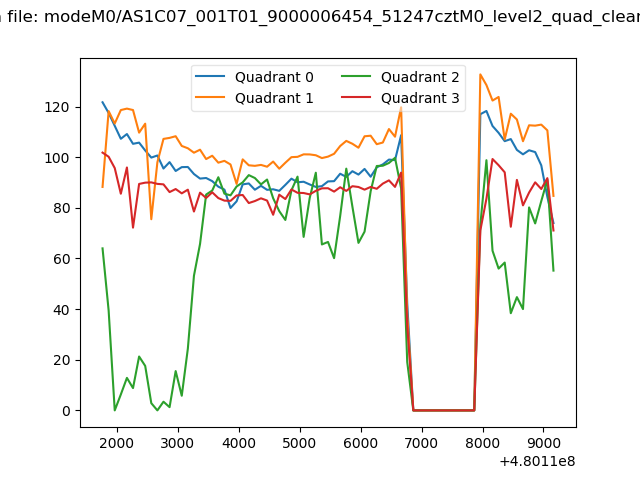 |
|
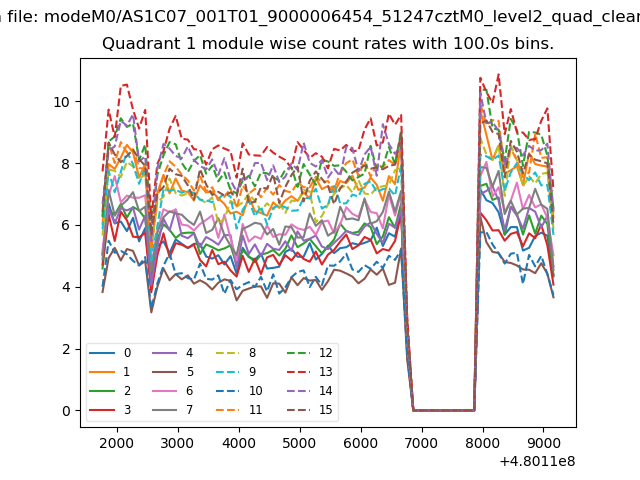
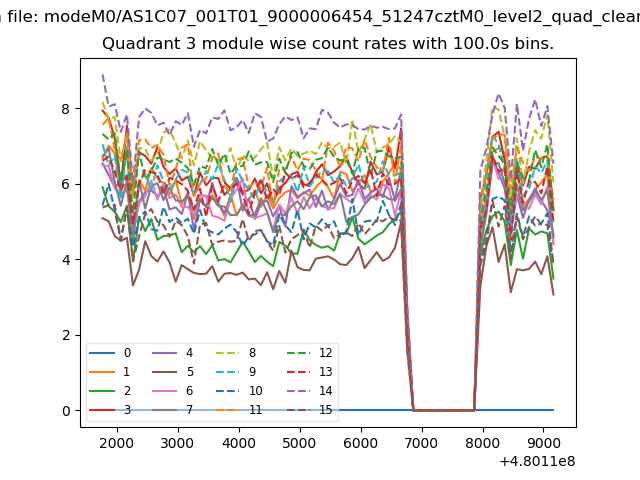
| Module-wise count rates for Quadrant A Data is divided into 100 sec bins |
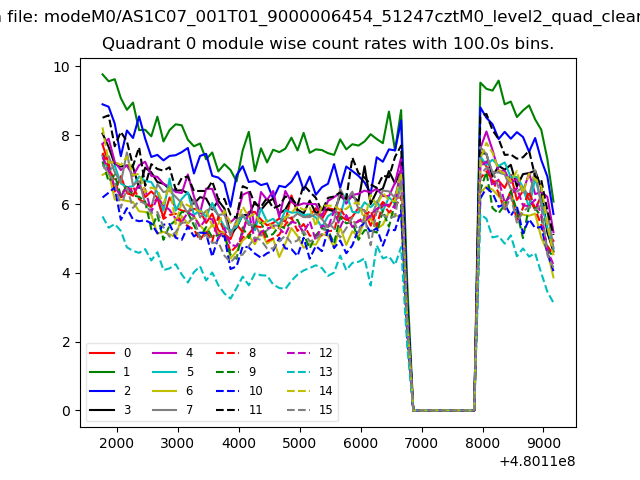 |
 |
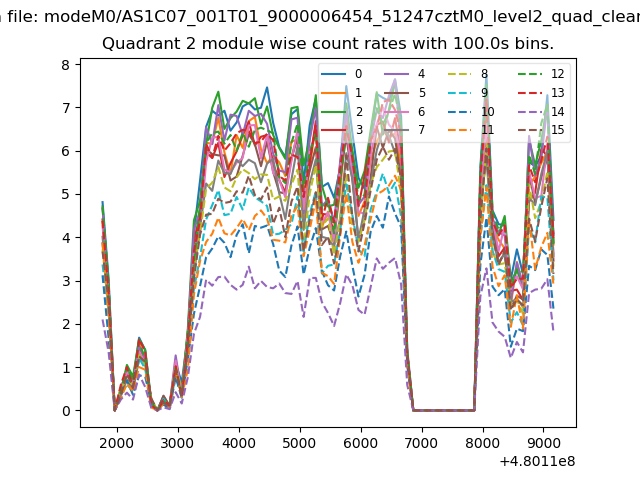
| Module-wise count rates for Quadrant B Data is divided into 100 sec bins |
 |
 |
| Module-wise count rates for Quadrant C Data is divided into 100 sec bins |
 |
 |
| Module-wise count rates for Quadrant D Data is divided into 100 sec bins |
 |
 |
| Parameter | Plot |
|---|---|
| CZT HV Monitor | 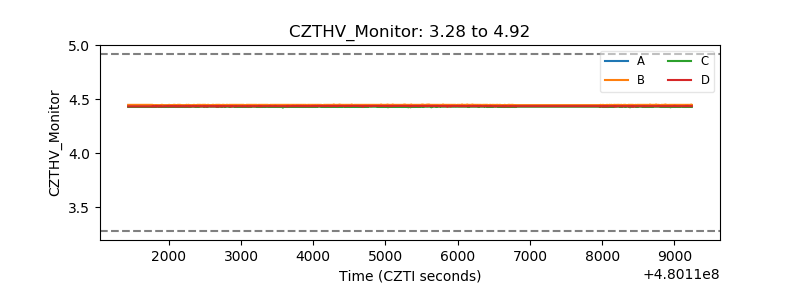 |
| D_VDD | 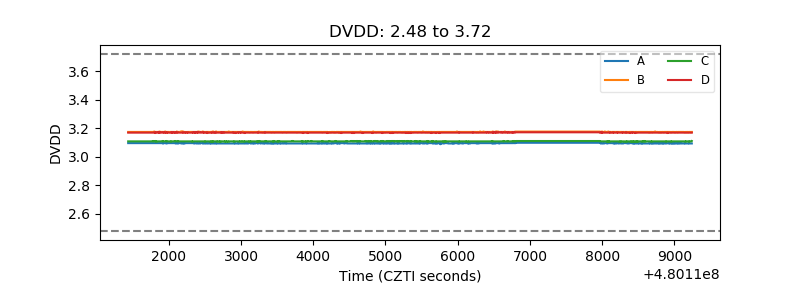 |
| Temperature 1 | 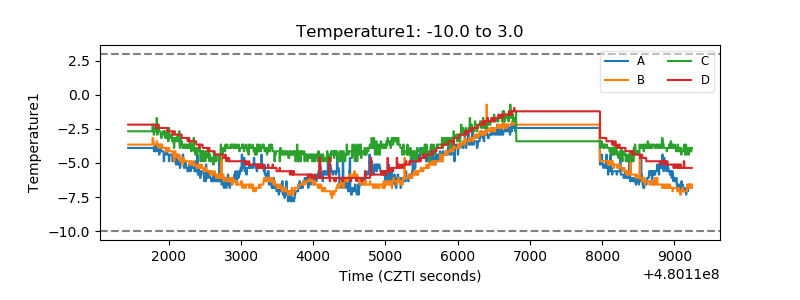 |
| Veto HV Monitor | 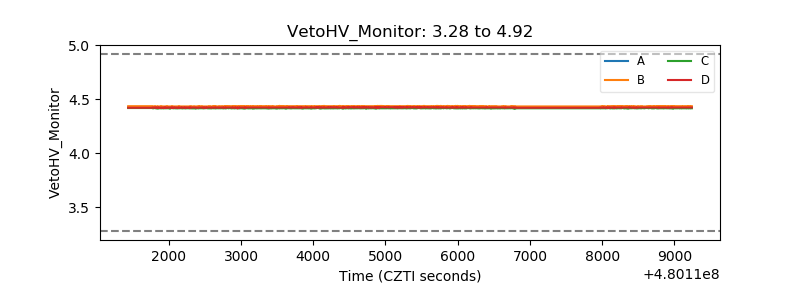 |
| Veto LLD | 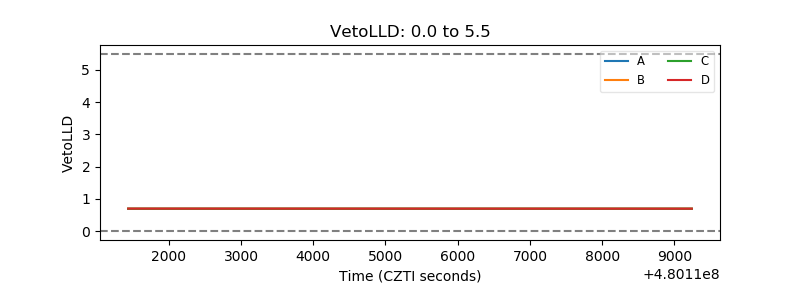 |
| Alpha Counter | 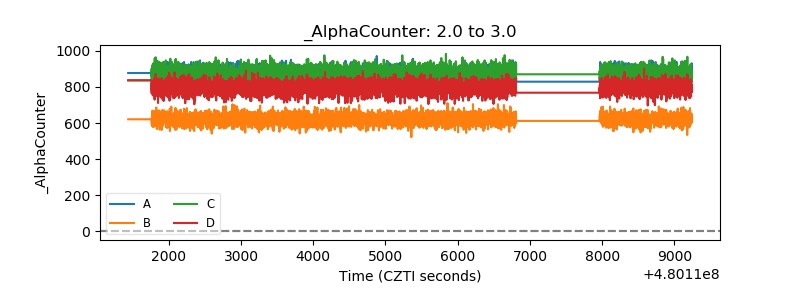 |
| _CPM_Rate | 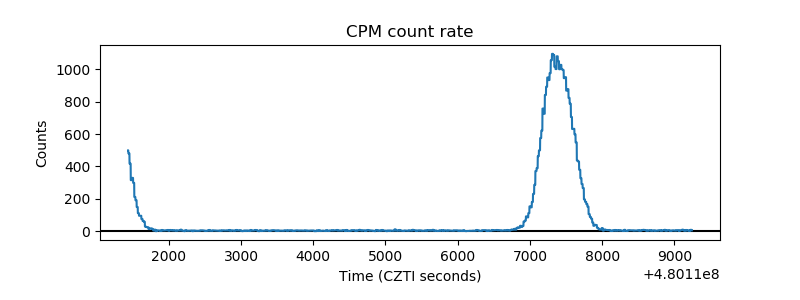 |
| CZT Counter | 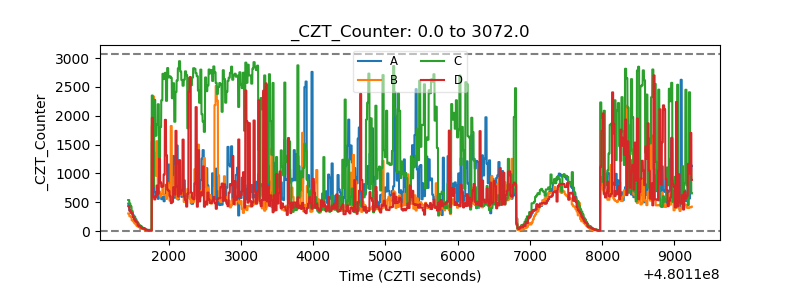 |
| +2.5 Volts monitor | 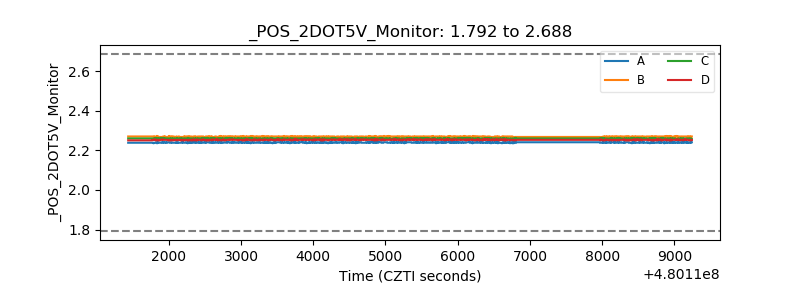 |
| +5 Volts monitor | 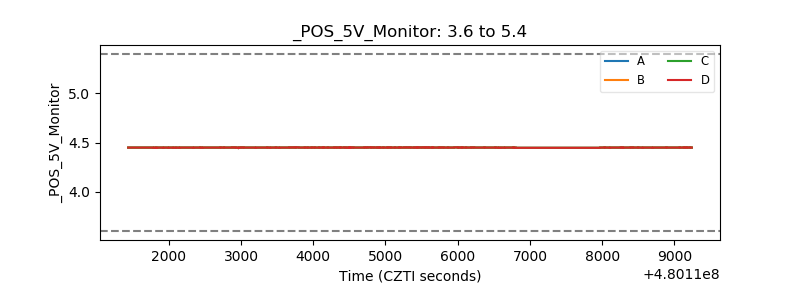 |
| _ROLL_ROT | 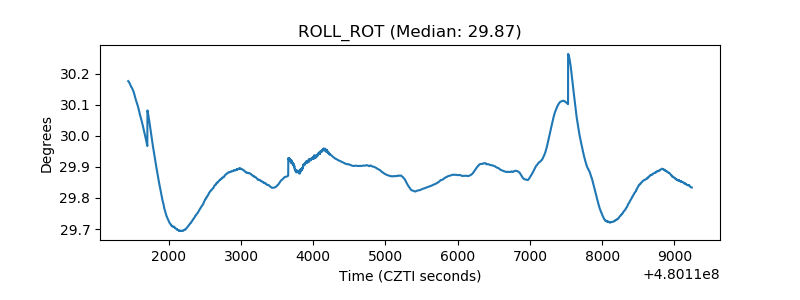 |
| _Roll_DEC | 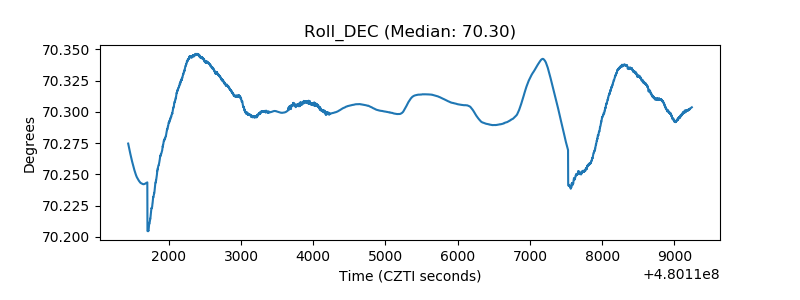 |
| _Roll_RA | 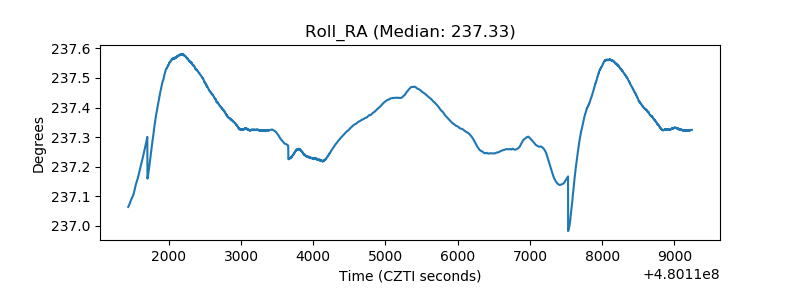 |
| Veto Counter | 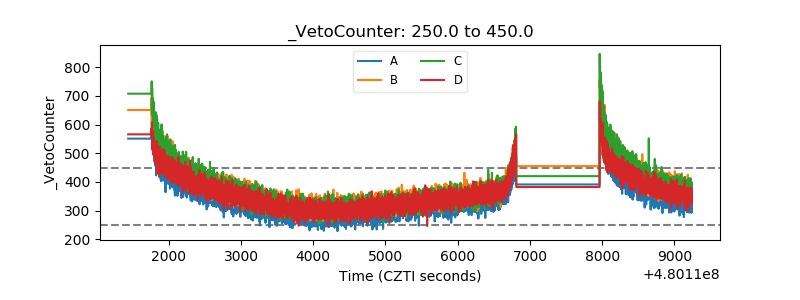 |