| Param | Original file | Final file |
|---|---|---|
| Filename | modeM0/AS1C07_001T01_9000006454_51248cztM0_level2.fits | modeM0/AS1C07_001T01_9000006454_51248cztM0_level2_quad_clean.evt |
| Size (bytes) | 595,560,960 | 91,972,800 |
| Size | 568.0 MB | 87.7 MB |
| Events in quadrant A | 5,175,905 | 611,334 |
| Events in quadrant B | 3,611,086 | 679,598 |
| Events in quadrant C | 7,828,421 | 502,326 |
| Events in quadrant D | 4,939,362 | 549,605 |
| Mode M0 | |||
|---|---|---|---|
| Quadrant | BADHDUFLAG | Total packets | Discarded packets |
| A | 0 | 19811 | 2 |
| B | 0 | 15195 | 2 |
| C | 0 | 27635 | 2 |
| D | 0 | 19203 | 2 |
| Mode SS | |||
|---|---|---|---|
| Quadrant | BADHDUFLAG | Total packets | Discarded packets |
| A | 0 | 128 | 0 |
| B | 0 | 128 | 0 |
| C | 0 | 128 | 0 |
| D | 0 | 128 | 0 |
| Mode M9 | |||
|---|---|---|---|
| Quadrant | BADHDUFLAG | Total packets | Discarded packets |
| A | 0 | 12 | 0 |
| B | 0 | 13 | 0 |
| C | 0 | 13 | 0 |
| D | 0 | 13 | 0 |
| Quadrant | Total seconds | Saturated seconds | Saturation percentage |
|---|---|---|---|
| A | 6338 | 185 | 2.918902% |
| B | 6338 | 129 | 2.035342% |
| C | 6338 | 1449 | 22.862102% |
| D | 6338 | 384 | 6.058694% |
Noise dominated data is calculated using 1-second bins in cleaned event files. If a bin has >2000 counts, and if more than 50% of those come from <1% of pixels, then it is considered to be noise-dominated and hence unusable.
| Quadrant | # 1 sec bins | Bins with >0 counts | Bins with >2000 counts | High rate bins dominated by noise | Noise dominated (total time) | Noise dominated (detector-on time) | Marked lightcurve |
|---|---|---|---|---|---|---|---|
| A | 7503 | 6340 | 127 | 127 | 1.69% | 2.00% | 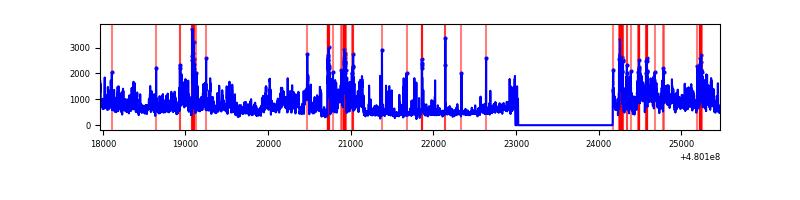 |
| B | 7503 | 6340 | 55 | 55 | 0.73% | 0.87% | 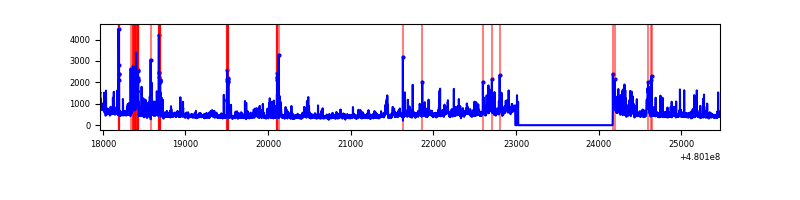 |
| C | 7503 | 6340 | 1250 | 1250 | 16.66% | 19.72% | 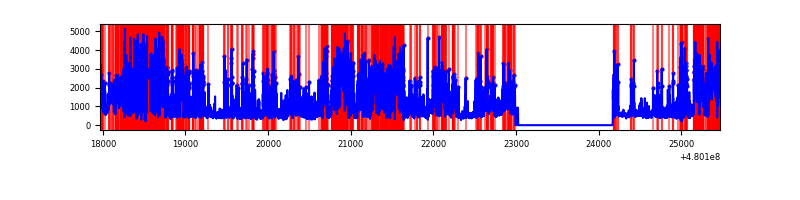 |
| D | 7503 | 6340 | 311 | 311 | 4.15% | 4.91% |  |
Top three noisy pixels from each quadrant. If the there are fewer than three noisy pixels in the level2.evt file, extra rows are filled as -1
| Pixel properties | Quadrant properties | ||||||
|---|---|---|---|---|---|---|---|
| Quadrant | DetID | PixID | Counts | Sigma | Mean | Median | Sigma |
| A | 12 | 3 | 1506086 | 8933.97 | 671 | 654 | 168.5 |
| A | 12 | 194 | 174404 | 1031.12 | 671 | 654 | 168.5 |
| A | 14 | 254 | 122462 | 722.87 | 671 | 654 | 168.5 |
| B | 10 | 254 | 217743 | 1517.3 | 676 | 653 | 143.1 |
| B | 8 | 128 | 193386 | 1347.06 | 676 | 653 | 143.1 |
| B | 7 | 252 | 163783 | 1140.16 | 676 | 653 | 143.1 |
| C | 4 | 12 | 4514879 | 26964.11 | 608 | 604 | 167.4 |
| C | 13 | 3 | 204383 | 1217.19 | 608 | 604 | 167.4 |
| C | 4 | 13 | 159108 | 946.76 | 608 | 604 | 167.4 |
| D | 8 | 176 | 503575 | 2774.51 | 638 | 613 | 181.3 |
| D | 10 | 172 | 463105 | 2551.26 | 638 | 613 | 181.3 |
| D | 3 | 12 | 374547 | 2062.75 | 638 | 613 | 181.3 |
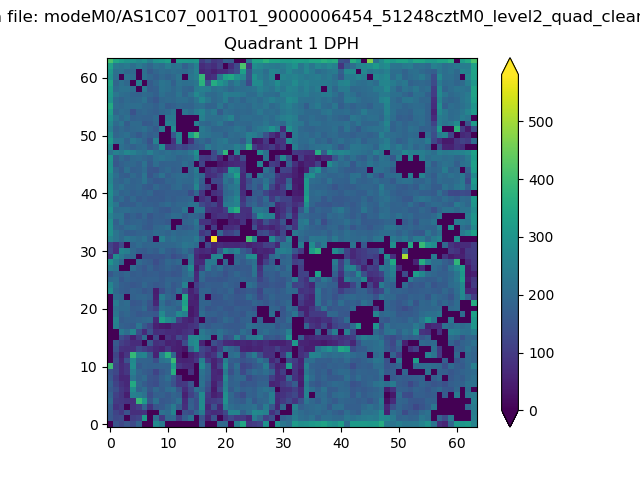
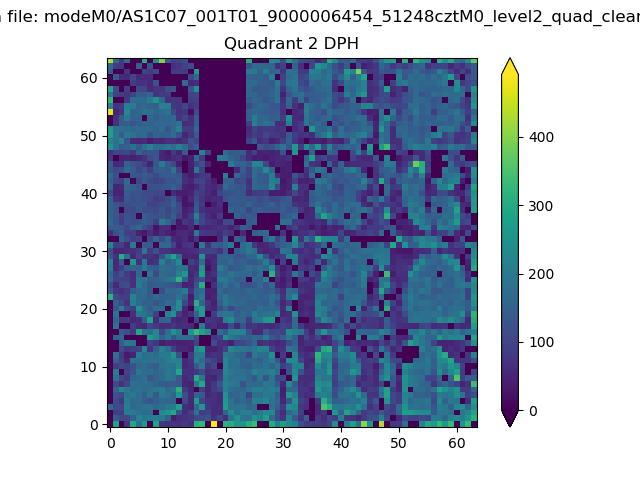
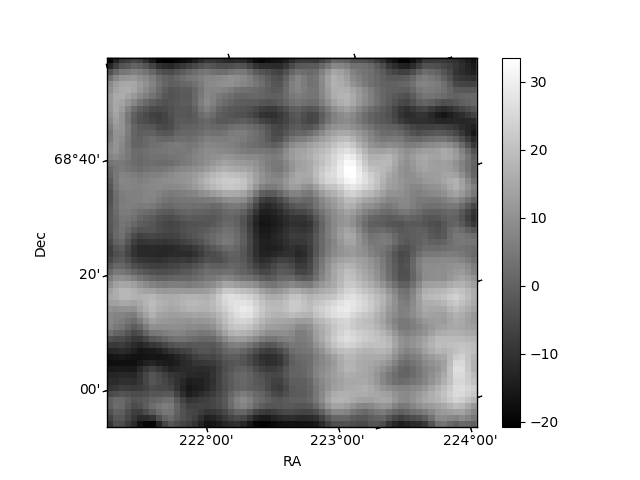
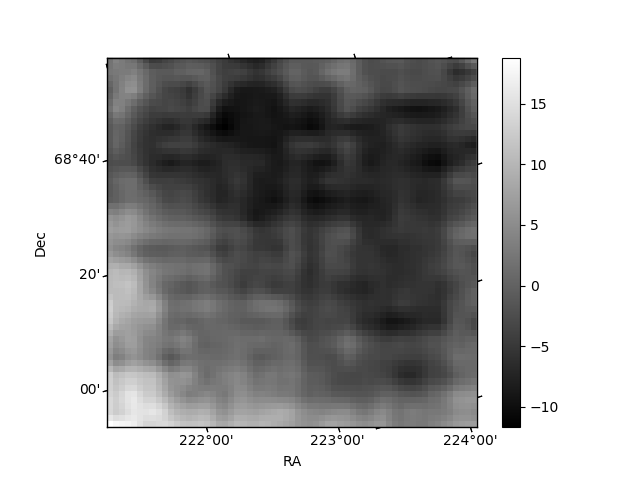
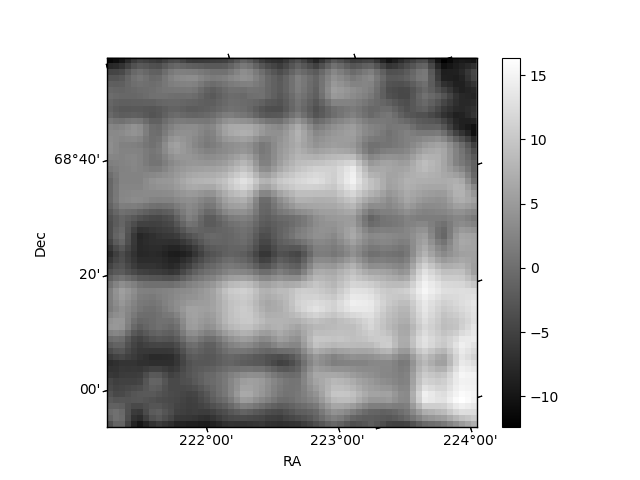
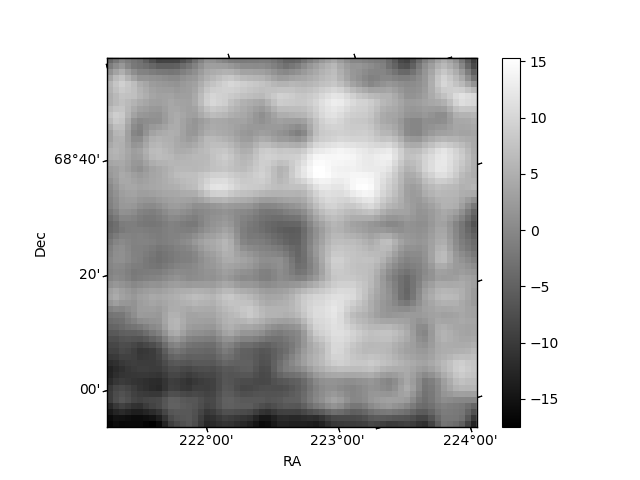
Histogram calculated using DETX and DETY for each event in the final _common_clean file
| Quadrant A | 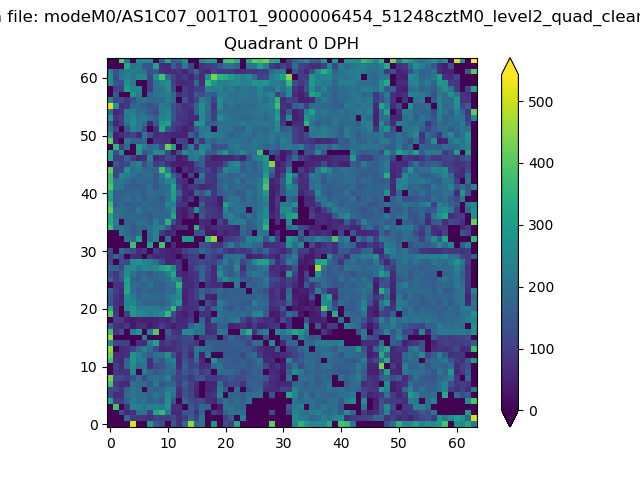 |
 |
Quadrant B |
|---|---|---|---|
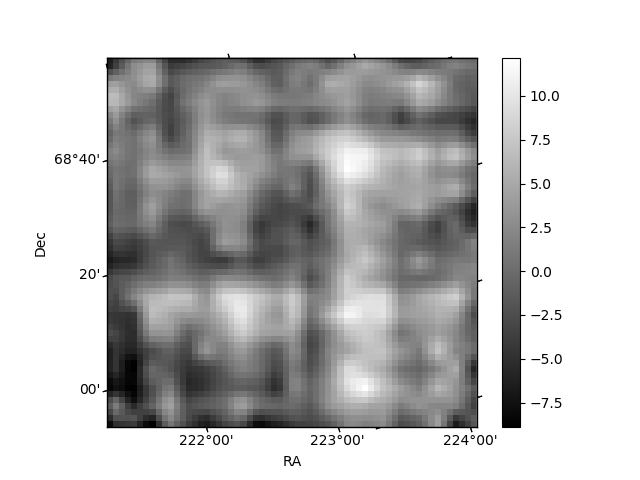
| Quadrant D | 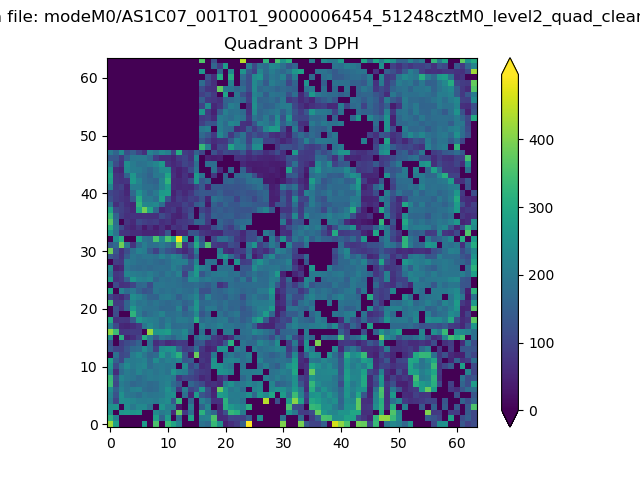 |
 |
Quadrant C |
| Plot type | Count rate plots | Images |
|---|---|---|
| Comparison with Poisson distribution Blue bars denote a histogram of data divided into 1 sec bins. Red curve is a Poisson curve with rate = median count rate of data. |
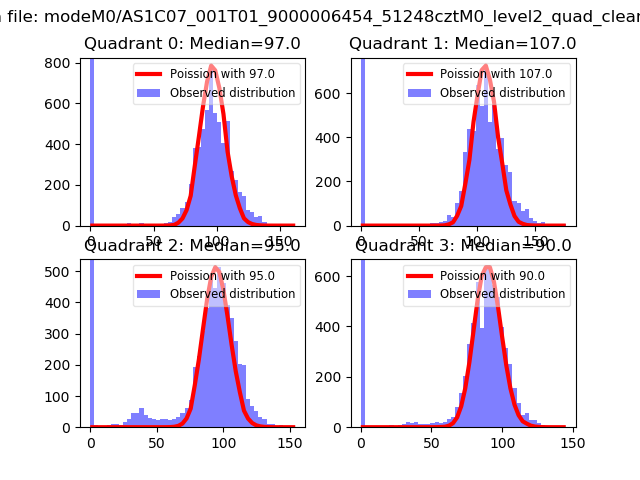 |
 |
| Quadrant-wise count rates Data is divided into 100 sec bins |
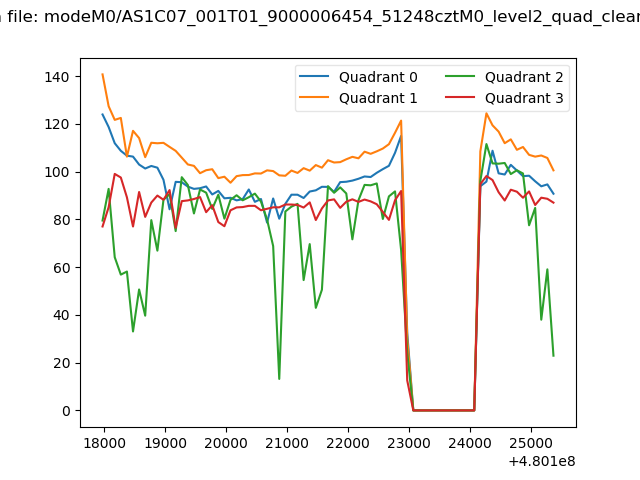 |
|
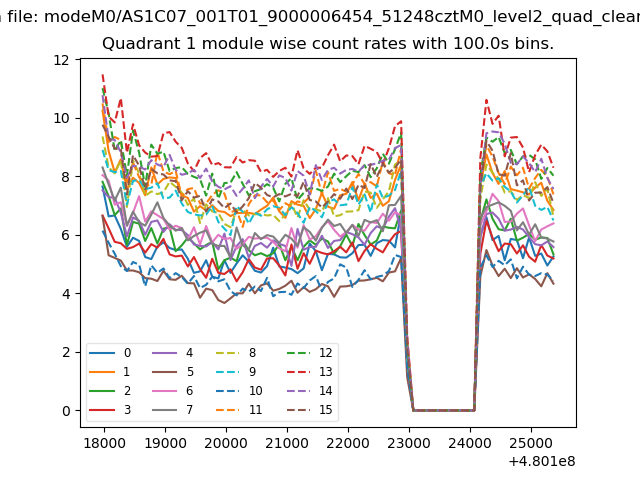
| Module-wise count rates for Quadrant A Data is divided into 100 sec bins |
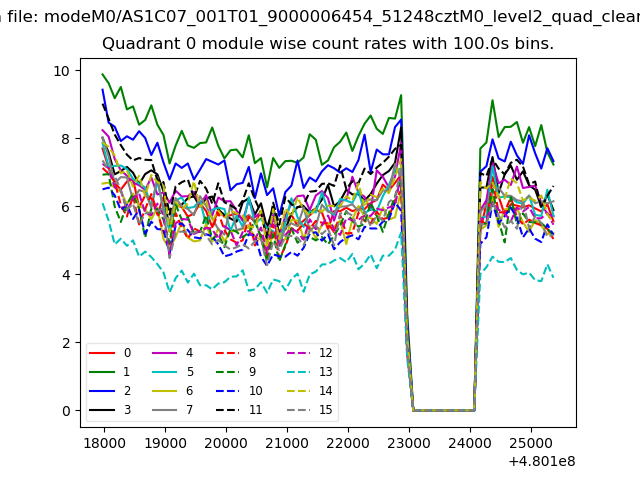 |
 |
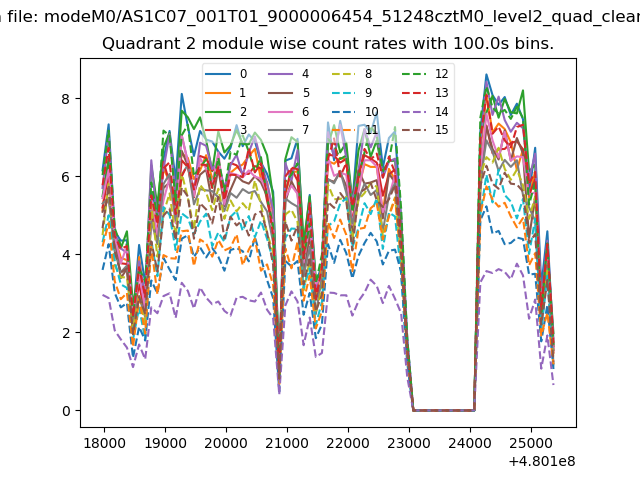
| Module-wise count rates for Quadrant B Data is divided into 100 sec bins |
 |
 |
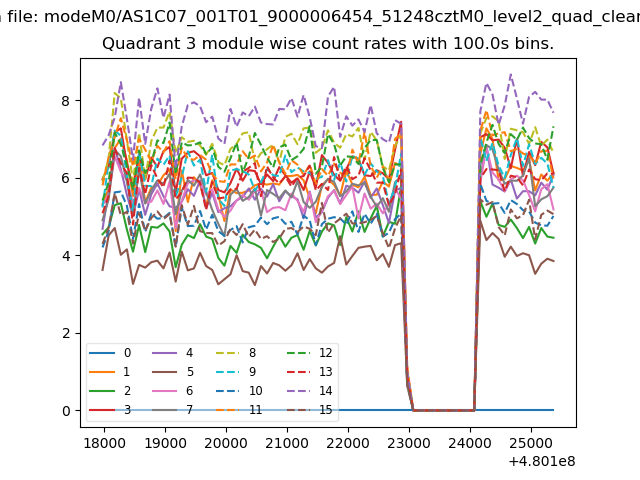
| Module-wise count rates for Quadrant C Data is divided into 100 sec bins |
 |
 |
| Module-wise count rates for Quadrant D Data is divided into 100 sec bins |
 |
 |
| Parameter | Plot |
|---|---|
| CZT HV Monitor | 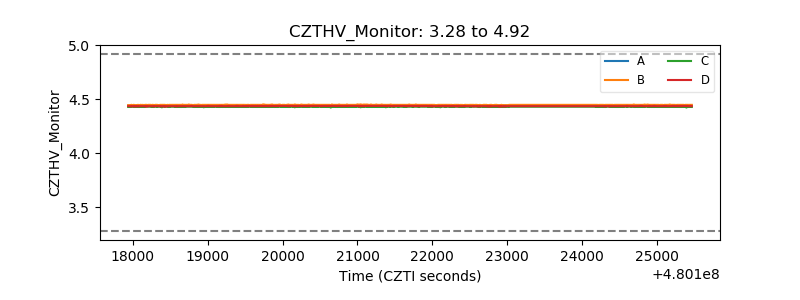 |
| D_VDD | 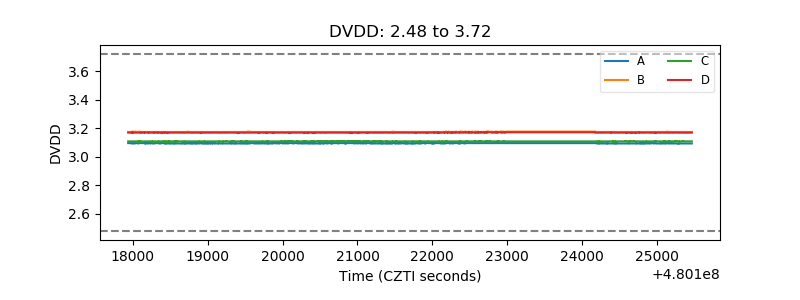 |
| Temperature 1 | 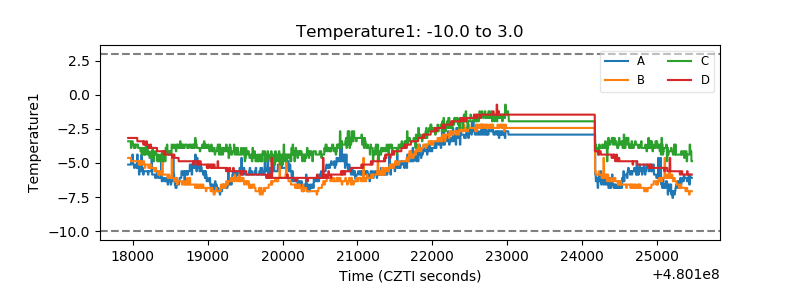 |
| Veto HV Monitor | 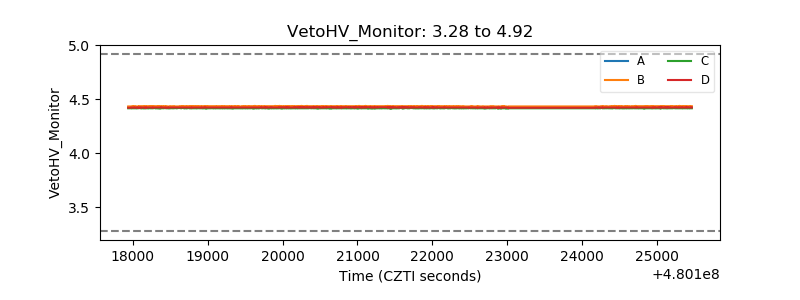 |
| Veto LLD | 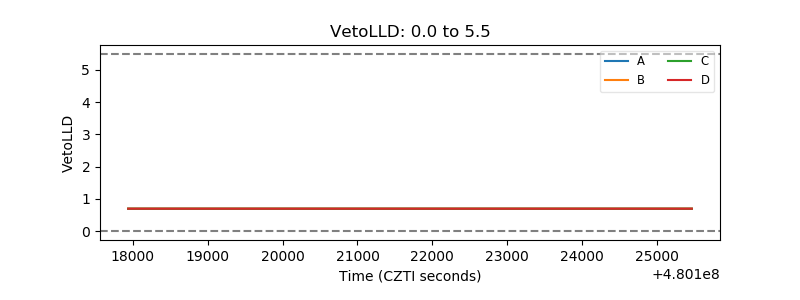 |
| Alpha Counter | 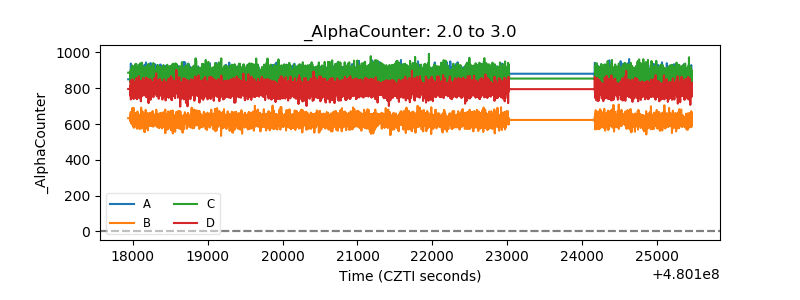 |
| _CPM_Rate | 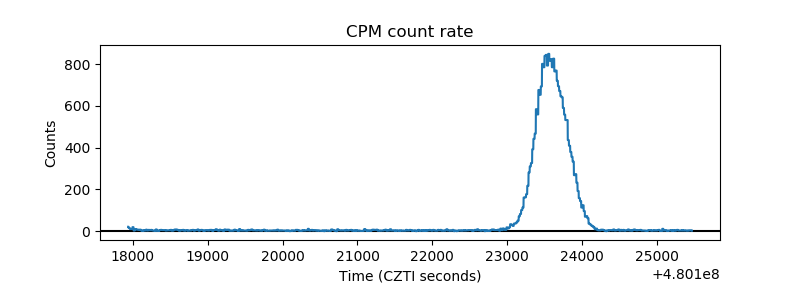 |
| CZT Counter | 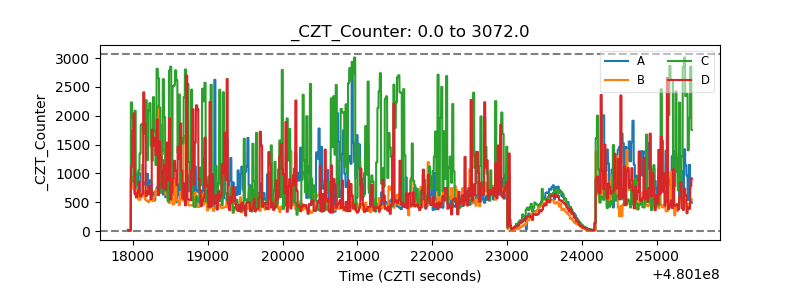 |
| +2.5 Volts monitor | 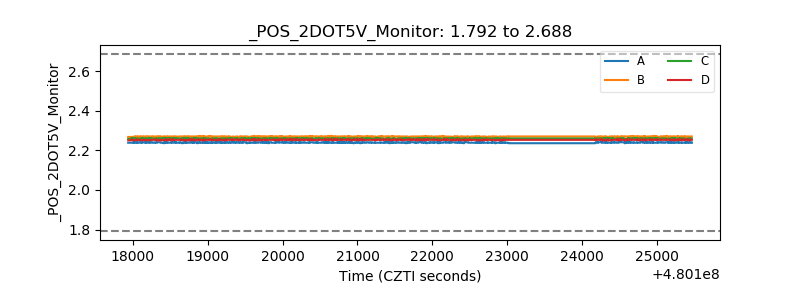 |
| +5 Volts monitor | 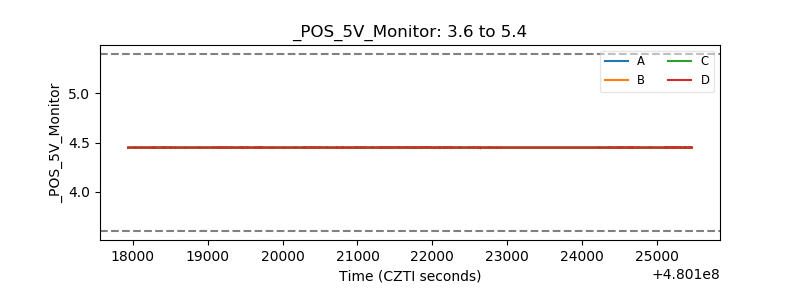 |
| _ROLL_ROT | 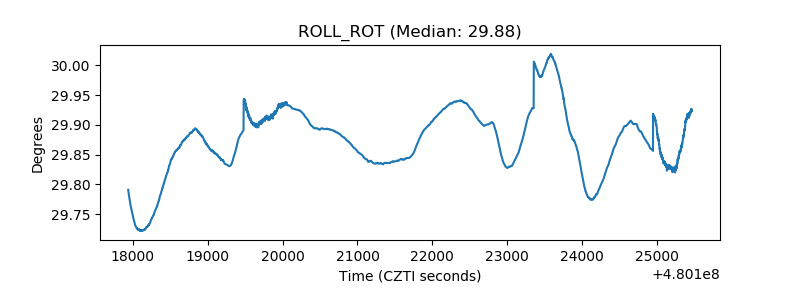 |
| _Roll_DEC | 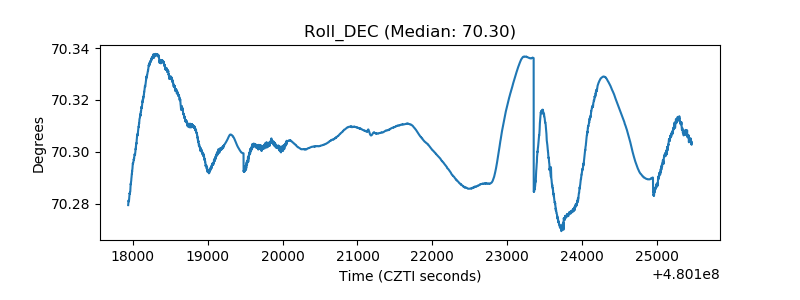 |
| _Roll_RA | 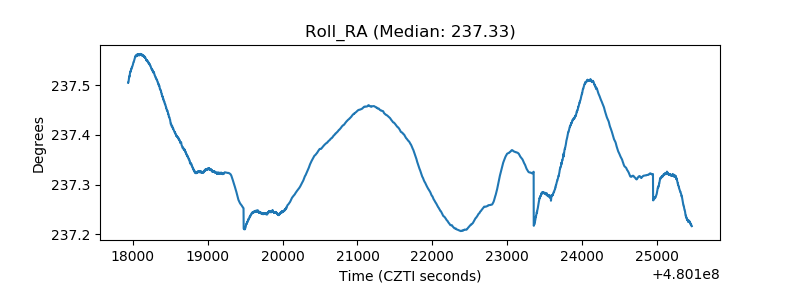 |
| Veto Counter | 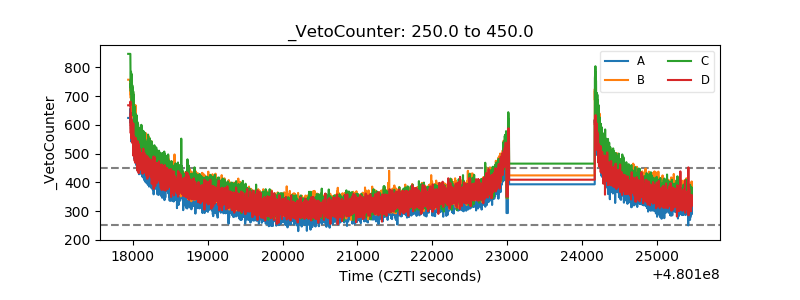 |