| Param | Original file | Final file |
|---|---|---|
| Filename | modeM0/AS1C07_001T01_9000006454_51249cztM0_level2.fits | modeM0/AS1C07_001T01_9000006454_51249cztM0_level2_quad_clean.evt |
| Size (bytes) | 693,541,440 | 93,706,560 |
| Size | 661.4 MB | 89.4 MB |
| Events in quadrant A | 5,778,672 | 640,701 |
| Events in quadrant B | 4,189,137 | 708,103 |
| Events in quadrant C | 10,401,237 | 436,454 |
| Events in quadrant D | 4,776,109 | 577,378 |
| Mode M0 | |||
|---|---|---|---|
| Quadrant | BADHDUFLAG | Total packets | Discarded packets |
| A | 0 | 22037 | 2 |
| B | 0 | 17202 | 2 |
| C | 0 | 35575 | 2 |
| D | 0 | 19290 | 2 |
| Mode SS | |||
|---|---|---|---|
| Quadrant | BADHDUFLAG | Total packets | Discarded packets |
| A | 0 | 138 | 0 |
| B | 0 | 138 | 0 |
| C | 0 | 138 | 0 |
| D | 0 | 138 | 0 |
| Mode M9 | |||
|---|---|---|---|
| Quadrant | BADHDUFLAG | Total packets | Discarded packets |
| A | 0 | 21 | 0 |
| B | 0 | 22 | 0 |
| C | 0 | 22 | 0 |
| D | 0 | 22 | 0 |
| Quadrant | Total seconds | Saturated seconds | Saturation percentage |
|---|---|---|---|
| A | 6812 | 178 | 2.613036% |
| B | 6812 | 195 | 2.862595% |
| C | 6812 | 2591 | 38.035819% |
| D | 6812 | 377 | 5.534351% |
Noise dominated data is calculated using 1-second bins in cleaned event files. If a bin has >2000 counts, and if more than 50% of those come from <1% of pixels, then it is considered to be noise-dominated and hence unusable.
| Quadrant | # 1 sec bins | Bins with >0 counts | Bins with >2000 counts | High rate bins dominated by noise | Noise dominated (total time) | Noise dominated (detector-on time) | Marked lightcurve |
|---|---|---|---|---|---|---|---|
| A | 7922 | 6813 | 117 | 117 | 1.48% | 1.72% | 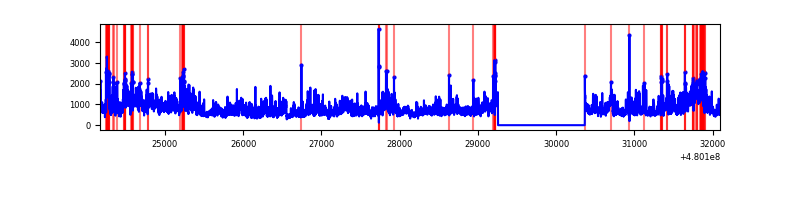 |
| B | 7922 | 6813 | 104 | 104 | 1.31% | 1.53% | 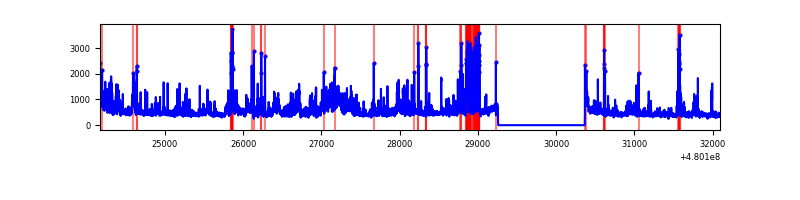 |
| C | 7922 | 6813 | 2289 | 2289 | 28.89% | 33.60% | 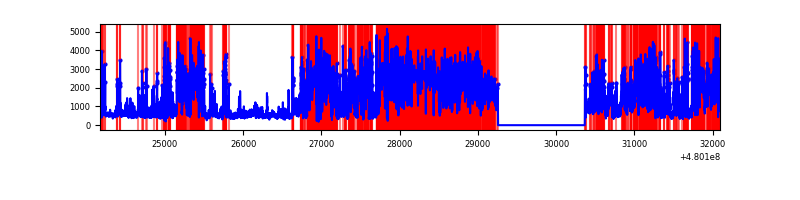 |
| D | 7922 | 6813 | 333 | 333 | 4.20% | 4.89% |  |
Top three noisy pixels from each quadrant. If the there are fewer than three noisy pixels in the level2.evt file, extra rows are filled as -1
| Pixel properties | Quadrant properties | ||||||
|---|---|---|---|---|---|---|---|
| Quadrant | DetID | PixID | Counts | Sigma | Mean | Median | Sigma |
| A | 12 | 3 | 2124745 | 12140.24 | 703 | 686 | 175.0 |
| A | 12 | 194 | 243828 | 1389.7 | 703 | 686 | 175.0 |
| A | 8 | 10 | 120481 | 684.7 | 703 | 686 | 175.0 |
| B | 10 | 254 | 493936 | 3313.34 | 708 | 684 | 148.9 |
| B | 10 | 14 | 291164 | 1951.25 | 708 | 684 | 148.9 |
| B | 7 | 252 | 193964 | 1298.33 | 708 | 684 | 148.9 |
| C | 4 | 12 | 6759048 | 41973.92 | 575 | 568 | 161.0 |
| C | 13 | 3 | 724146 | 4493.82 | 575 | 568 | 161.0 |
| C | 14 | 245 | 191744 | 1187.31 | 575 | 568 | 161.0 |
| D | 3 | 12 | 588931 | 3162.17 | 664 | 641 | 186.0 |
| D | 8 | 176 | 474036 | 2544.59 | 664 | 641 | 186.0 |
| D | 2 | 216 | 431953 | 2318.38 | 664 | 641 | 186.0 |
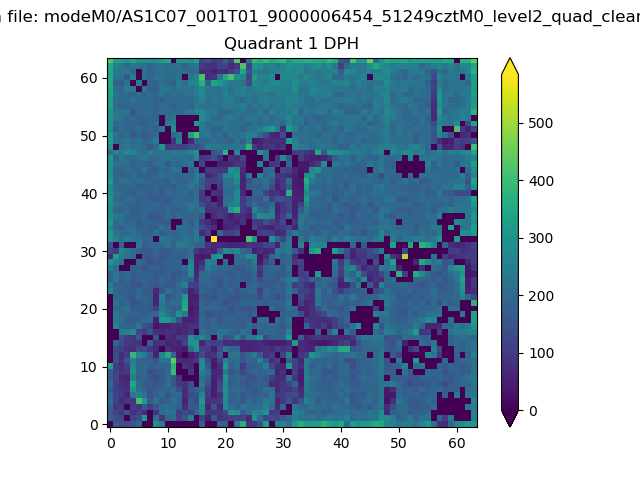
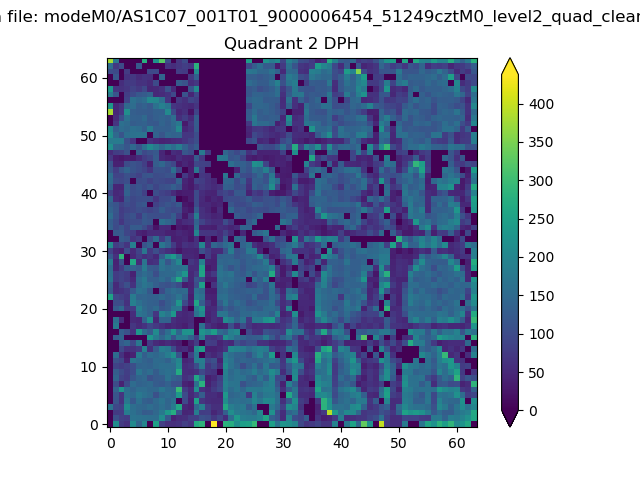
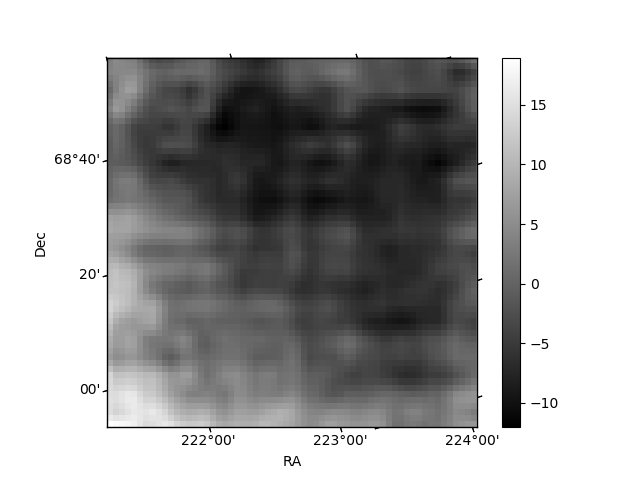
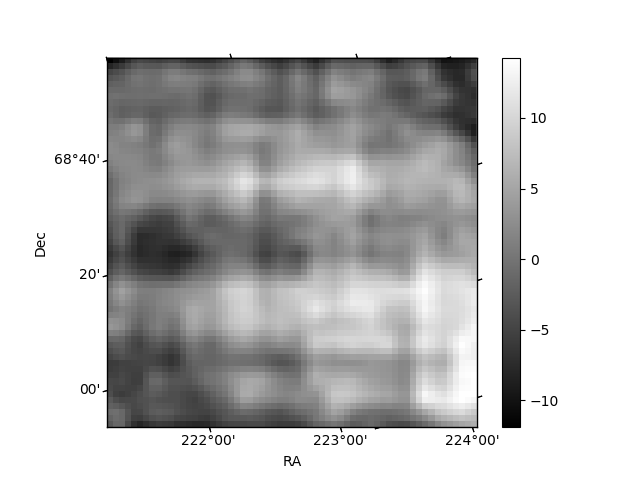
Histogram calculated using DETX and DETY for each event in the final _common_clean file
| Quadrant A | 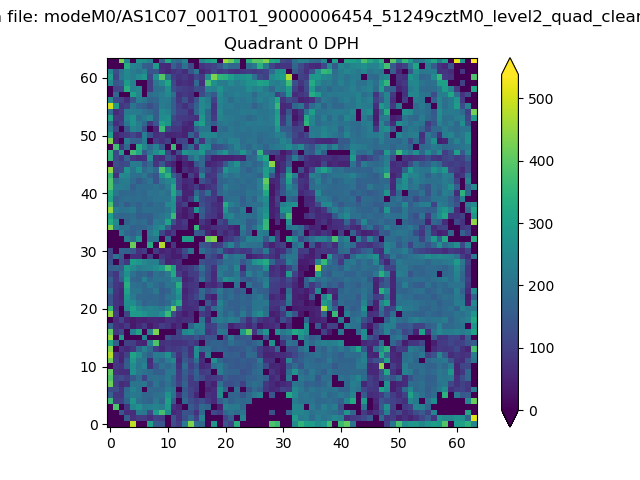 |
 |
Quadrant B |
|---|---|---|---|
| Quadrant D | 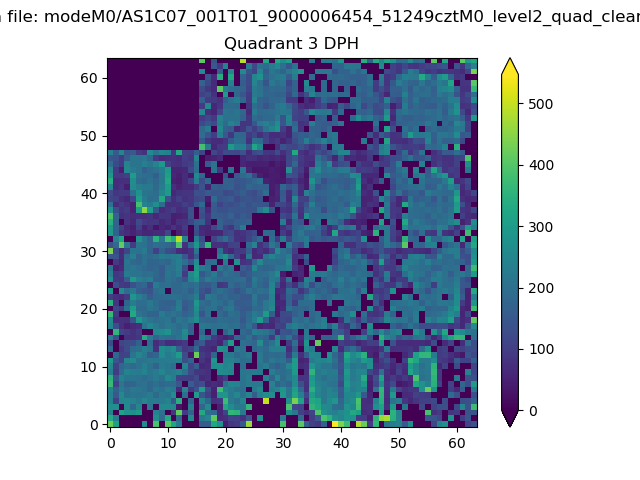 |
 |
Quadrant C |
| Plot type | Count rate plots | Images |
|---|---|---|
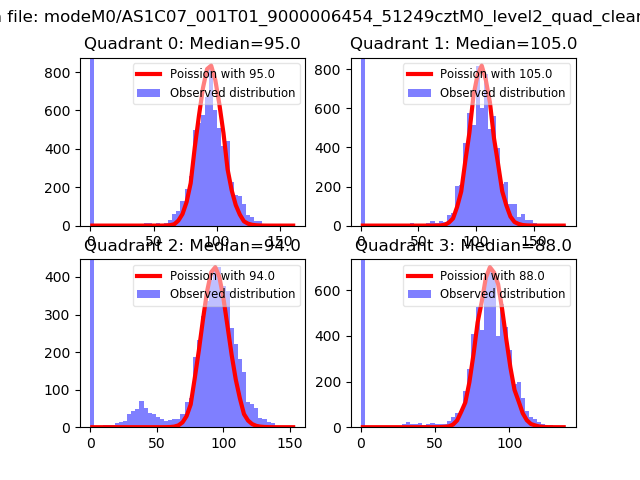
| Comparison with Poisson distribution Blue bars denote a histogram of data divided into 1 sec bins. Red curve is a Poisson curve with rate = median count rate of data. |
 |
 |
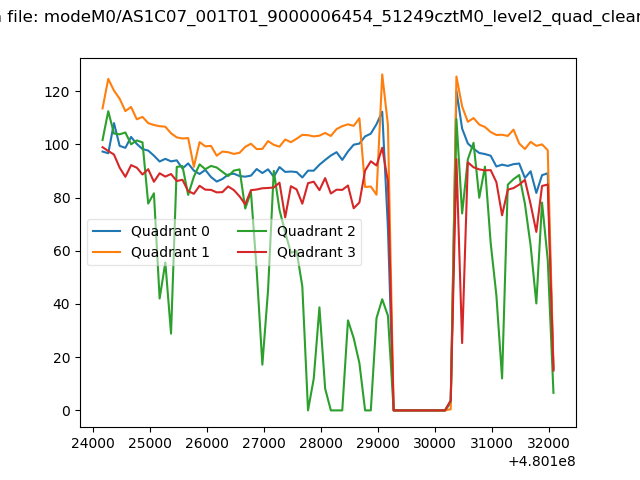
| Quadrant-wise count rates Data is divided into 100 sec bins |
 |
|
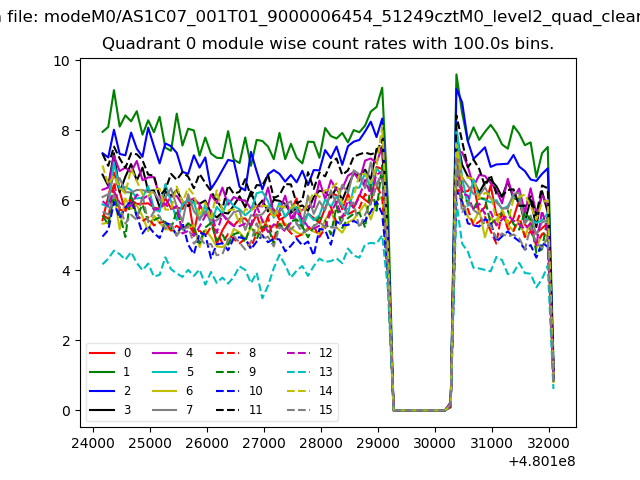
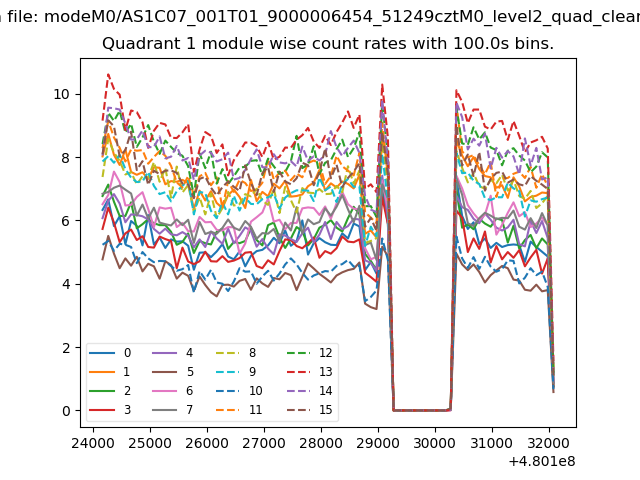
| Module-wise count rates for Quadrant A Data is divided into 100 sec bins |
 |
 |
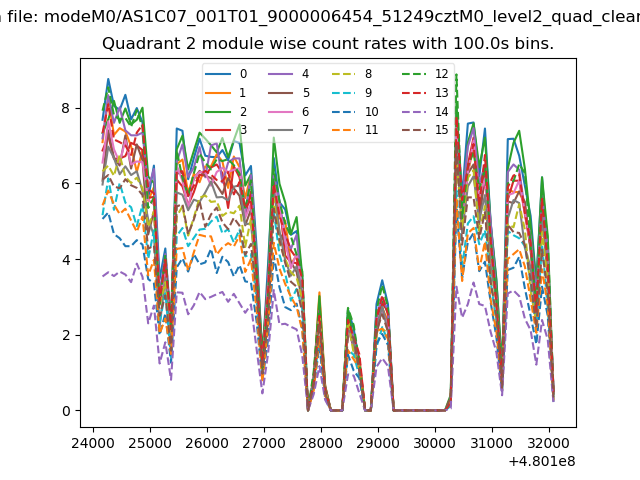
| Module-wise count rates for Quadrant B Data is divided into 100 sec bins |
 |
 |
| Module-wise count rates for Quadrant C Data is divided into 100 sec bins |
 |
 |
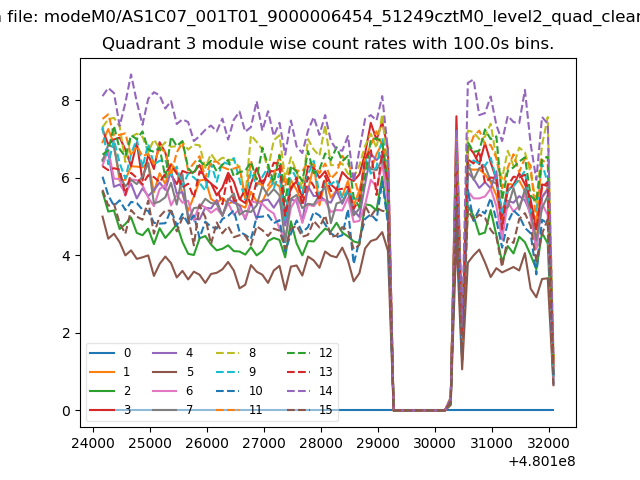
| Module-wise count rates for Quadrant D Data is divided into 100 sec bins |
 |
 |
| Parameter | Plot |
|---|---|
| CZT HV Monitor | 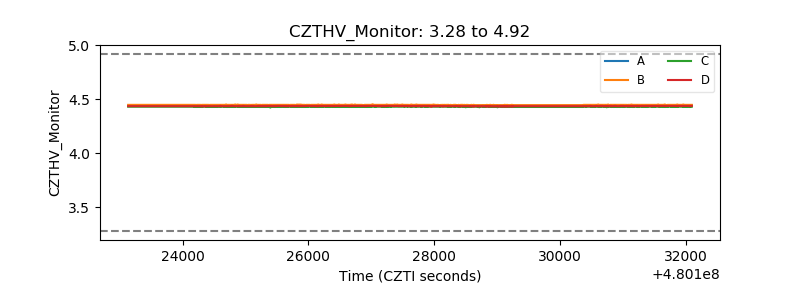 |
| D_VDD | 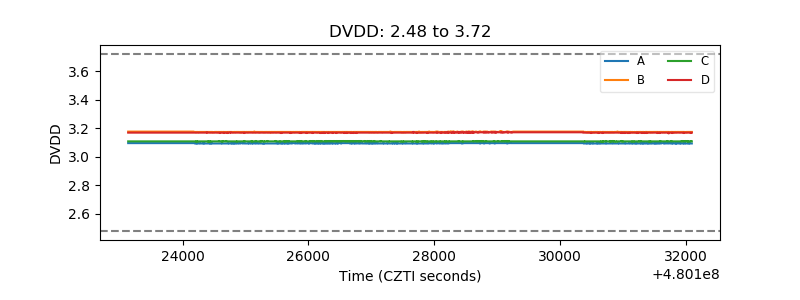 |
| Temperature 1 | 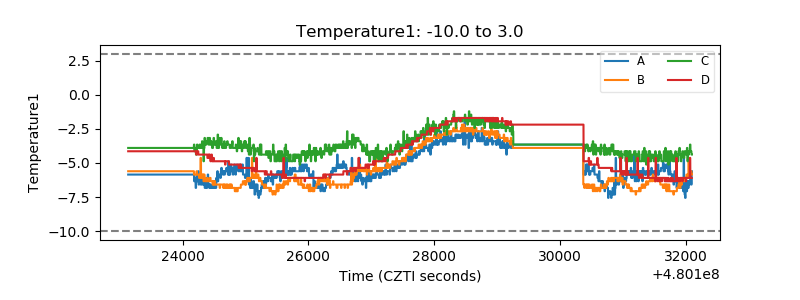 |
| Veto HV Monitor | 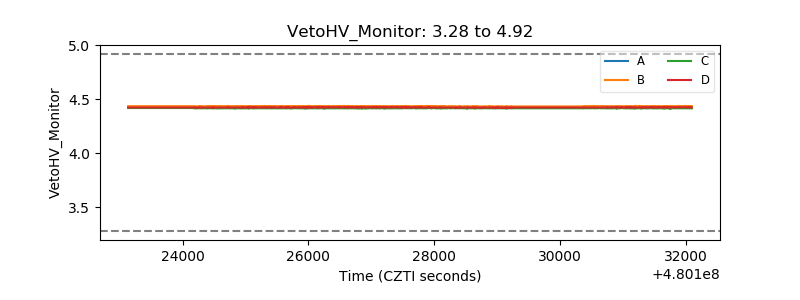 |
| Veto LLD | 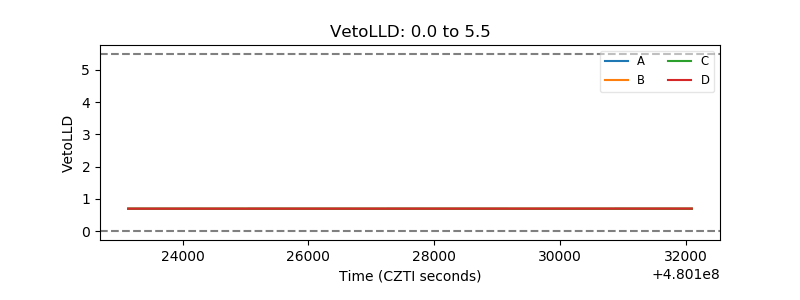 |
| Alpha Counter | 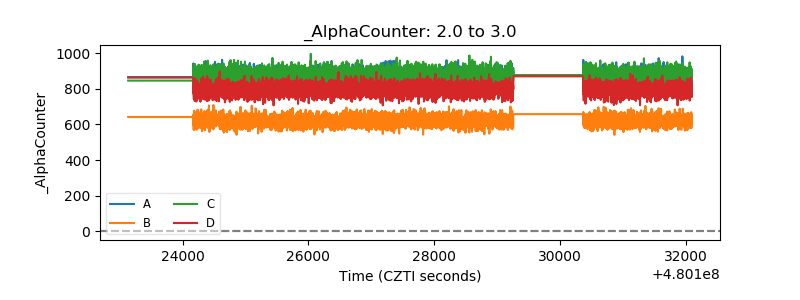 |
| _CPM_Rate | 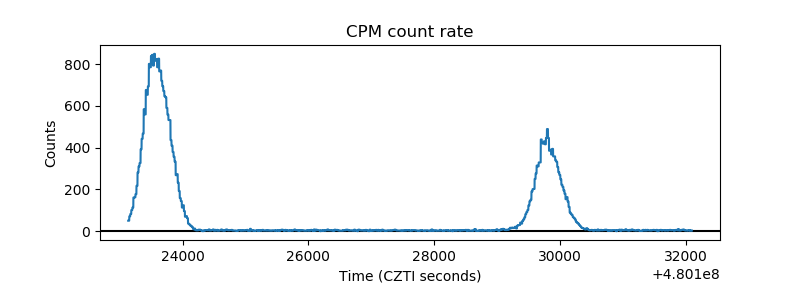 |
| CZT Counter | 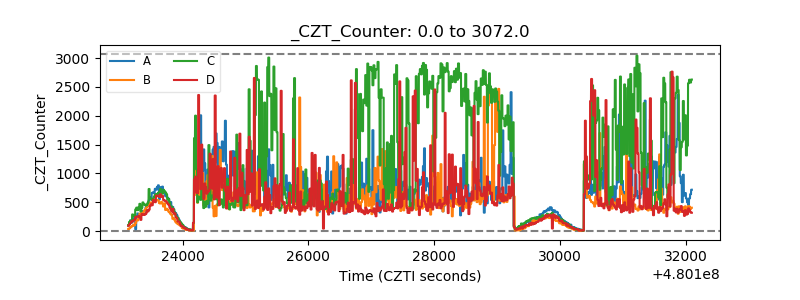 |
| +2.5 Volts monitor | 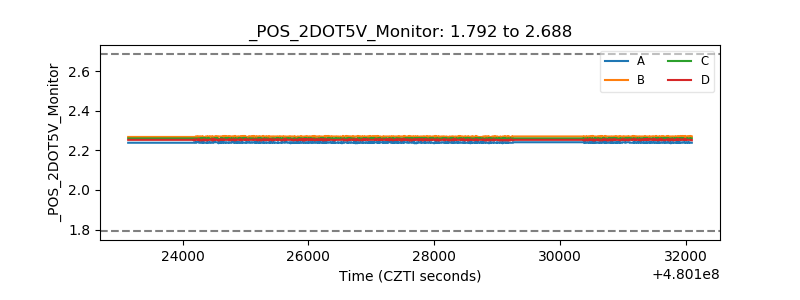 |
| +5 Volts monitor | 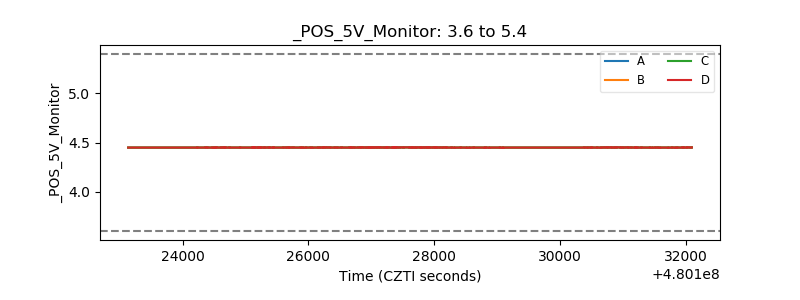 |
| _ROLL_ROT | 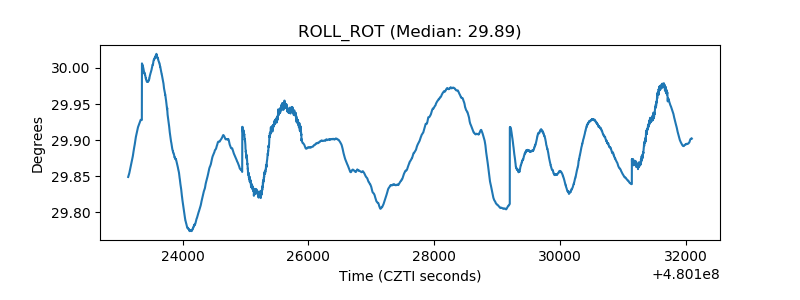 |
| _Roll_DEC | 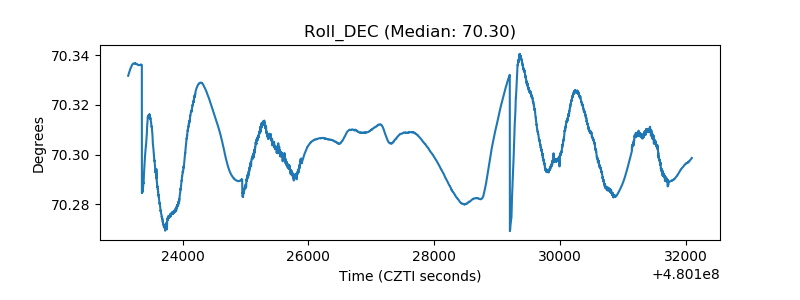 |
| _Roll_RA | 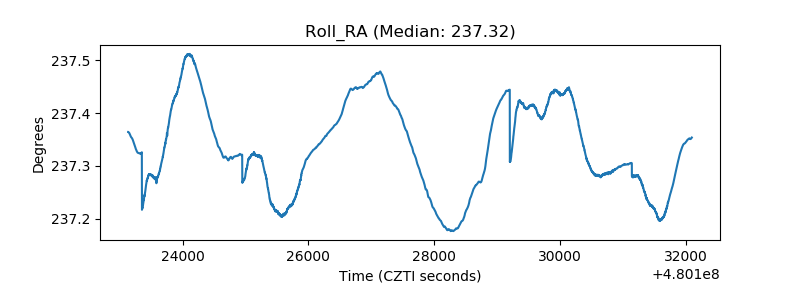 |
| Veto Counter | 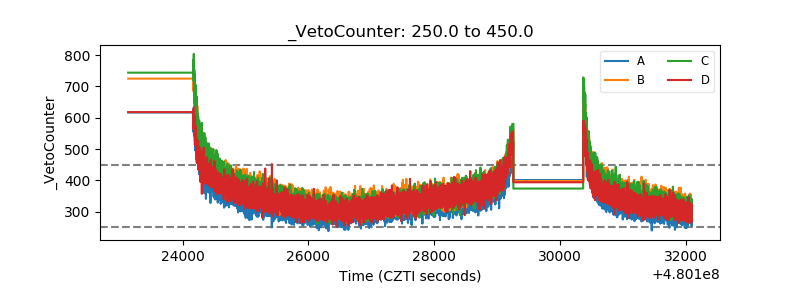 |