| Param | Original file | Final file |
|---|---|---|
| Filename | modeM0/AS1C07_001T01_9000006454_51250cztM0_level2.fits | modeM0/AS1C07_001T01_9000006454_51250cztM0_level2_quad_clean.evt |
| Size (bytes) | 573,658,560 | 85,029,120 |
| Size | 547.1 MB | 81.1 MB |
| Events in quadrant A | 5,106,383 | 571,578 |
| Events in quadrant B | 3,209,485 | 630,460 |
| Events in quadrant C | 8,702,380 | 420,243 |
| Events in quadrant D | 3,735,263 | 518,388 |
| Mode M0 | |||
|---|---|---|---|
| Quadrant | BADHDUFLAG | Total packets | Discarded packets |
| A | 0 | 19490 | 1 |
| B | 0 | 14157 | 2 |
| C | 0 | 30133 | 1 |
| D | 0 | 15911 | 1 |
| Mode SS | |||
|---|---|---|---|
| Quadrant | BADHDUFLAG | Total packets | Discarded packets |
| A | 0 | 128 | 0 |
| B | 0 | 128 | 0 |
| C | 0 | 128 | 0 |
| D | 0 | 128 | 0 |
| Mode M9 | |||
|---|---|---|---|
| Quadrant | BADHDUFLAG | Total packets | Discarded packets |
| A | 0 | 9 | 0 |
| B | 0 | 9 | 0 |
| C | 0 | 9 | 0 |
| D | 0 | 9 | 0 |
| Quadrant | Total seconds | Saturated seconds | Saturation percentage |
|---|---|---|---|
| A | 6209 | 137 | 2.206474% |
| B | 6209 | 116 | 1.868256% |
| C | 6209 | 1922 | 30.955065% |
| D | 6209 | 233 | 3.752617% |
Noise dominated data is calculated using 1-second bins in cleaned event files. If a bin has >2000 counts, and if more than 50% of those come from <1% of pixels, then it is considered to be noise-dominated and hence unusable.
| Quadrant | # 1 sec bins | Bins with >0 counts | Bins with >2000 counts | High rate bins dominated by noise | Noise dominated (total time) | Noise dominated (detector-on time) | Marked lightcurve |
|---|---|---|---|---|---|---|---|
| A | 7114 | 6210 | 85 | 85 | 1.19% | 1.37% | 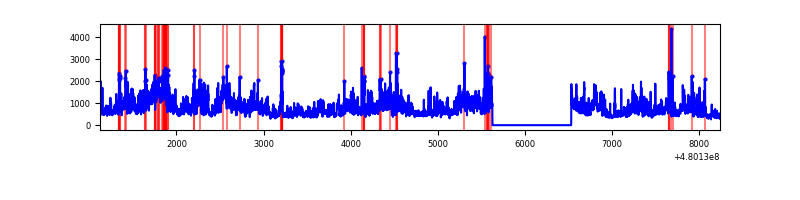 |
| B | 7114 | 6210 | 53 | 53 | 0.75% | 0.85% | 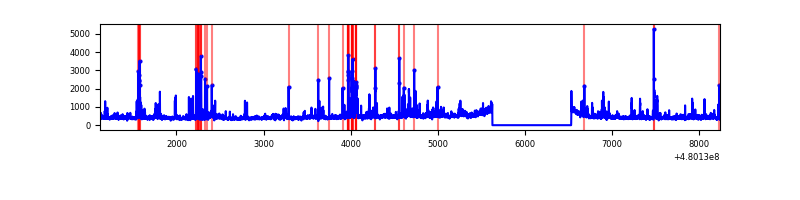 |
| C | 7114 | 6210 | 1746 | 1746 | 24.54% | 28.12% | 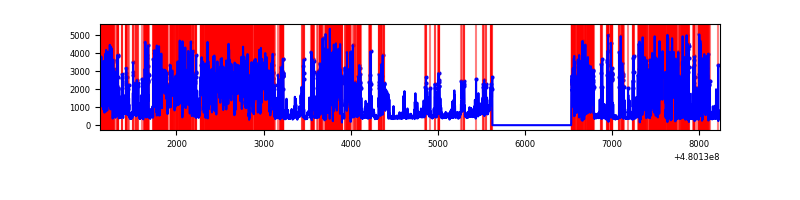 |
| D | 7114 | 6210 | 195 | 195 | 2.74% | 3.14% |  |
Top three noisy pixels from each quadrant. If the there are fewer than three noisy pixels in the level2.evt file, extra rows are filled as -1
| Pixel properties | Quadrant properties | ||||||
|---|---|---|---|---|---|---|---|
| Quadrant | DetID | PixID | Counts | Sigma | Mean | Median | Sigma |
| A | 12 | 3 | 1782693 | 11228.04 | 632 | 615 | 158.7 |
| A | 12 | 194 | 207114 | 1301.05 | 632 | 615 | 158.7 |
| A | 14 | 254 | 157800 | 990.35 | 632 | 615 | 158.7 |
| B | 8 | 128 | 175210 | 1284.21 | 635 | 613 | 136.0 |
| B | 7 | 252 | 159384 | 1167.81 | 635 | 613 | 136.0 |
| B | 10 | 254 | 59331 | 431.89 | 635 | 613 | 136.0 |
| C | 4 | 12 | 5588257 | 37969.53 | 537 | 534 | 147.2 |
| C | 13 | 3 | 800543 | 5436.2 | 537 | 534 | 147.2 |
| C | 3 | 233 | 68128 | 459.31 | 537 | 534 | 147.2 |
| D | 3 | 12 | 468432 | 2776.65 | 599 | 578 | 168.5 |
| D | 2 | 216 | 164916 | 975.32 | 599 | 578 | 168.5 |
| D | 10 | 181 | 148319 | 876.82 | 599 | 578 | 168.5 |
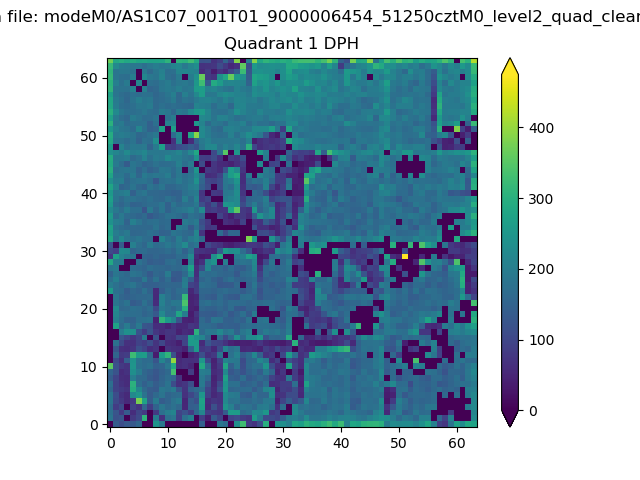
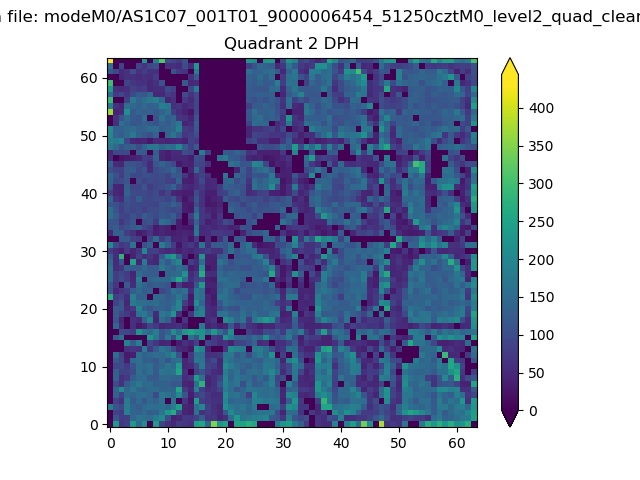
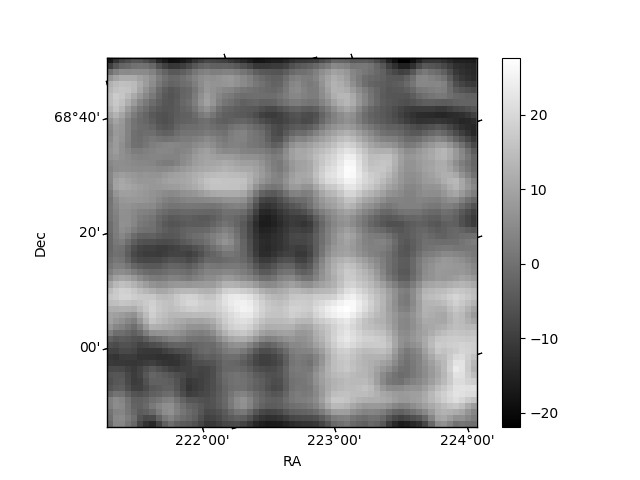
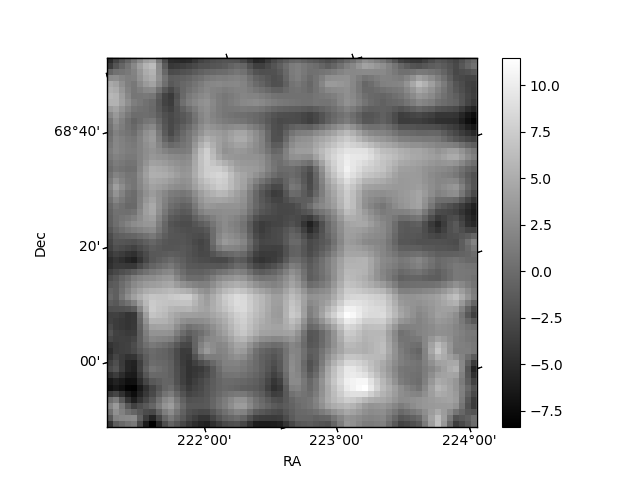
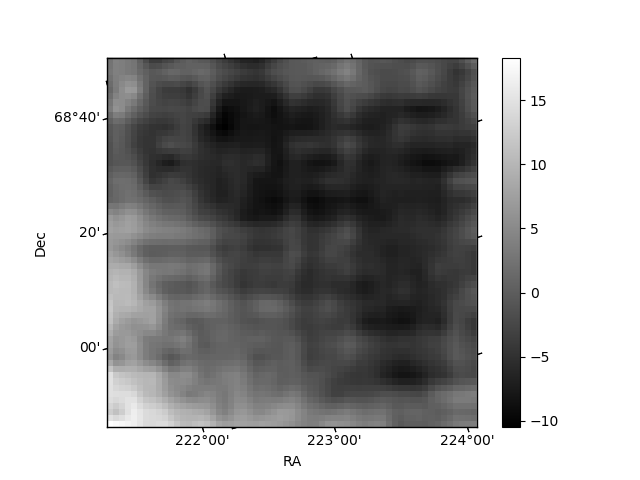
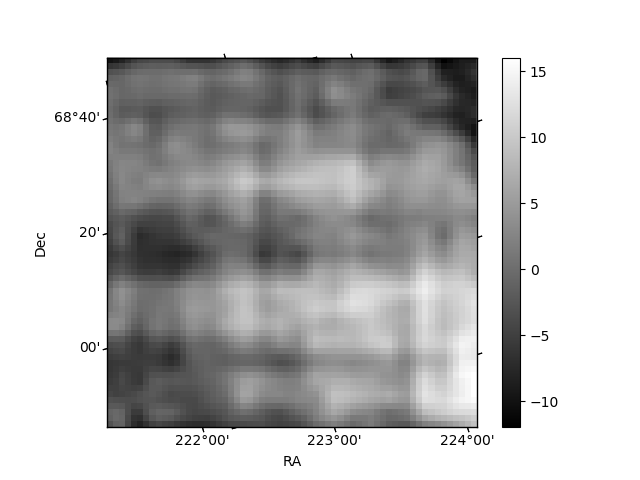
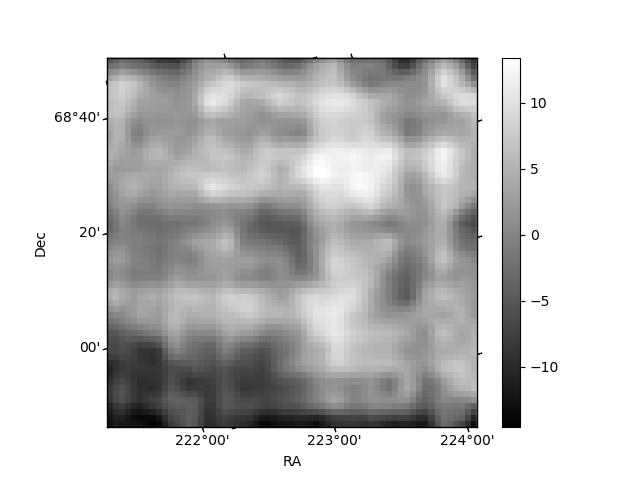
Histogram calculated using DETX and DETY for each event in the final _common_clean file
| Quadrant A | 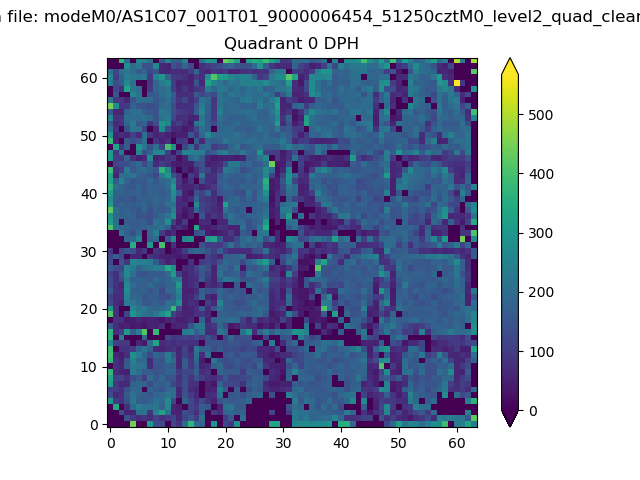 |
 |
Quadrant B |
|---|---|---|---|
| Quadrant D | 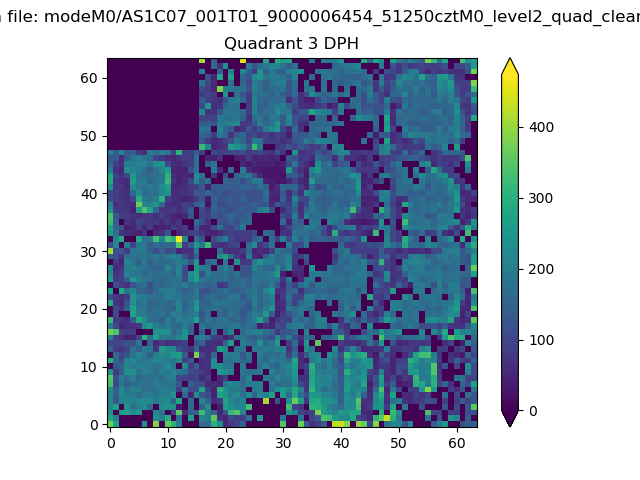 |
 |
Quadrant C |
| Plot type | Count rate plots | Images |
|---|---|---|
| Comparison with Poisson distribution Blue bars denote a histogram of data divided into 1 sec bins. Red curve is a Poisson curve with rate = median count rate of data. |
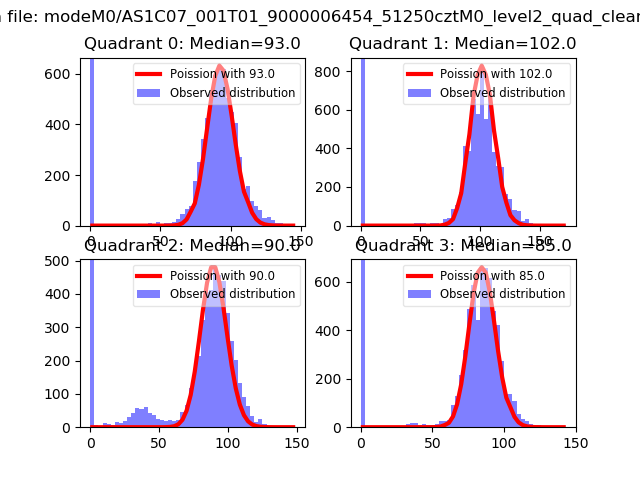 |
 |
| Quadrant-wise count rates Data is divided into 100 sec bins |
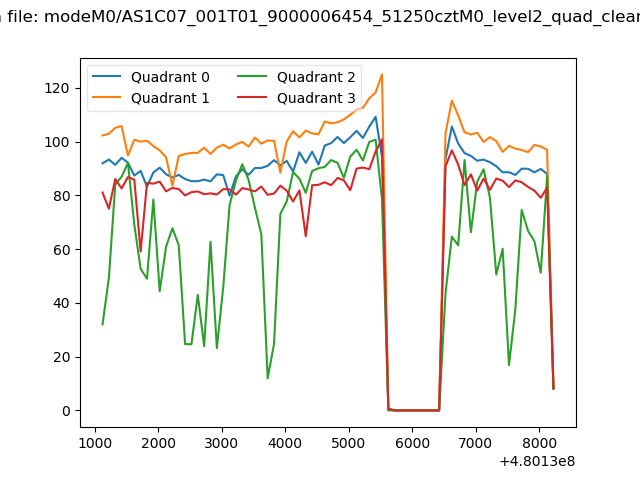 |
|
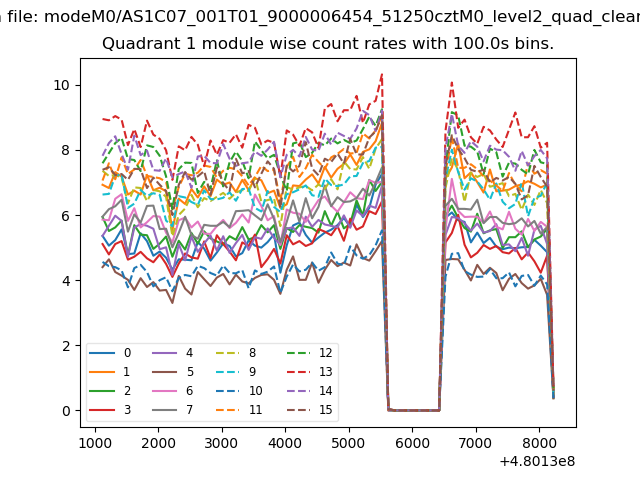
| Module-wise count rates for Quadrant A Data is divided into 100 sec bins |
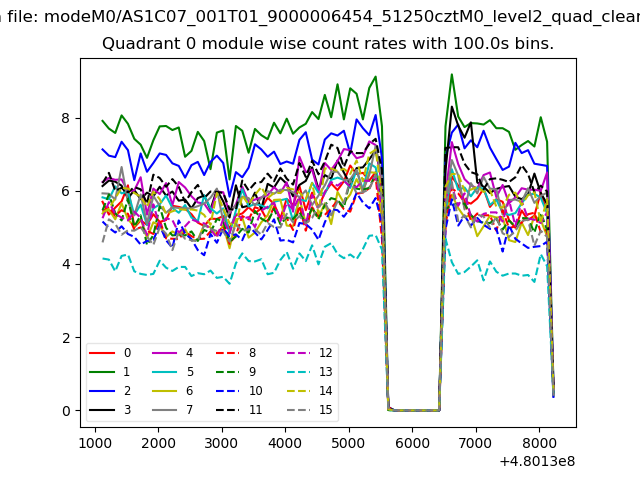 |
 |
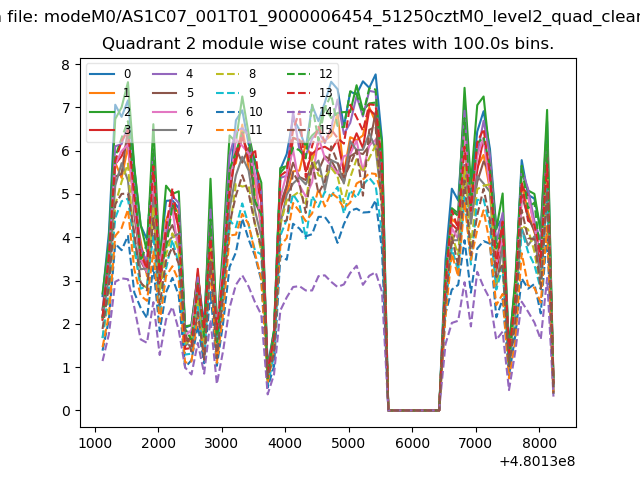
| Module-wise count rates for Quadrant B Data is divided into 100 sec bins |
 |
 |
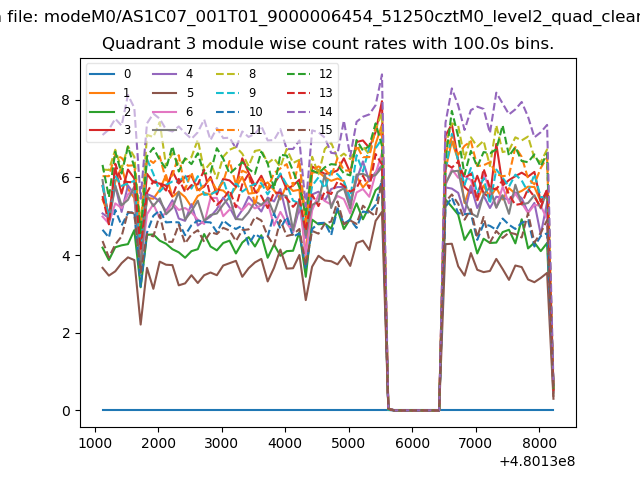
| Module-wise count rates for Quadrant C Data is divided into 100 sec bins |
 |
 |
| Module-wise count rates for Quadrant D Data is divided into 100 sec bins |
 |
 |
| Parameter | Plot |
|---|---|
| CZT HV Monitor |  |
| D_VDD | 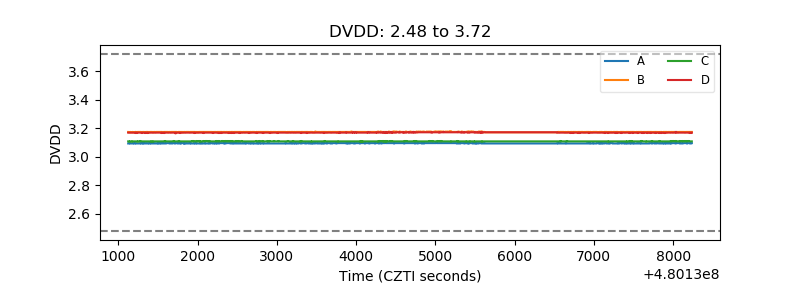 |
| Temperature 1 | 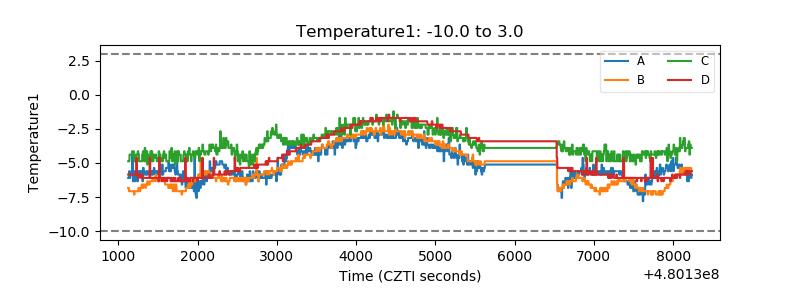 |
| Veto HV Monitor | 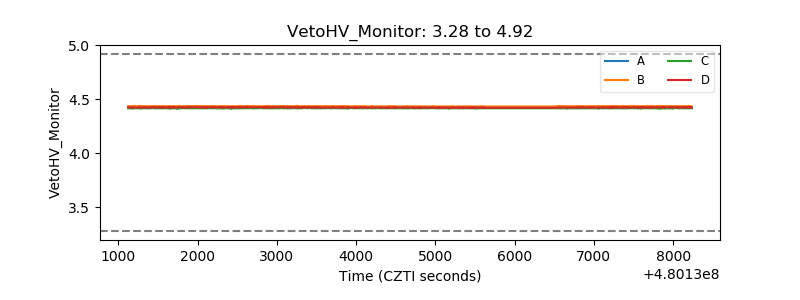 |
| Veto LLD | 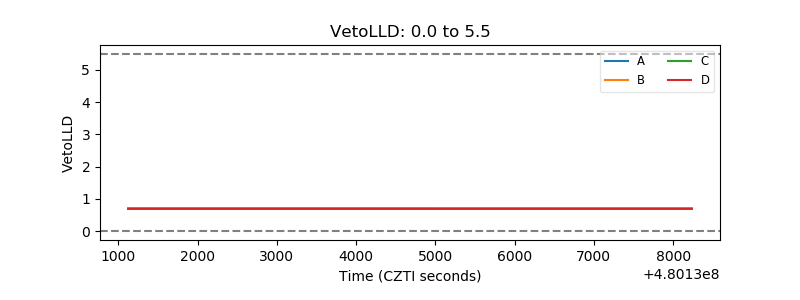 |
| Alpha Counter | 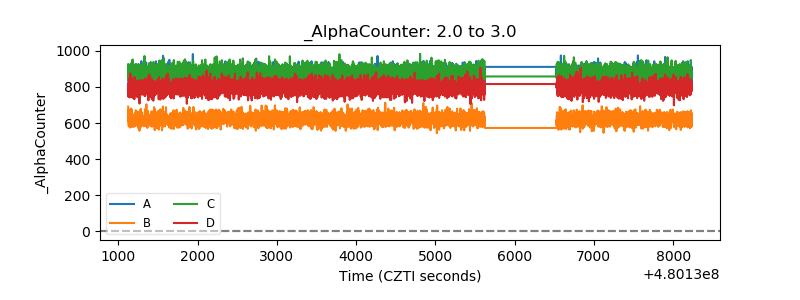 |
| _CPM_Rate | 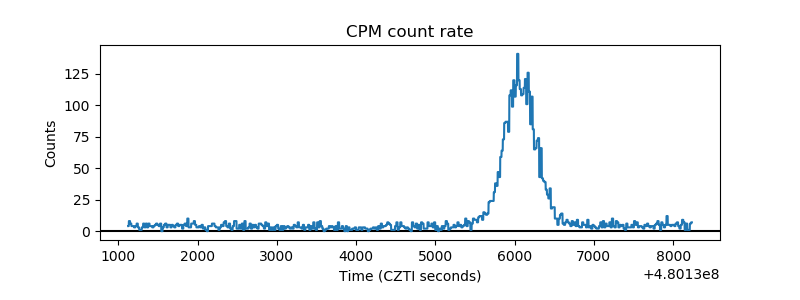 |
| CZT Counter | 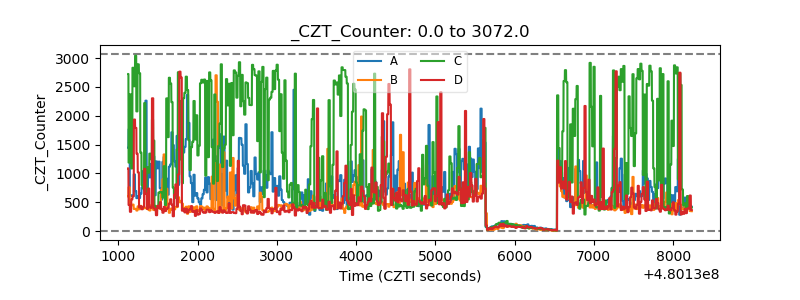 |
| +2.5 Volts monitor | 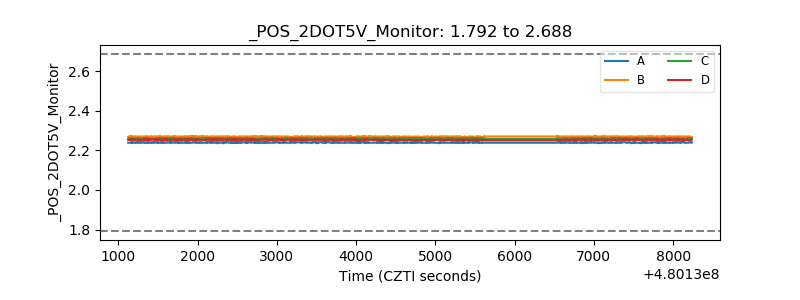 |
| +5 Volts monitor | 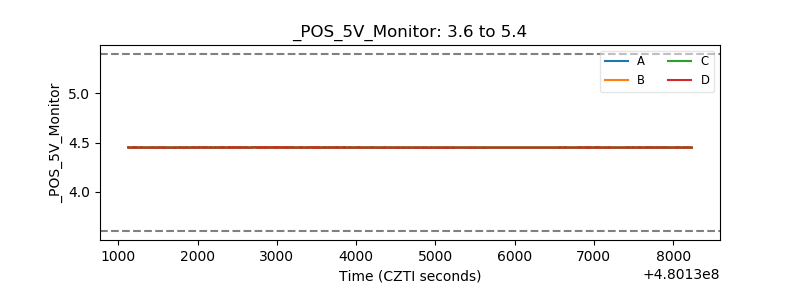 |
| _ROLL_ROT | 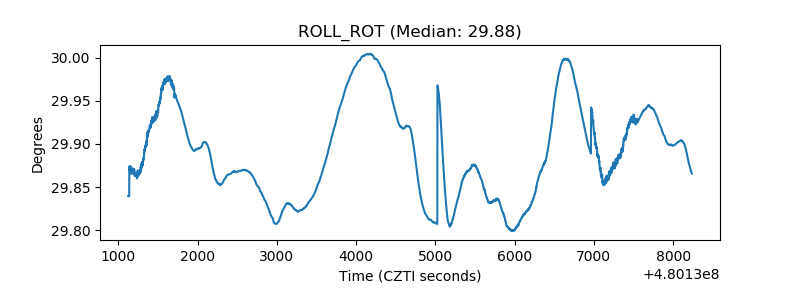 |
| _Roll_DEC | 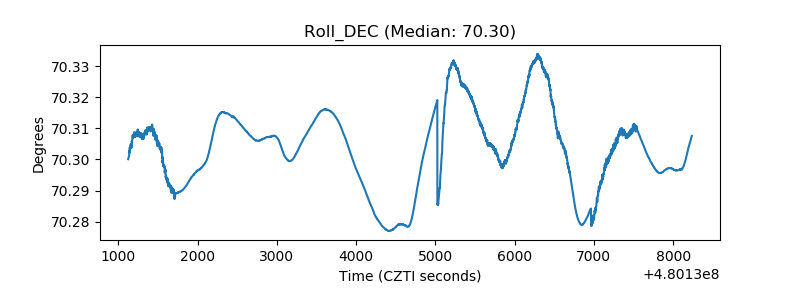 |
| _Roll_RA | 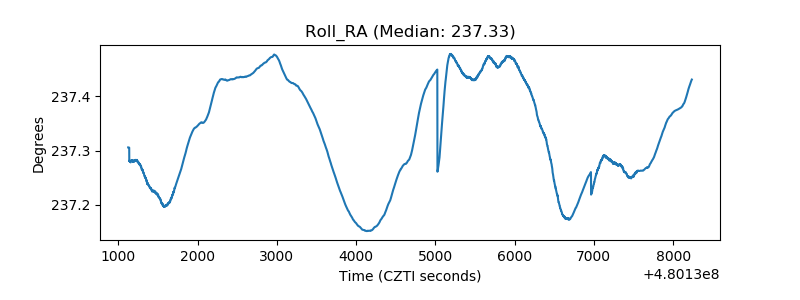 |
| Veto Counter | 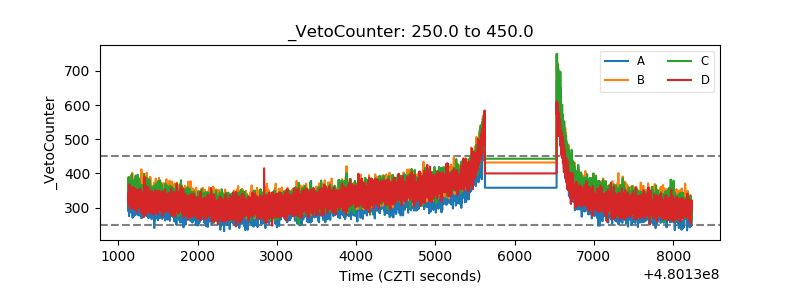 |