| Param | Original file | Final file |
|---|---|---|
| Filename | modeM0/AS1C07_001T01_9000006454_51251cztM0_level2.fits | modeM0/AS1C07_001T01_9000006454_51251cztM0_level2_quad_clean.evt |
| Size (bytes) | 634,360,320 | 102,242,880 |
| Size | 605.0 MB | 97.5 MB |
| Events in quadrant A | 6,160,842 | 673,650 |
| Events in quadrant B | 4,335,900 | 730,703 |
| Events in quadrant C | 8,136,021 | 560,098 |
| Events in quadrant D | 4,275,061 | 615,808 |
| Mode M0 | |||
|---|---|---|---|
| Quadrant | BADHDUFLAG | Total packets | Discarded packets |
| A | 0 | 23611 | 2 |
| B | 0 | 18349 | 2 |
| C | 0 | 29402 | 2 |
| D | 0 | 18386 | 2 |
| Mode SS | |||
|---|---|---|---|
| Quadrant | BADHDUFLAG | Total packets | Discarded packets |
| A | 0 | 150 | 0 |
| B | 0 | 150 | 0 |
| C | 0 | 150 | 0 |
| D | 0 | 150 | 0 |
| Mode M9 | |||
|---|---|---|---|
| Quadrant | BADHDUFLAG | Total packets | Discarded packets |
| A | 0 | 7 | 0 |
| B | 0 | 8 | 0 |
| C | 0 | 8 | 0 |
| D | 0 | 8 | 0 |
| Quadrant | Total seconds | Saturated seconds | Saturation percentage |
|---|---|---|---|
| A | 7407 | 209 | 2.821655% |
| B | 7407 | 311 | 4.198731% |
| C | 7407 | 1525 | 20.588632% |
| D | 7407 | 237 | 3.199676% |
Noise dominated data is calculated using 1-second bins in cleaned event files. If a bin has >2000 counts, and if more than 50% of those come from <1% of pixels, then it is considered to be noise-dominated and hence unusable.
| Quadrant | # 1 sec bins | Bins with >0 counts | Bins with >2000 counts | High rate bins dominated by noise | Noise dominated (total time) | Noise dominated (detector-on time) | Marked lightcurve |
|---|---|---|---|---|---|---|---|
| A | 7892 | 7408 | 72 | 72 | 0.91% | 0.97% | 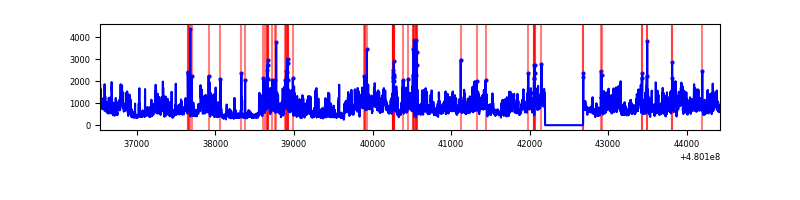 |
| B | 7892 | 7408 | 93 | 93 | 1.18% | 1.26% | 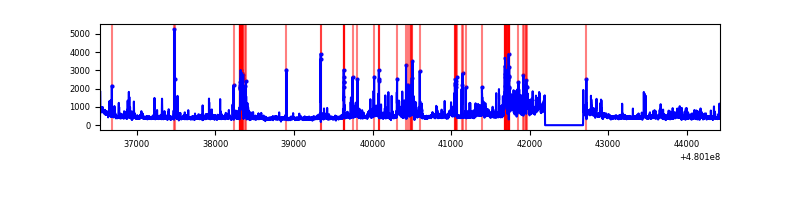 |
| C | 7892 | 7408 | 1308 | 1308 | 16.57% | 17.66% | 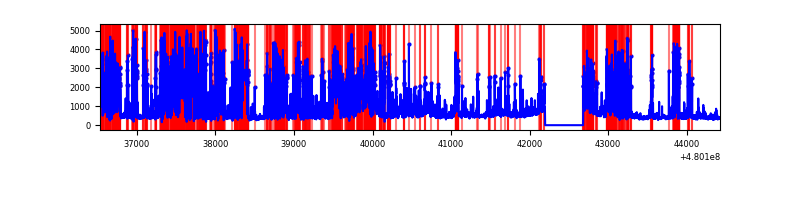 |
| D | 7892 | 7408 | 188 | 188 | 2.38% | 2.54% | 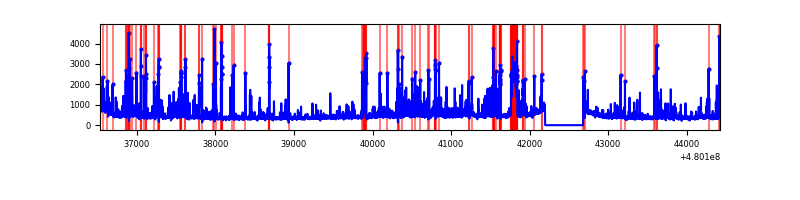 |
Top three noisy pixels from each quadrant. If the there are fewer than three noisy pixels in the level2.evt file, extra rows are filled as -1
| Pixel properties | Quadrant properties | ||||||
|---|---|---|---|---|---|---|---|
| Quadrant | DetID | PixID | Counts | Sigma | Mean | Median | Sigma |
| A | 12 | 3 | 2035010 | 10697.32 | 768 | 748 | 190.2 |
| A | 14 | 254 | 325505 | 1707.76 | 768 | 748 | 190.2 |
| A | 12 | 194 | 235275 | 1233.28 | 768 | 748 | 190.2 |
| B | 7 | 252 | 312163 | 1915.93 | 766 | 738 | 162.5 |
| B | 10 | 254 | 311717 | 1913.19 | 766 | 738 | 162.5 |
| B | 4 | 171 | 152252 | 932.14 | 766 | 738 | 162.5 |
| C | 4 | 12 | 4758548 | 25551.54 | 679 | 674 | 186.2 |
| C | 3 | 233 | 207374 | 1110.05 | 679 | 674 | 186.2 |
| C | 14 | 245 | 205958 | 1102.45 | 679 | 674 | 186.2 |
| D | 2 | 207 | 277900 | 1339.57 | 734 | 707 | 206.9 |
| D | 3 | 12 | 181834 | 875.32 | 734 | 707 | 206.9 |
| D | 7 | 96 | 160187 | 770.71 | 734 | 707 | 206.9 |
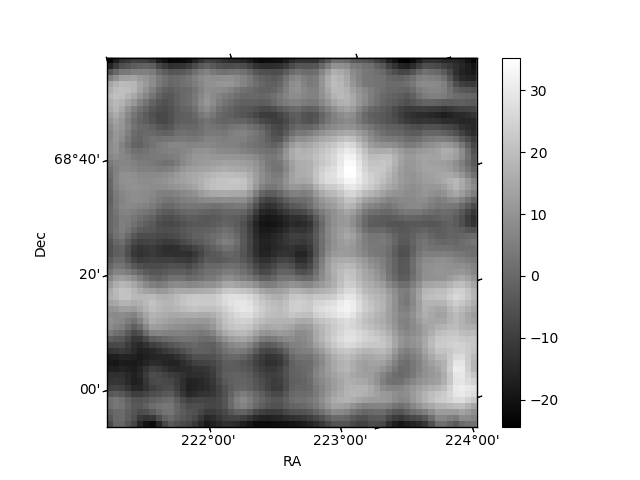
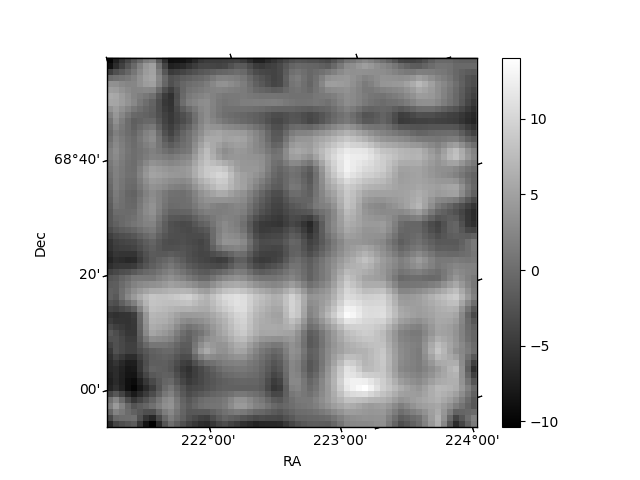
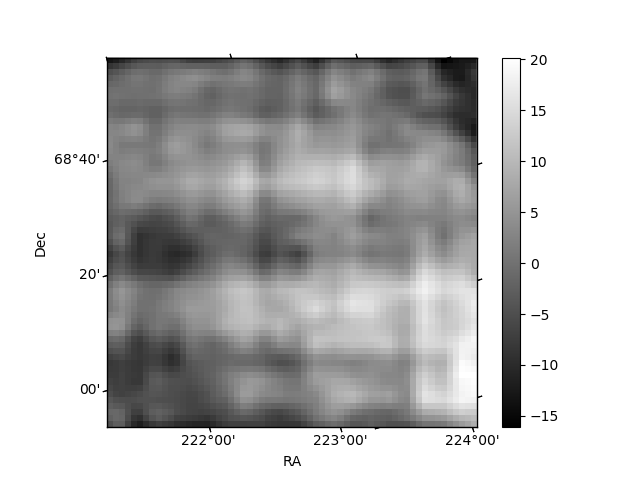
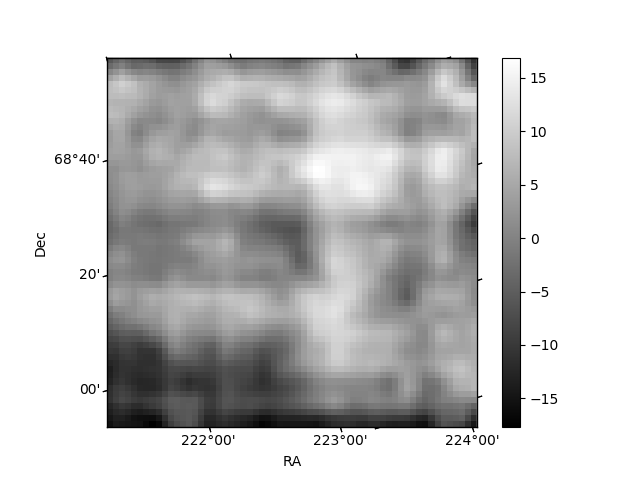
Histogram calculated using DETX and DETY for each event in the final _common_clean file
| Quadrant A | 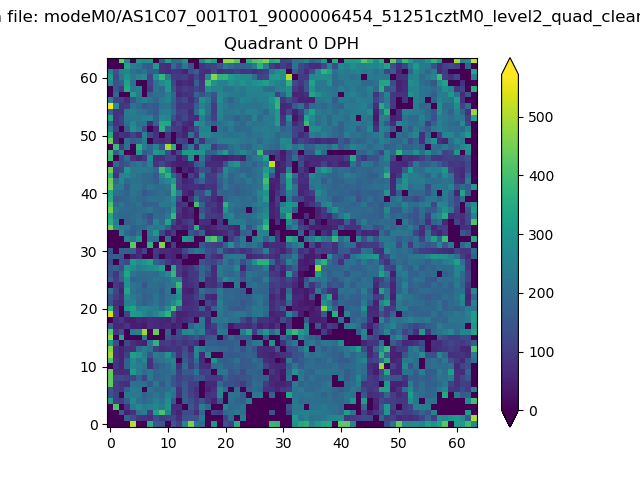 |
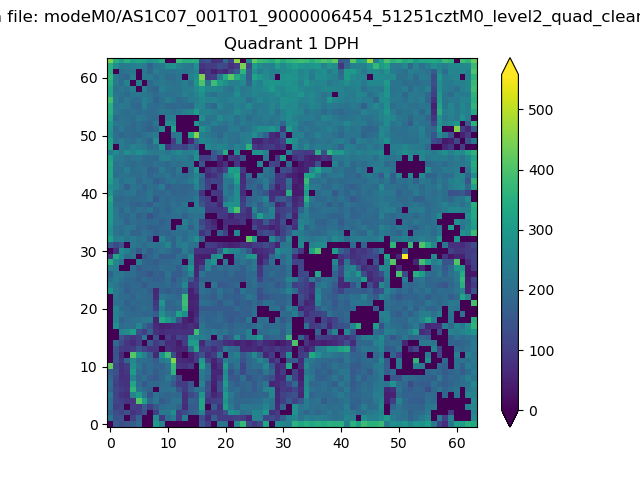 |
Quadrant B |
|---|---|---|---|
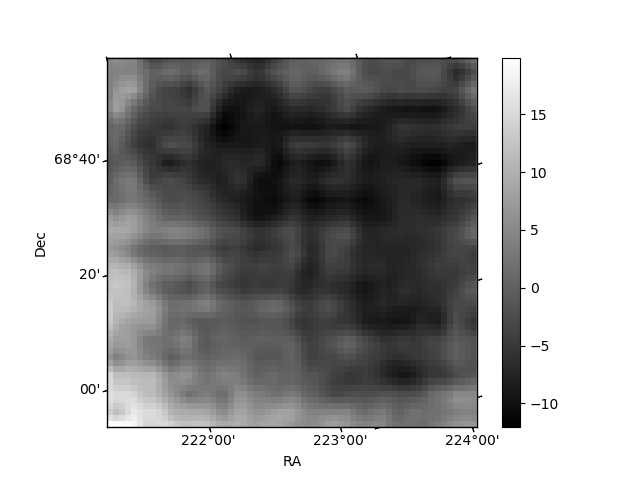
| Quadrant D | 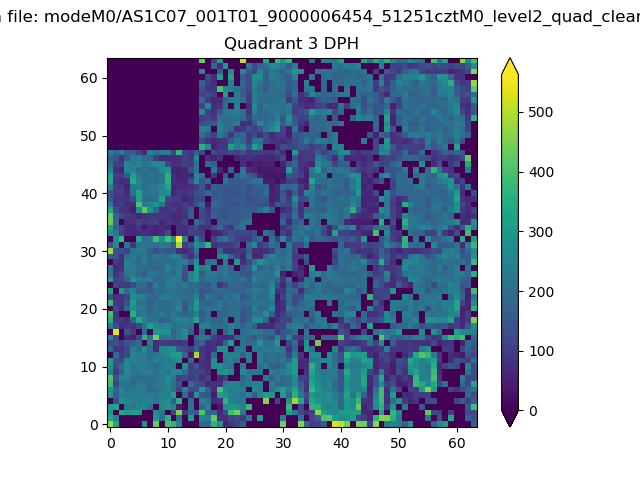 |
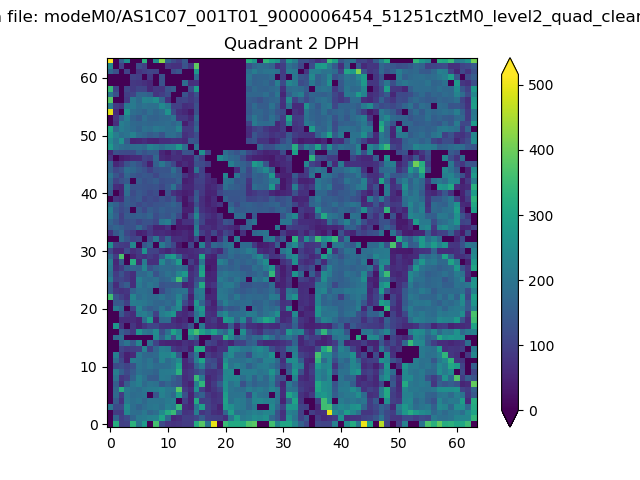 |
Quadrant C |
| Plot type | Count rate plots | Images |
|---|---|---|
| Comparison with Poisson distribution Blue bars denote a histogram of data divided into 1 sec bins. Red curve is a Poisson curve with rate = median count rate of data. |
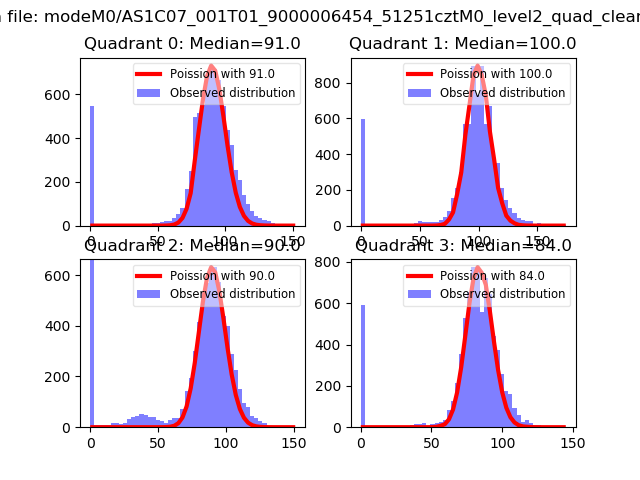 |
 |
| Quadrant-wise count rates Data is divided into 100 sec bins |
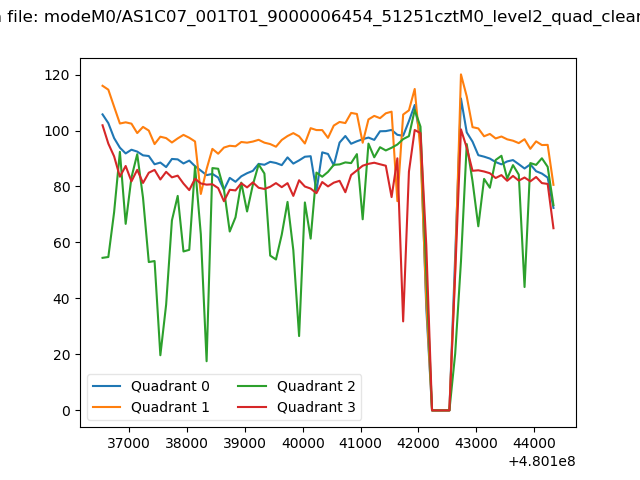 |
|
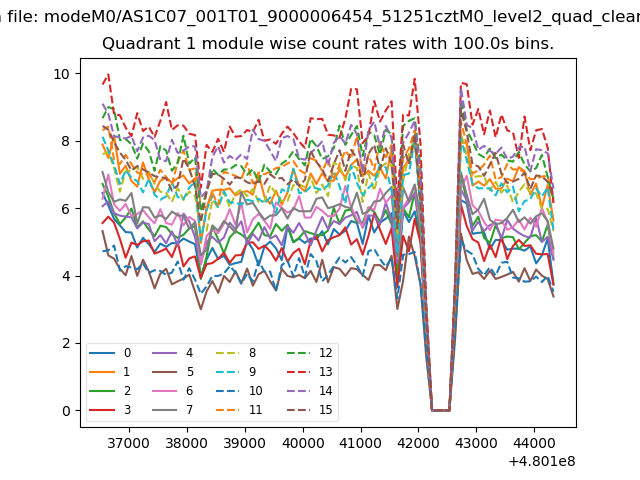
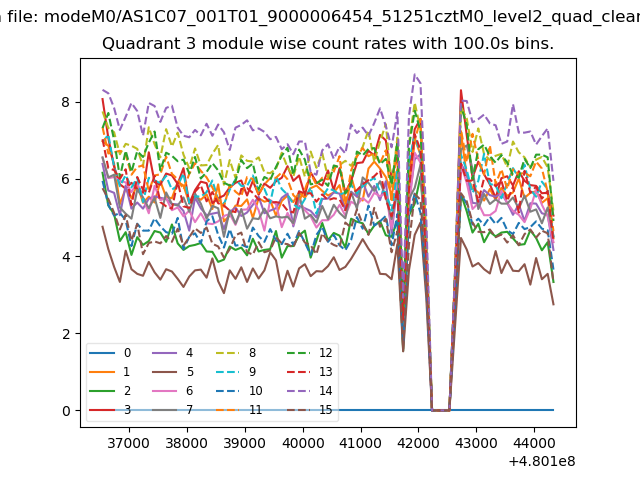
| Module-wise count rates for Quadrant A Data is divided into 100 sec bins |
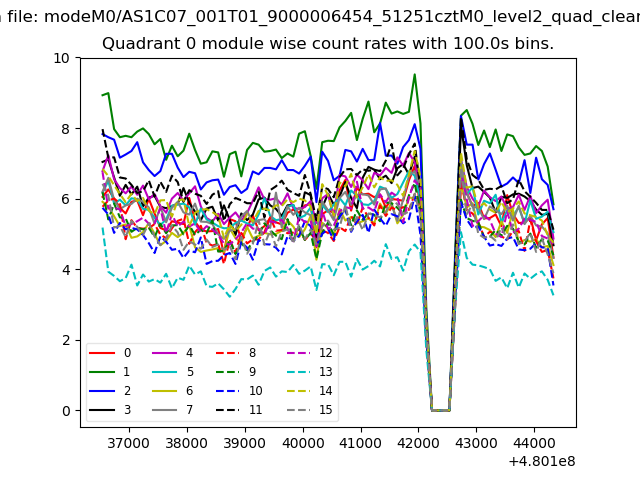 |
 |
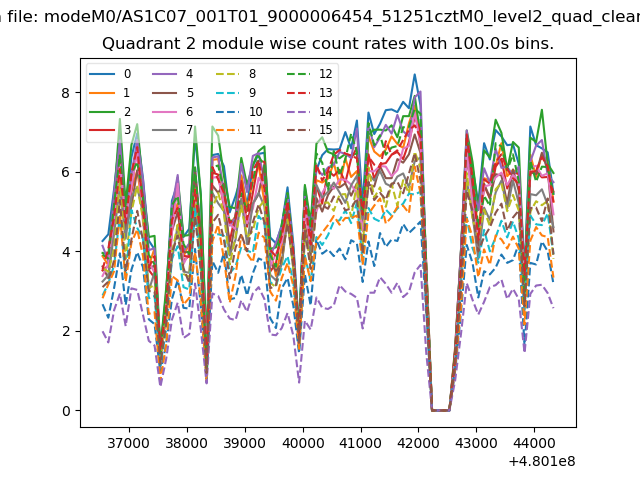
| Module-wise count rates for Quadrant B Data is divided into 100 sec bins |
 |
 |
| Module-wise count rates for Quadrant C Data is divided into 100 sec bins |
 |
 |
| Module-wise count rates for Quadrant D Data is divided into 100 sec bins |
 |
 |
| Parameter | Plot |
|---|---|
| CZT HV Monitor | 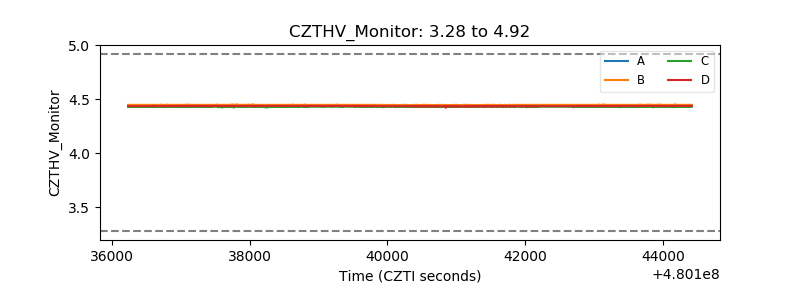 |
| D_VDD | 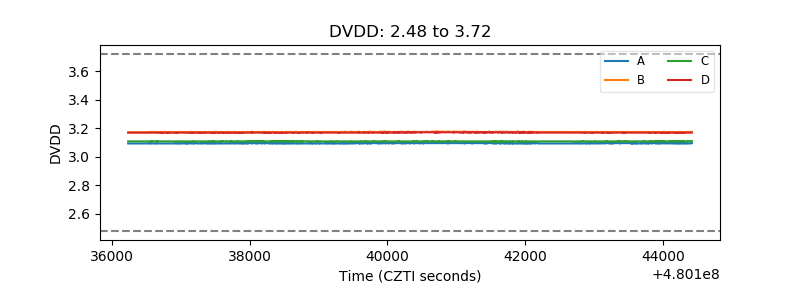 |
| Temperature 1 | 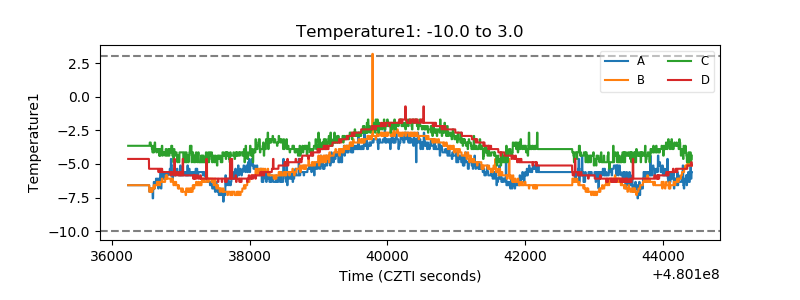 |
| Veto HV Monitor | 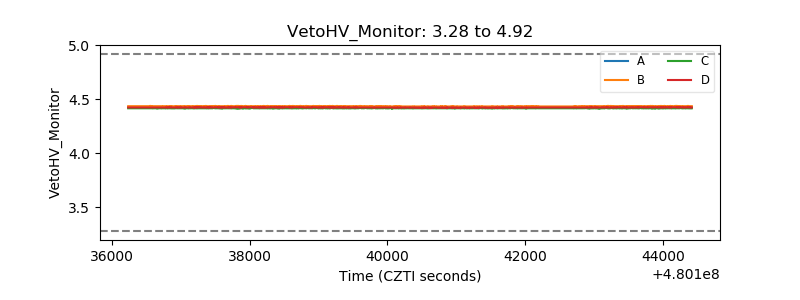 |
| Veto LLD | 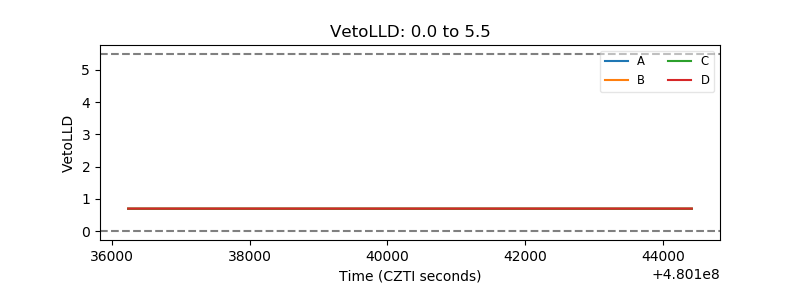 |
| Alpha Counter | 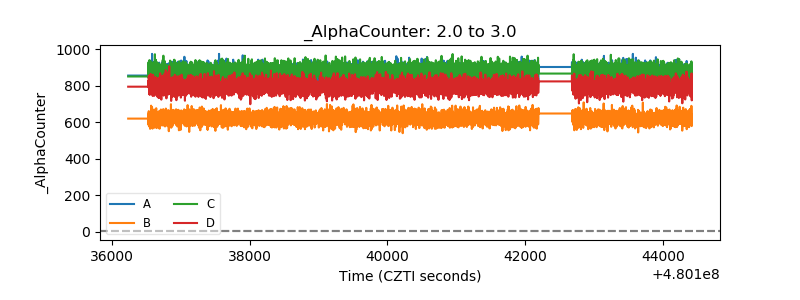 |
| _CPM_Rate | 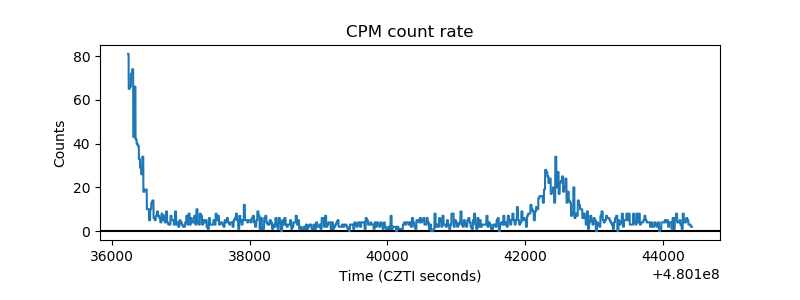 |
| CZT Counter | 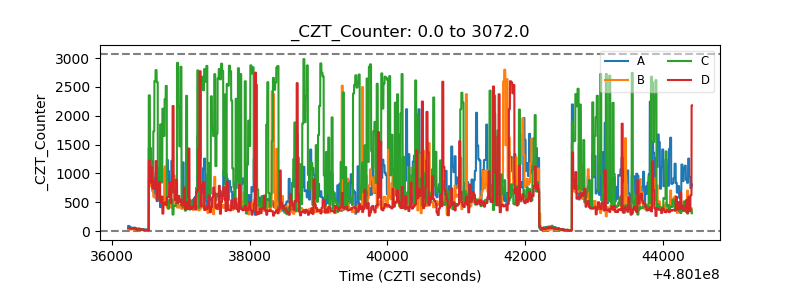 |
| +2.5 Volts monitor | 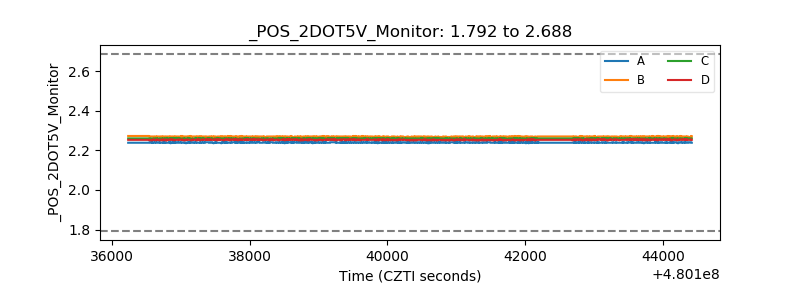 |
| +5 Volts monitor | 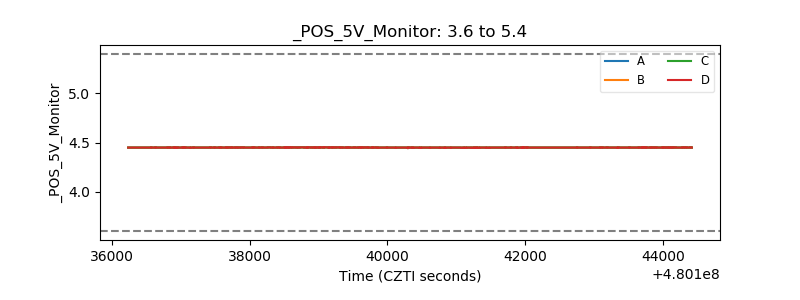 |
| _ROLL_ROT | 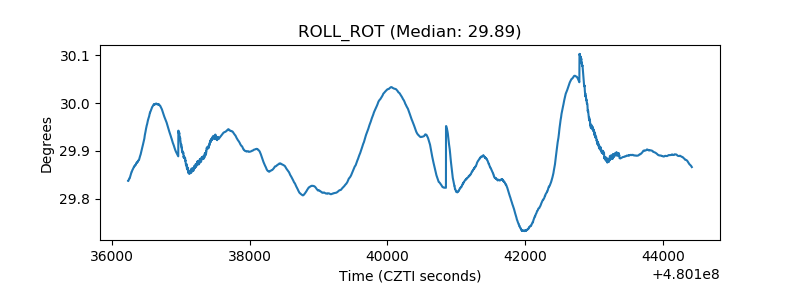 |
| _Roll_DEC | 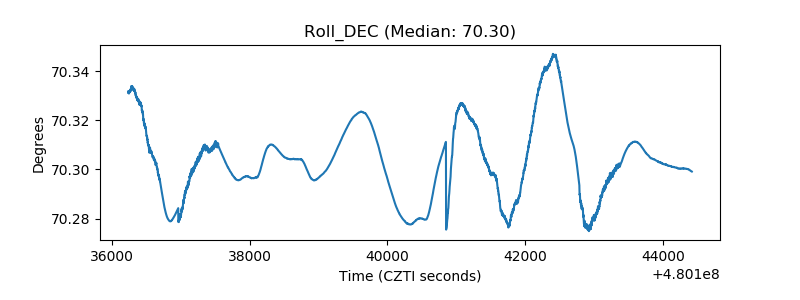 |
| _Roll_RA | 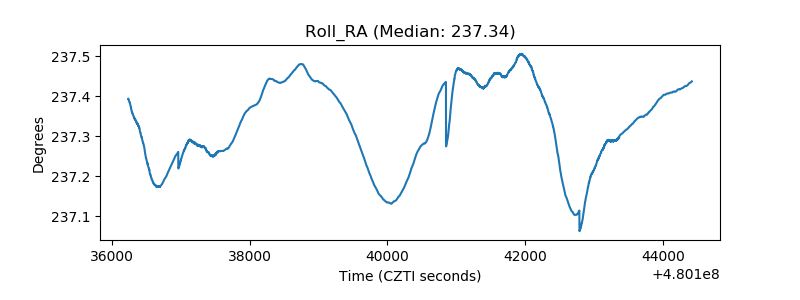 |
| Veto Counter | 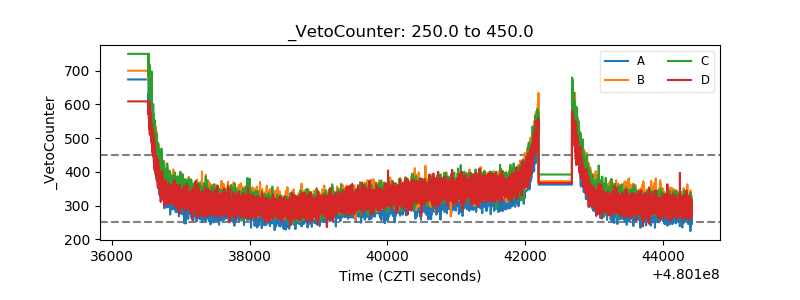 |