| Param | Original file | Final file |
|---|---|---|
| Filename | modeM0/AS1C07_001T01_9000006454_51252cztM0_level2.fits | modeM0/AS1C07_001T01_9000006454_51252cztM0_level2_quad_clean.evt |
| Size (bytes) | 657,495,360 | 104,823,360 |
| Size | 627.0 MB | 100.0 MB |
| Events in quadrant A | 7,270,858 | 674,444 |
| Events in quadrant B | 4,658,409 | 757,916 |
| Events in quadrant C | 7,466,965 | 578,189 |
| Events in quadrant D | 4,349,287 | 631,134 |
| Mode M0 | |||
|---|---|---|---|
| Quadrant | BADHDUFLAG | Total packets | Discarded packets |
| A | 0 | 27020 | 0 |
| B | 0 | 19218 | 0 |
| C | 0 | 27640 | 1 |
| D | 0 | 18678 | 0 |
| Mode SS | |||
|---|---|---|---|
| Quadrant | BADHDUFLAG | Total packets | Discarded packets |
| A | 0 | 152 | 0 |
| B | 0 | 152 | 0 |
| C | 0 | 152 | 0 |
| D | 0 | 152 | 0 |
| Quadrant | Total seconds | Saturated seconds | Saturation percentage |
|---|---|---|---|
| A | 7652 | 359 | 4.691584% |
| B | 7652 | 146 | 1.907998% |
| C | 7652 | 1387 | 18.125980% |
| D | 7652 | 174 | 2.273915% |
Noise dominated data is calculated using 1-second bins in cleaned event files. If a bin has >2000 counts, and if more than 50% of those come from <1% of pixels, then it is considered to be noise-dominated and hence unusable.
| Quadrant | # 1 sec bins | Bins with >0 counts | Bins with >2000 counts | High rate bins dominated by noise | Noise dominated (total time) | Noise dominated (detector-on time) | Marked lightcurve |
|---|---|---|---|---|---|---|---|
| A | 7652 | 7652 | 238 | 238 | 3.11% | 3.11% | 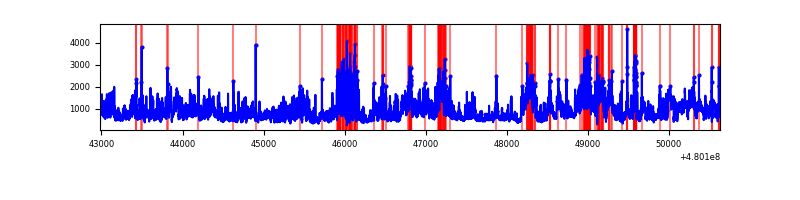 |
| B | 7652 | 7652 | 77 | 77 | 1.01% | 1.01% | 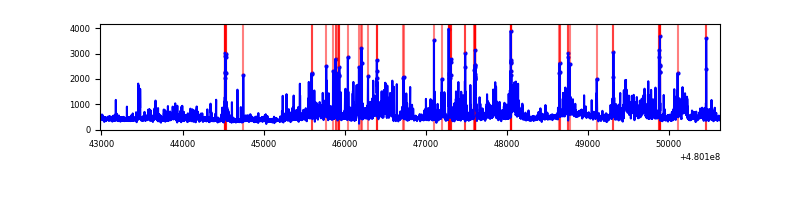 |
| C | 7651 | 7651 | 1234 | 1234 | 16.13% | 16.13% |  |
| D | 7652 | 7652 | 145 | 145 | 1.89% | 1.89% | 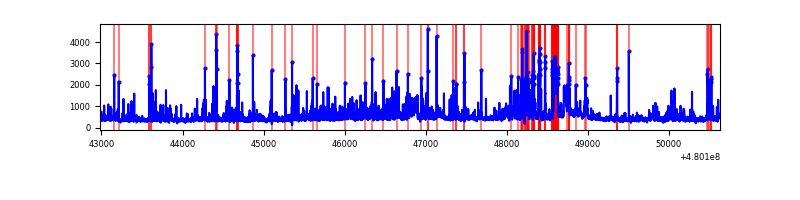 |
Top three noisy pixels from each quadrant. If the there are fewer than three noisy pixels in the level2.evt file, extra rows are filled as -1
| Pixel properties | Quadrant properties | ||||||
|---|---|---|---|---|---|---|---|
| Quadrant | DetID | PixID | Counts | Sigma | Mean | Median | Sigma |
| A | 12 | 3 | 2214091 | 11665.86 | 770 | 751 | 189.7 |
| A | 12 | 80 | 766044 | 4033.63 | 770 | 751 | 189.7 |
| A | 12 | 194 | 256230 | 1346.55 | 770 | 751 | 189.7 |
| B | 10 | 254 | 308517 | 1841.45 | 780 | 751 | 167.1 |
| B | 4 | 171 | 287581 | 1716.19 | 780 | 751 | 167.1 |
| B | 7 | 252 | 218005 | 1299.89 | 780 | 751 | 167.1 |
| C | 4 | 12 | 3991245 | 20361.98 | 705 | 700 | 196.0 |
| C | 3 | 233 | 215740 | 1097.25 | 705 | 700 | 196.0 |
| C | 13 | 3 | 147912 | 751.16 | 705 | 700 | 196.0 |
| D | 10 | 181 | 406611 | 1947.47 | 743 | 715 | 208.4 |
| D | 7 | 96 | 239793 | 1147.09 | 743 | 715 | 208.4 |
| D | 2 | 207 | 147221 | 702.93 | 743 | 715 | 208.4 |
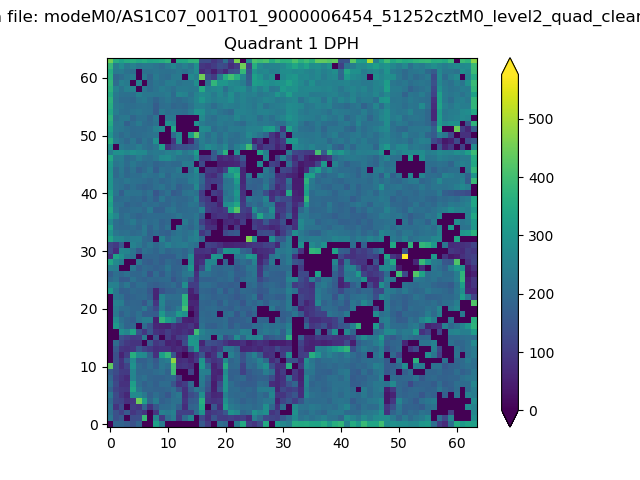
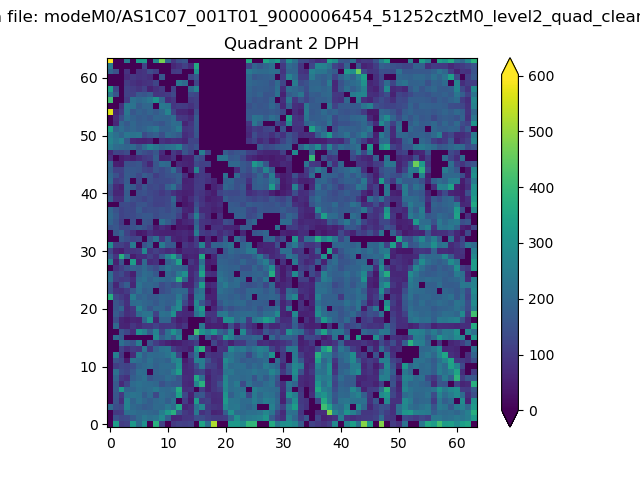
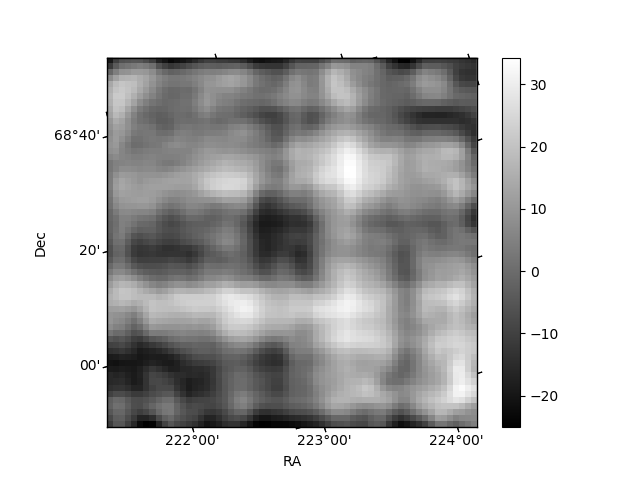
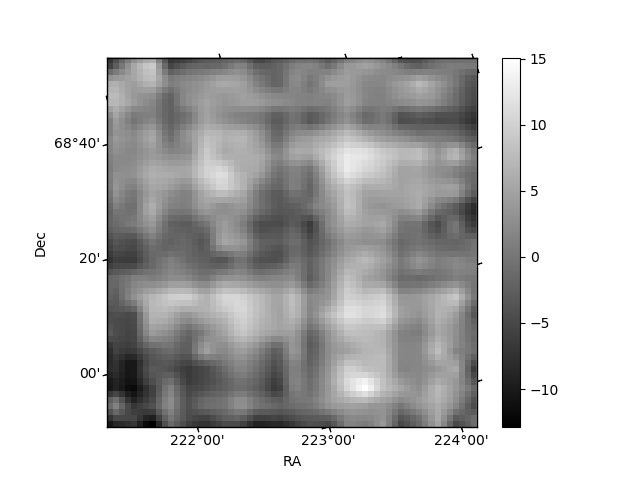
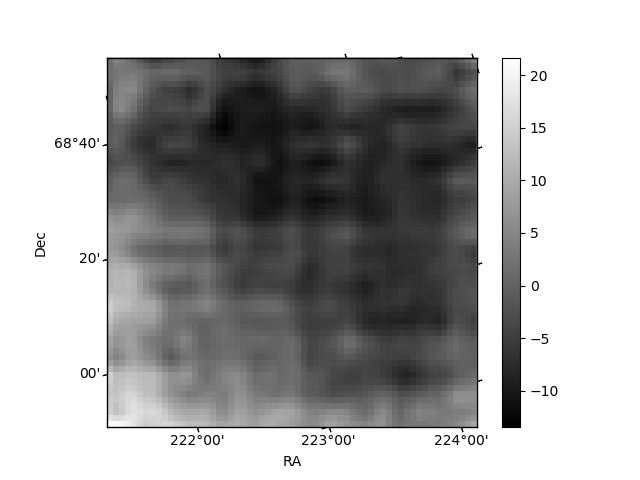
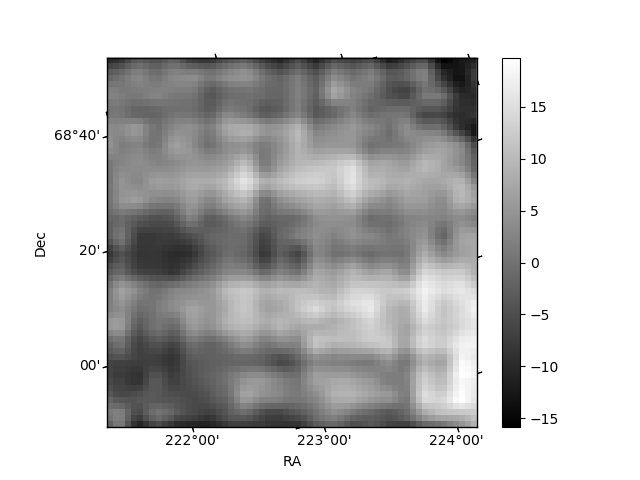
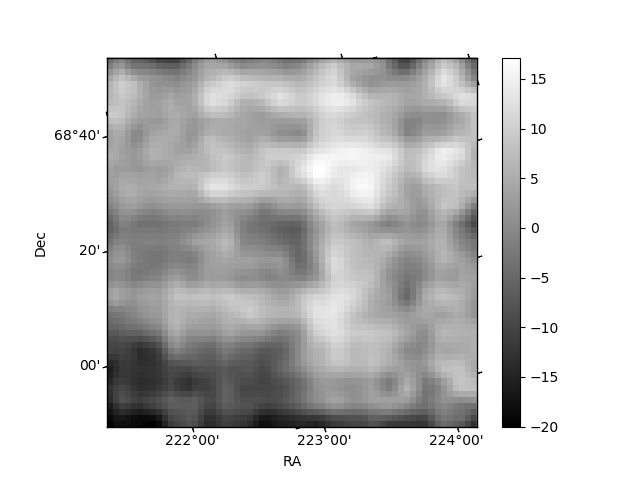
Histogram calculated using DETX and DETY for each event in the final _common_clean file
| Quadrant A | 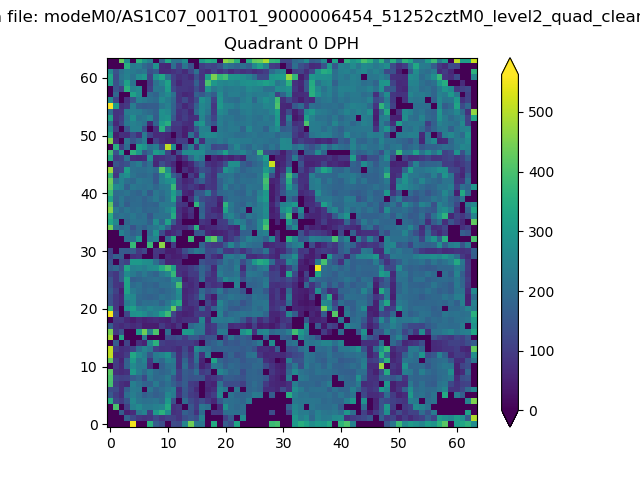 |
 |
Quadrant B |
|---|---|---|---|
| Quadrant D | 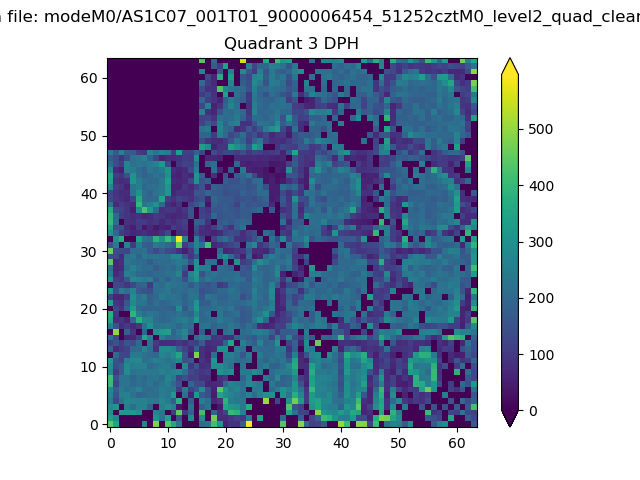 |
 |
Quadrant C |
| Plot type | Count rate plots | Images |
|---|---|---|
| Comparison with Poisson distribution Blue bars denote a histogram of data divided into 1 sec bins. Red curve is a Poisson curve with rate = median count rate of data. |
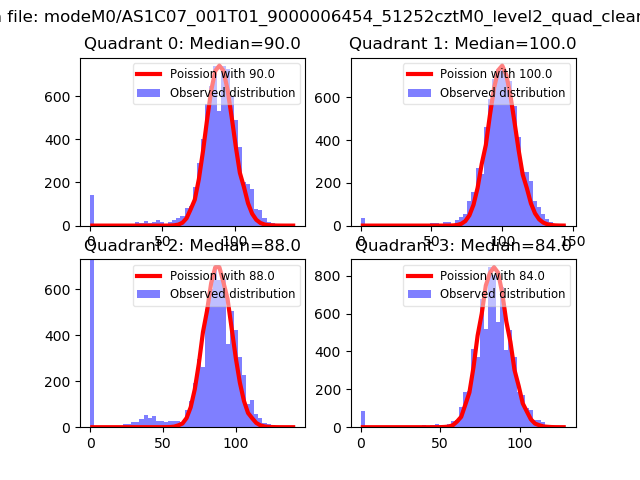 |
 |
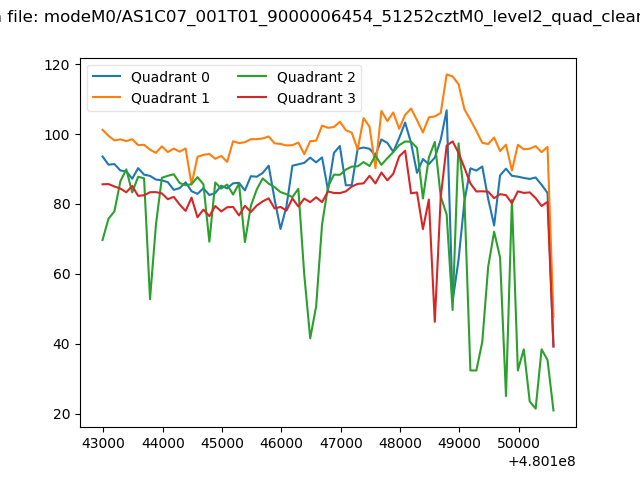
| Quadrant-wise count rates Data is divided into 100 sec bins |
 |
|
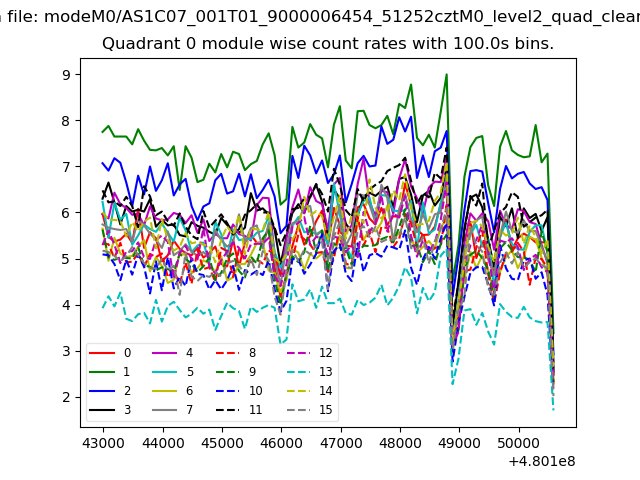
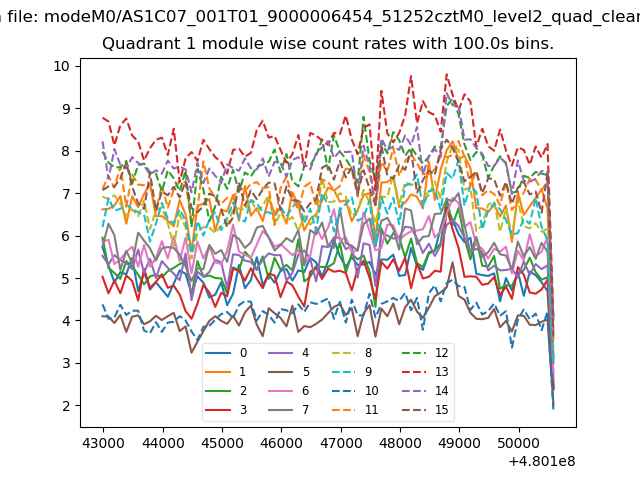
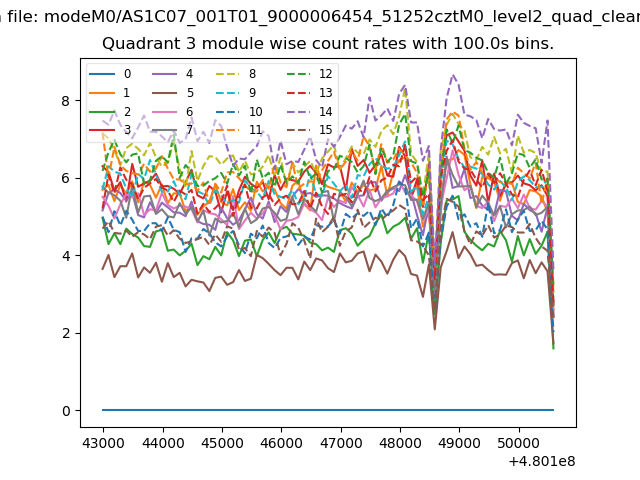
| Module-wise count rates for Quadrant A Data is divided into 100 sec bins |
 |
 |
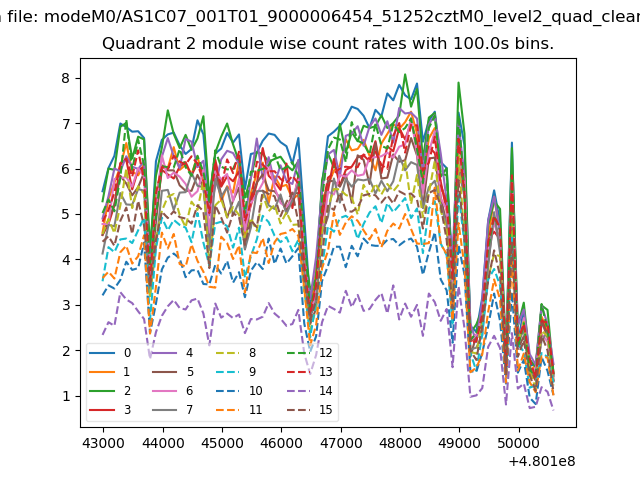
| Module-wise count rates for Quadrant B Data is divided into 100 sec bins |
 |
 |
| Module-wise count rates for Quadrant C Data is divided into 100 sec bins |
 |
 |
| Module-wise count rates for Quadrant D Data is divided into 100 sec bins |
 |
 |
| Parameter | Plot |
|---|---|
| CZT HV Monitor | 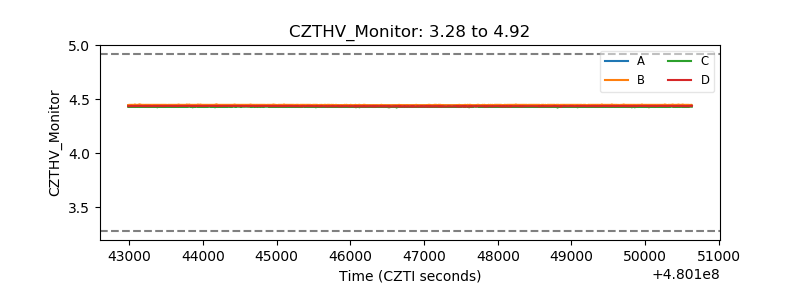 |
| D_VDD | 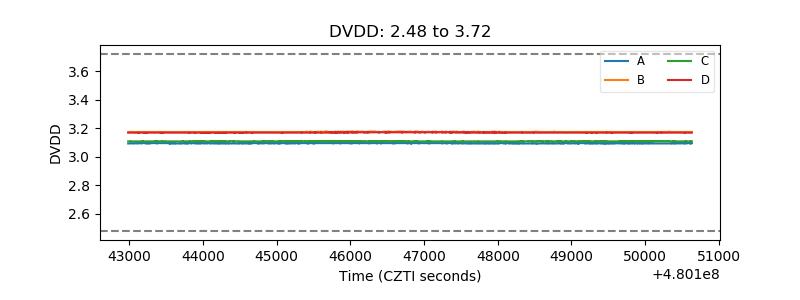 |
| Temperature 1 | 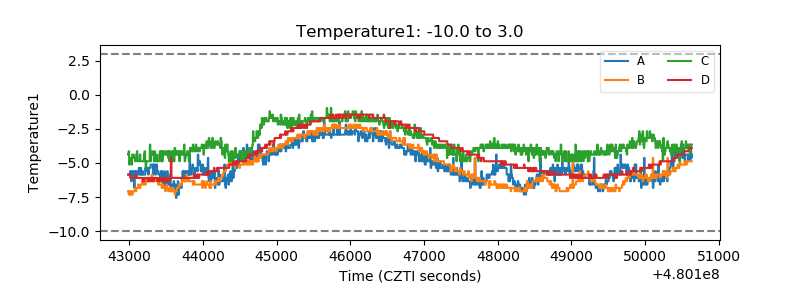 |
| Veto HV Monitor | 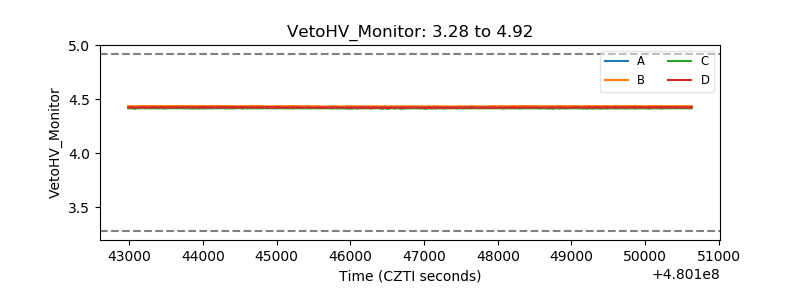 |
| Veto LLD | 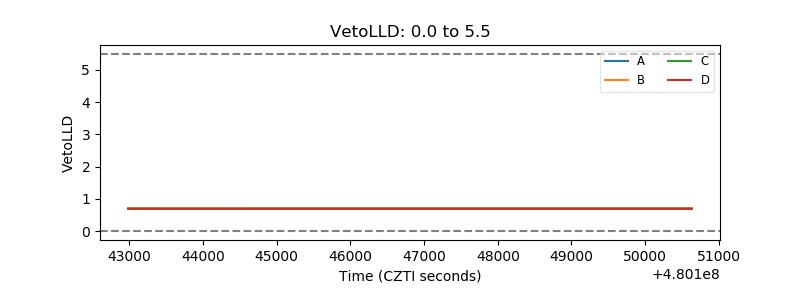 |
| Alpha Counter | 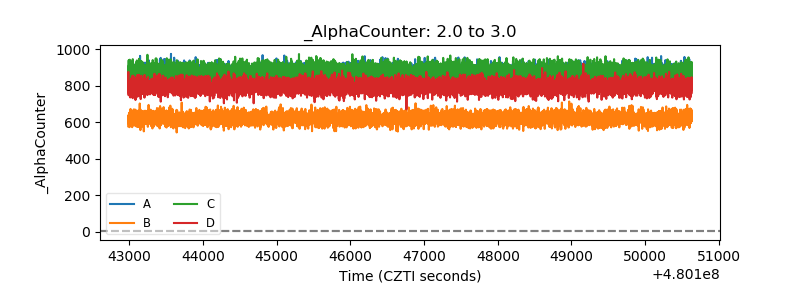 |
| _CPM_Rate | 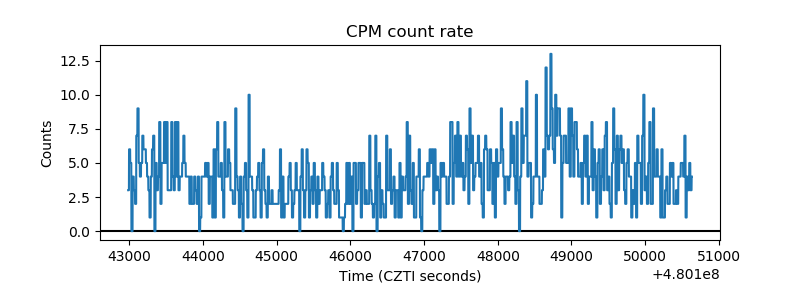 |
| CZT Counter | 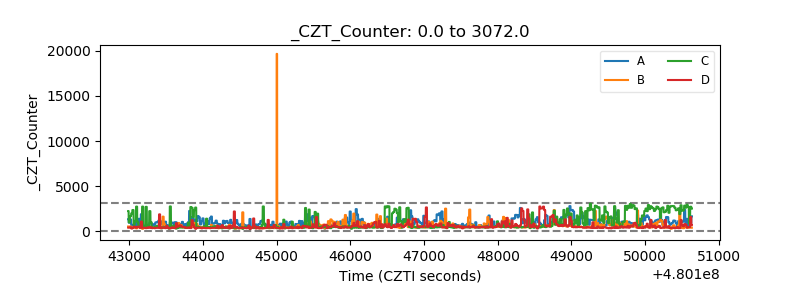 |
| +2.5 Volts monitor | 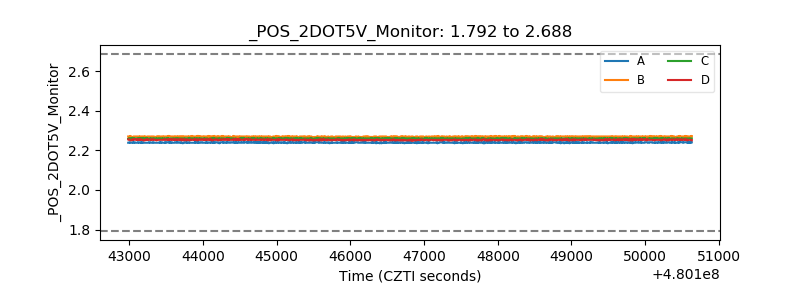 |
| +5 Volts monitor | 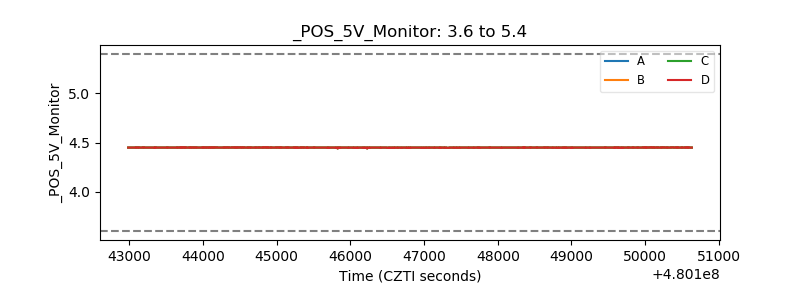 |
| _ROLL_ROT | 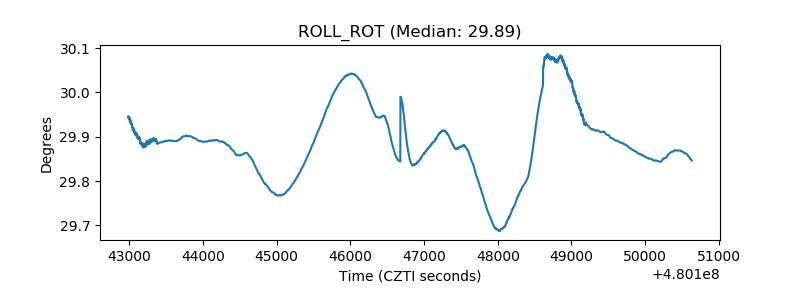 |
| _Roll_DEC | 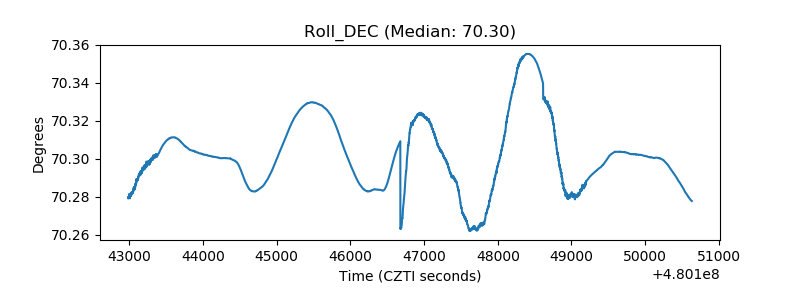 |
| _Roll_RA | 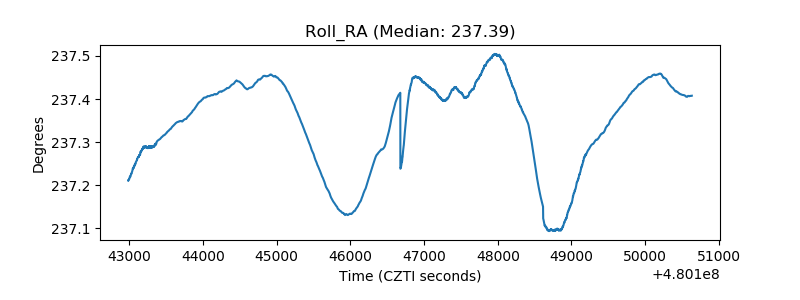 |
| Veto Counter | 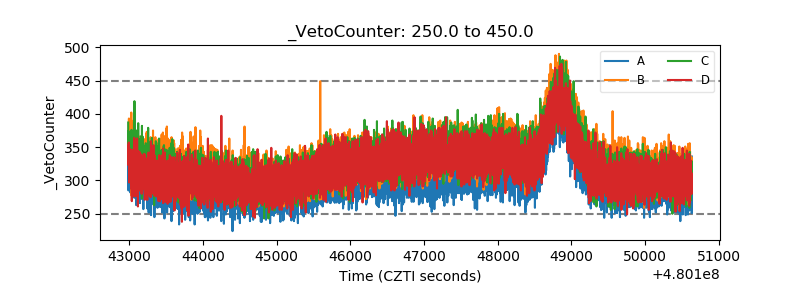 |