| Param | Original file | Final file |
|---|---|---|
| Filename | modeM0/AS1C07_001T01_9000006454_51253cztM0_level2.fits | modeM0/AS1C07_001T01_9000006454_51253cztM0_level2_quad_clean.evt |
| Size (bytes) | 680,760,000 | 100,569,600 |
| Size | 649.2 MB | 95.9 MB |
| Events in quadrant A | 6,656,328 | 655,322 |
| Events in quadrant B | 4,644,375 | 736,931 |
| Events in quadrant C | 9,375,716 | 509,123 |
| Events in quadrant D | 3,940,696 | 620,762 |
| Mode M0 | |||
|---|---|---|---|
| Quadrant | BADHDUFLAG | Total packets | Discarded packets |
| A | 0 | 25013 | 0 |
| B | 0 | 19058 | 0 |
| C | 0 | 32871 | 0 |
| D | 0 | 17312 | 0 |
| Mode SS | |||
|---|---|---|---|
| Quadrant | BADHDUFLAG | Total packets | Discarded packets |
| A | 0 | 150 | 0 |
| B | 0 | 150 | 0 |
| C | 0 | 150 | 0 |
| D | 0 | 150 | 0 |
| Quadrant | Total seconds | Saturated seconds | Saturation percentage |
|---|---|---|---|
| A | 7516 | 399 | 5.308675% |
| B | 7517 | 157 | 2.088599% |
| C | 7517 | 2052 | 27.298124% |
| D | 7517 | 101 | 1.343621% |
Noise dominated data is calculated using 1-second bins in cleaned event files. If a bin has >2000 counts, and if more than 50% of those come from <1% of pixels, then it is considered to be noise-dominated and hence unusable.
| Quadrant | # 1 sec bins | Bins with >0 counts | Bins with >2000 counts | High rate bins dominated by noise | Noise dominated (total time) | Noise dominated (detector-on time) | Marked lightcurve |
|---|---|---|---|---|---|---|---|
| A | 7516 | 7516 | 297 | 297 | 3.95% | 3.95% | 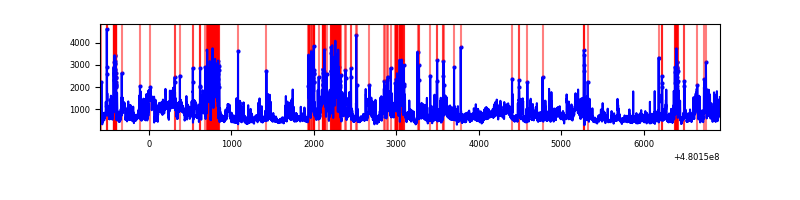 |
| B | 7517 | 7517 | 76 | 76 | 1.01% | 1.01% | 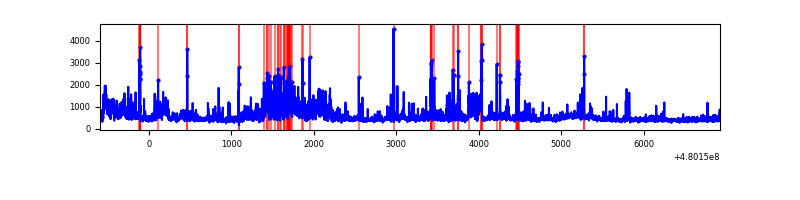 |
| C | 7517 | 7517 | 1843 | 1843 | 24.52% | 24.52% | 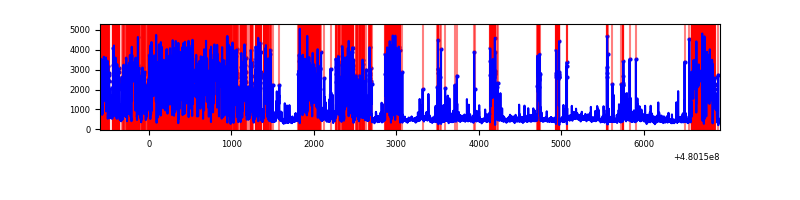 |
| D | 7517 | 7517 | 90 | 90 | 1.20% | 1.20% | 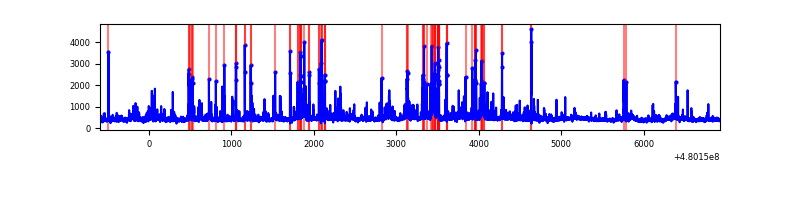 |
Top three noisy pixels from each quadrant. If the there are fewer than three noisy pixels in the level2.evt file, extra rows are filled as -1
| Pixel properties | Quadrant properties | ||||||
|---|---|---|---|---|---|---|---|
| Quadrant | DetID | PixID | Counts | Sigma | Mean | Median | Sigma |
| A | 12 | 3 | 1376153 | 7434.13 | 749 | 729 | 185.0 |
| A | 12 | 250 | 772807 | 4173.06 | 749 | 729 | 185.0 |
| A | 12 | 80 | 402245 | 2170.18 | 749 | 729 | 185.0 |
| B | 4 | 171 | 665721 | 4065.42 | 759 | 732 | 163.6 |
| B | 10 | 254 | 250531 | 1527.15 | 759 | 732 | 163.6 |
| B | 7 | 252 | 169238 | 1030.16 | 759 | 732 | 163.6 |
| C | 4 | 12 | 5475412 | 30056.09 | 652 | 646 | 182.2 |
| C | 15 | 205 | 282838 | 1549.21 | 652 | 646 | 182.2 |
| C | 3 | 233 | 180572 | 987.78 | 652 | 646 | 182.2 |
| D | 10 | 181 | 205363 | 1000.6 | 729 | 707 | 204.5 |
| D | 8 | 176 | 189799 | 924.5 | 729 | 707 | 204.5 |
| D | 2 | 120 | 154905 | 753.9 | 729 | 707 | 204.5 |
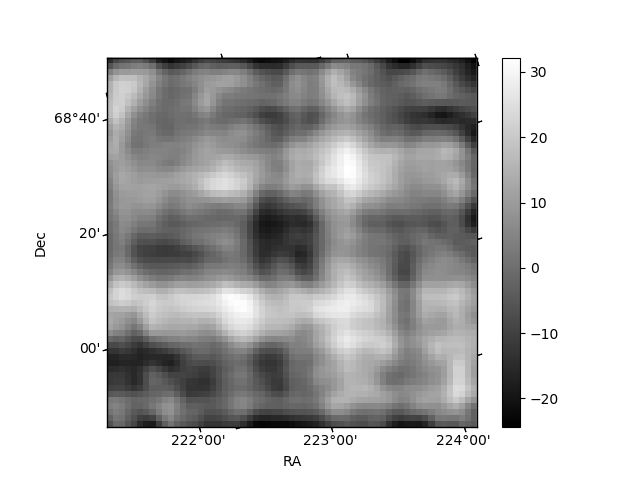
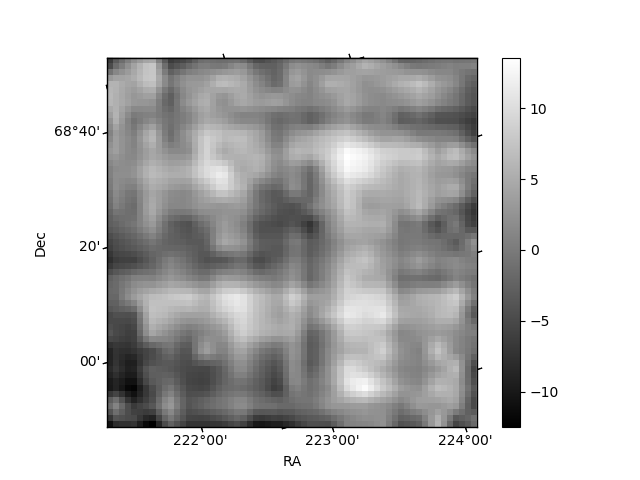
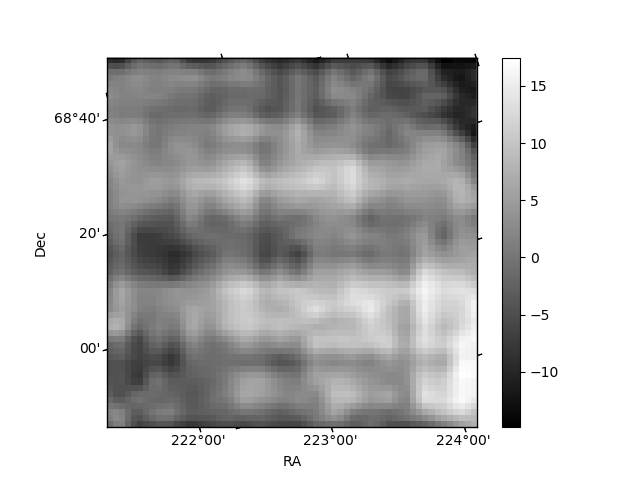
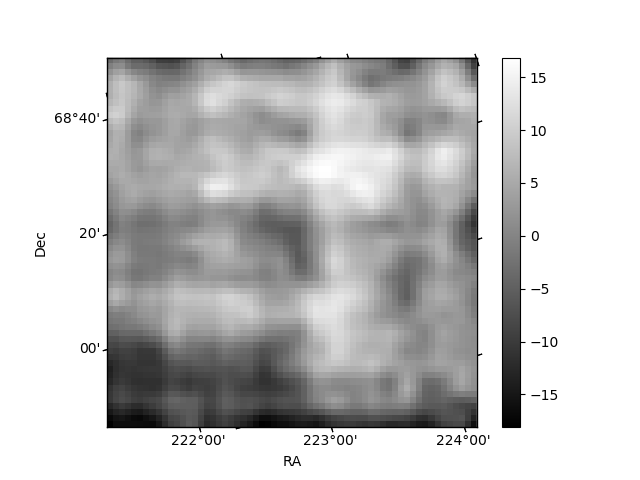
Histogram calculated using DETX and DETY for each event in the final _common_clean file
| Quadrant A | 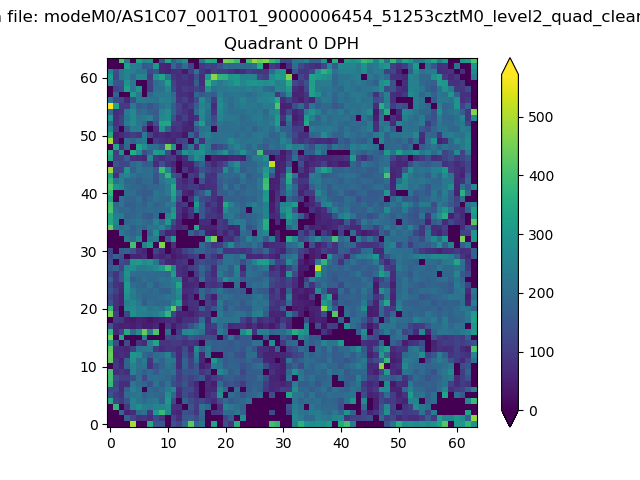 |
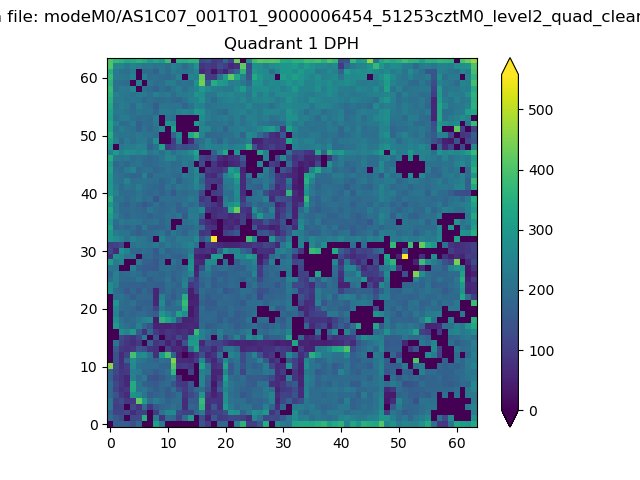 |
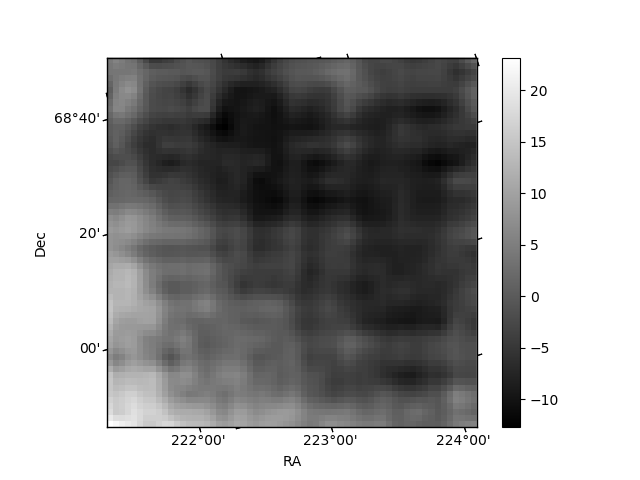
Quadrant B |
|---|---|---|---|
| Quadrant D | 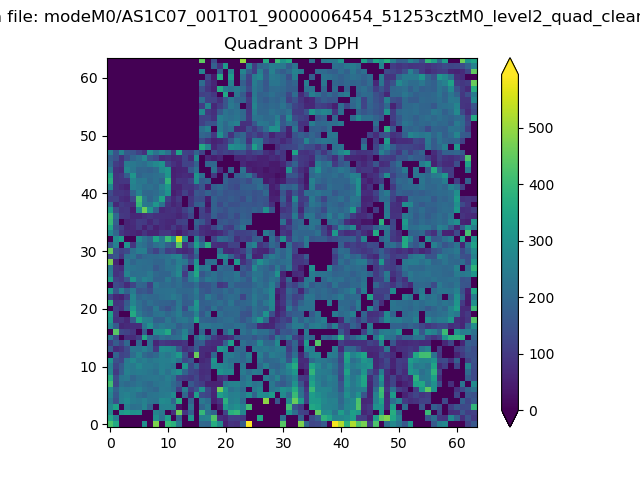 |
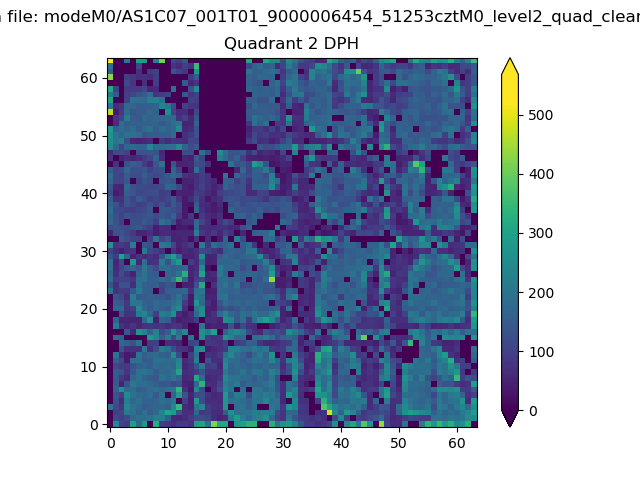 |
Quadrant C |
| Plot type | Count rate plots | Images |
|---|---|---|
| Comparison with Poisson distribution Blue bars denote a histogram of data divided into 1 sec bins. Red curve is a Poisson curve with rate = median count rate of data. |
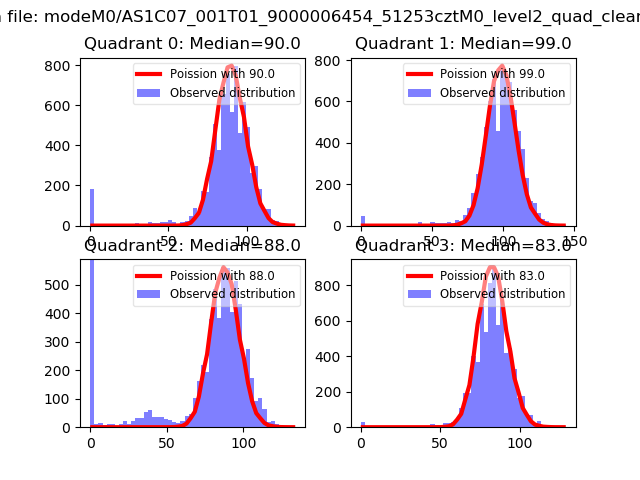 |
 |
| Quadrant-wise count rates Data is divided into 100 sec bins |
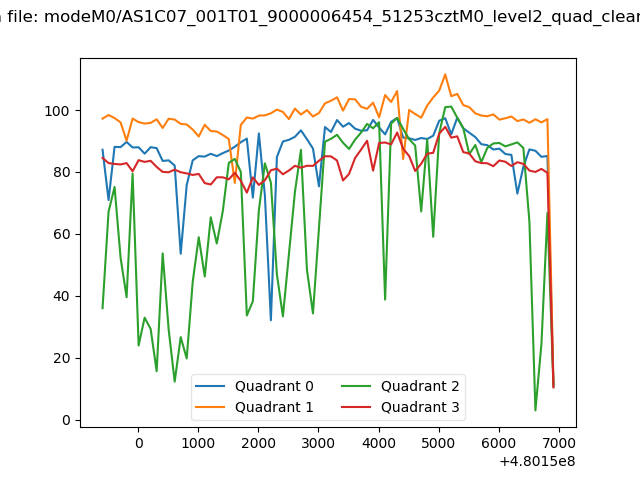 |
|
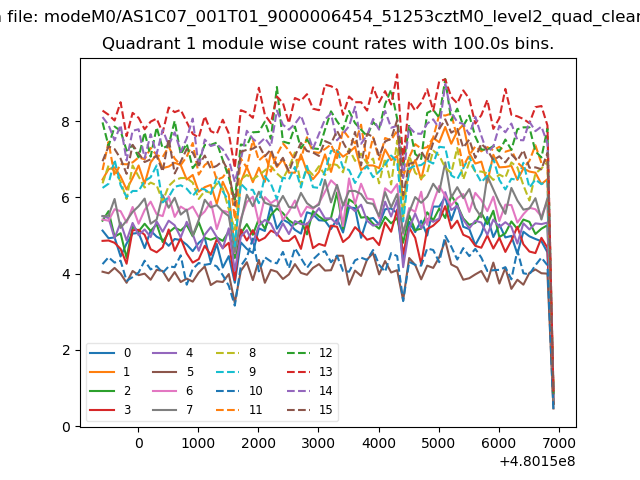
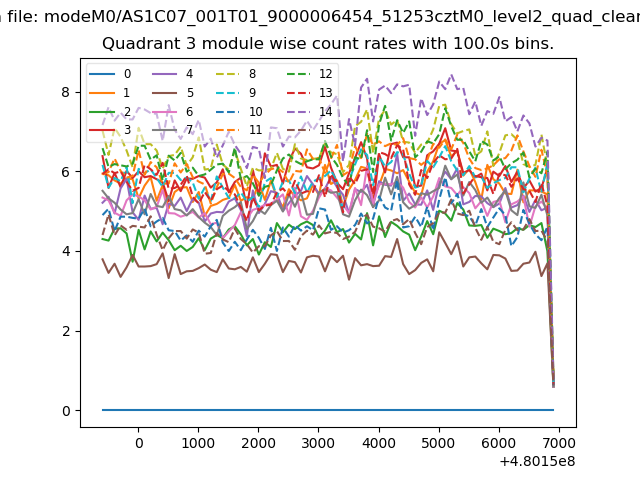
| Module-wise count rates for Quadrant A Data is divided into 100 sec bins |
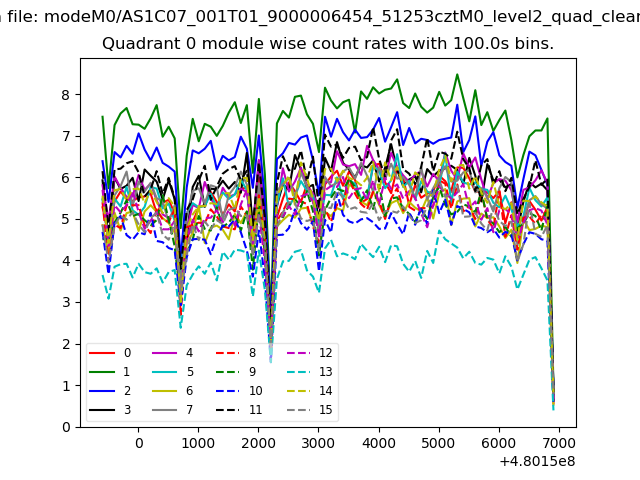 |
 |
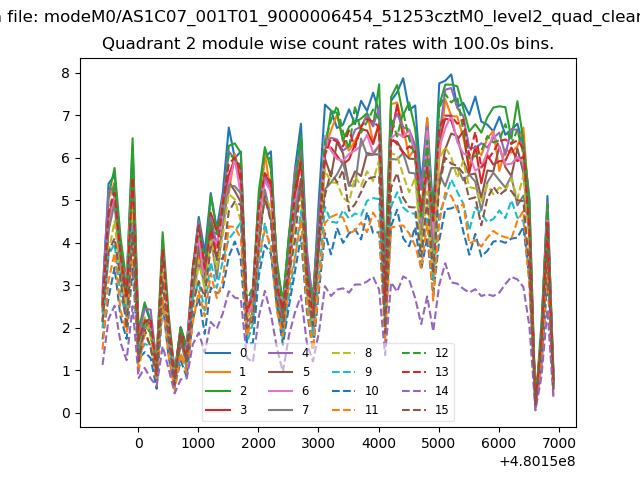
| Module-wise count rates for Quadrant B Data is divided into 100 sec bins |
 |
 |
| Module-wise count rates for Quadrant C Data is divided into 100 sec bins |
 |
 |
| Module-wise count rates for Quadrant D Data is divided into 100 sec bins |
 |
 |
| Parameter | Plot |
|---|---|
| CZT HV Monitor | 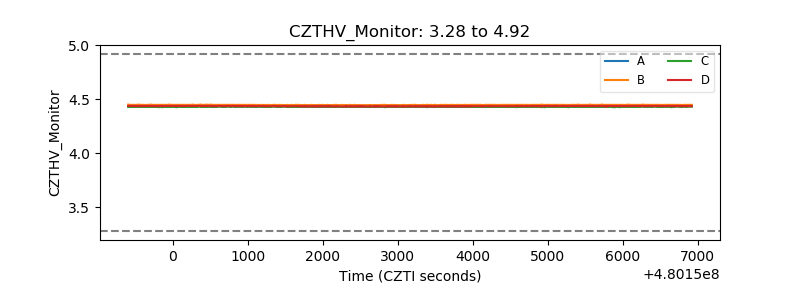 |
| D_VDD | 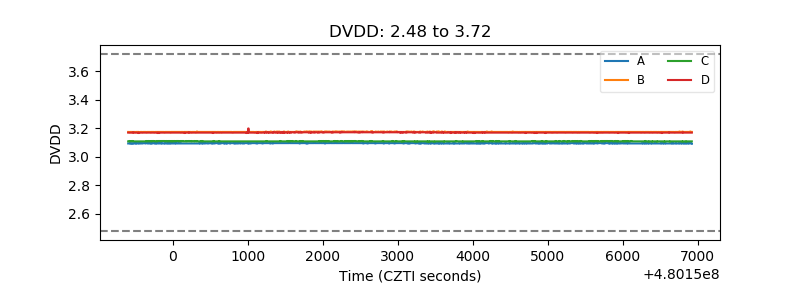 |
| Temperature 1 | 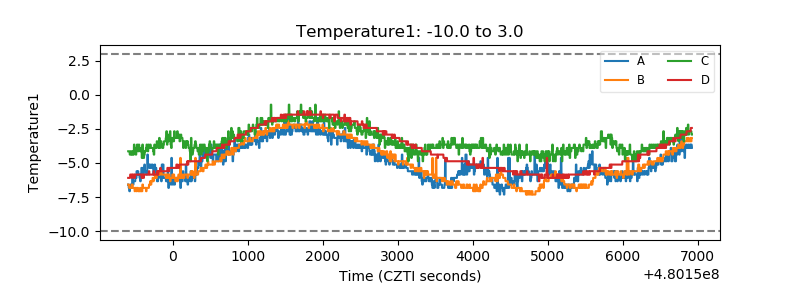 |
| Veto HV Monitor | 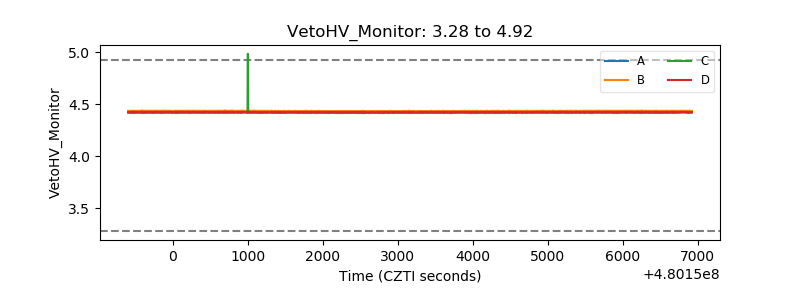 |
| Veto LLD | 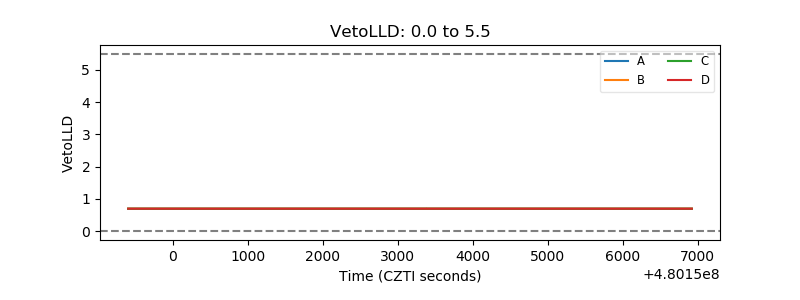 |
| Alpha Counter | 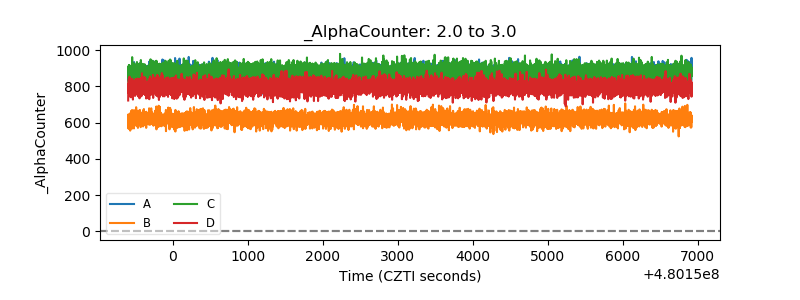 |
| _CPM_Rate | 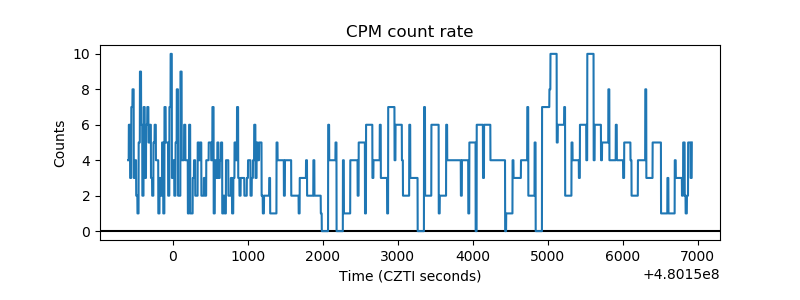 |
| CZT Counter | 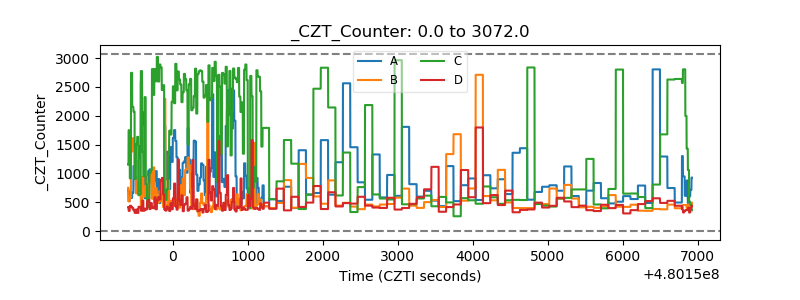 |
| +2.5 Volts monitor | 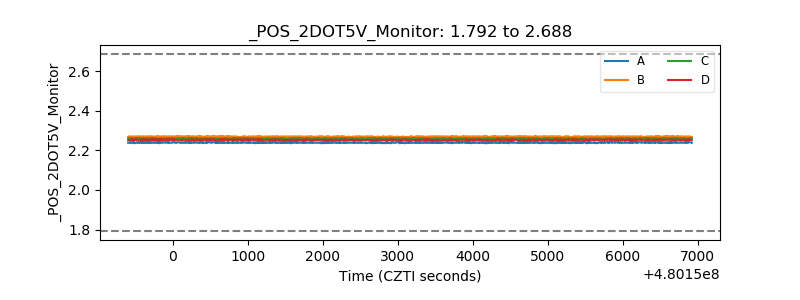 |
| +5 Volts monitor | 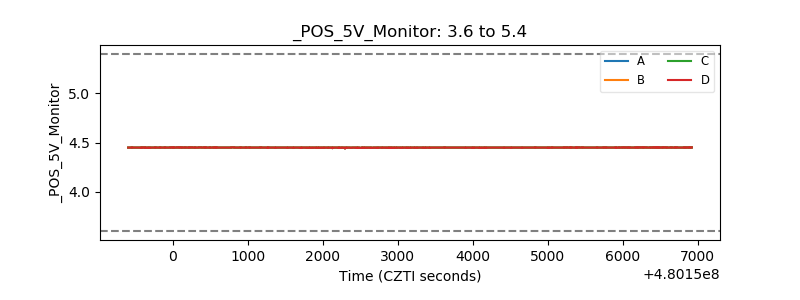 |
| _ROLL_ROT | 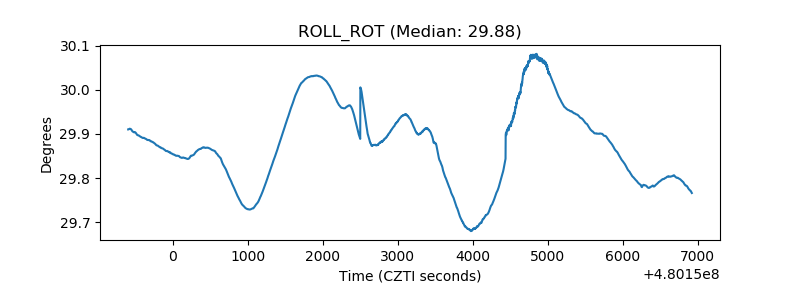 |
| _Roll_DEC | 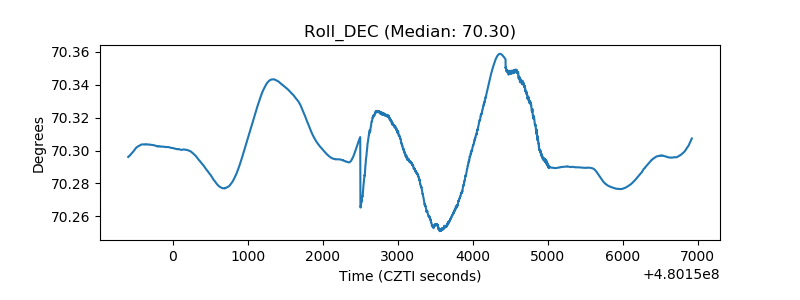 |
| _Roll_RA | 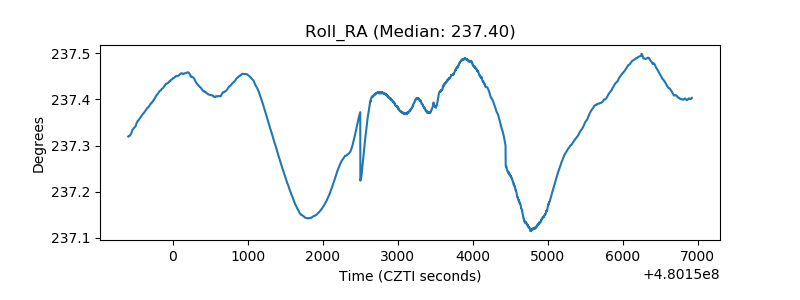 |
| Veto Counter | 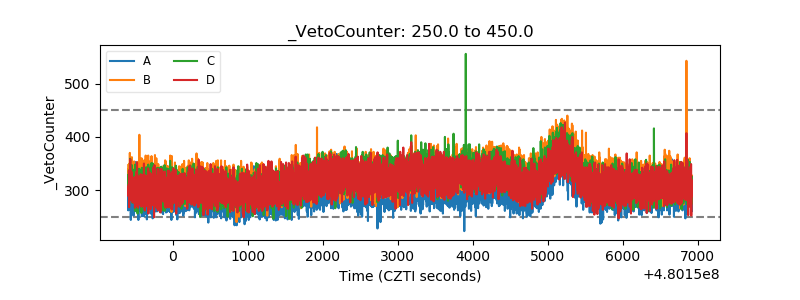 |