| Param | Original file | Final file |
|---|---|---|
| Filename | modeM0/AS1C07_001T01_9000006454_51254cztM0_level2.fits | modeM0/AS1C07_001T01_9000006454_51254cztM0_level2_quad_clean.evt |
| Size (bytes) | 885,398,400 | 94,838,400 |
| Size | 844.4 MB | 90.4 MB |
| Events in quadrant A | 6,968,376 | 657,011 |
| Events in quadrant B | 4,472,948 | 763,911 |
| Events in quadrant C | 14,180,901 | 328,145 |
| Events in quadrant D | 6,553,403 | 584,031 |
| Mode M0 | |||
|---|---|---|---|
| Quadrant | BADHDUFLAG | Total packets | Discarded packets |
| A | 0 | 26040 | 0 |
| B | 0 | 18779 | 1 |
| C | 0 | 47458 | 0 |
| D | 0 | 24997 | 0 |
| Mode SS | |||
|---|---|---|---|
| Quadrant | BADHDUFLAG | Total packets | Discarded packets |
| A | 0 | 154 | 0 |
| B | 0 | 154 | 0 |
| C | 0 | 154 | 0 |
| D | 0 | 154 | 0 |
| Quadrant | Total seconds | Saturated seconds | Saturation percentage |
|---|---|---|---|
| A | 7740 | 658 | 8.501292% |
| B | 7740 | 186 | 2.403101% |
| C | 7740 | 4380 | 56.589147% |
| D | 7740 | 750 | 9.689922% |
Noise dominated data is calculated using 1-second bins in cleaned event files. If a bin has >2000 counts, and if more than 50% of those come from <1% of pixels, then it is considered to be noise-dominated and hence unusable.
| Quadrant | # 1 sec bins | Bins with >0 counts | Bins with >2000 counts | High rate bins dominated by noise | Noise dominated (total time) | Noise dominated (detector-on time) | Marked lightcurve |
|---|---|---|---|---|---|---|---|
| A | 7740 | 7740 | 482 | 482 | 6.23% | 6.23% | 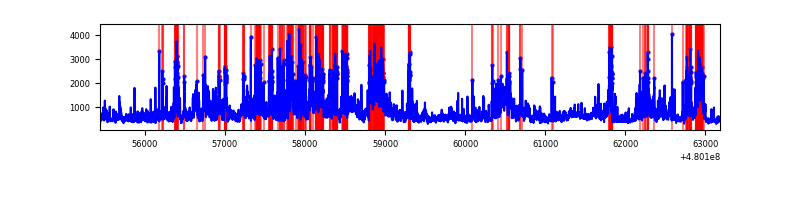 |
| B | 7740 | 7740 | 91 | 91 | 1.18% | 1.18% | 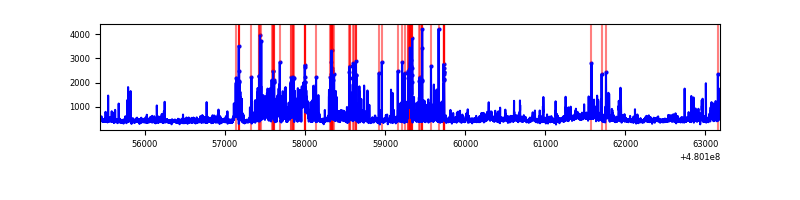 |
| C | 7739 | 7739 | 3814 | 3814 | 49.28% | 49.28% | 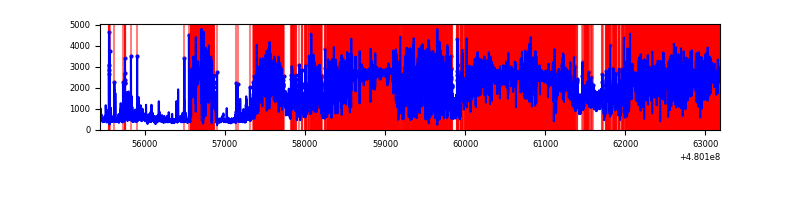 |
| D | 7740 | 7740 | 706 | 706 | 9.12% | 9.12% | 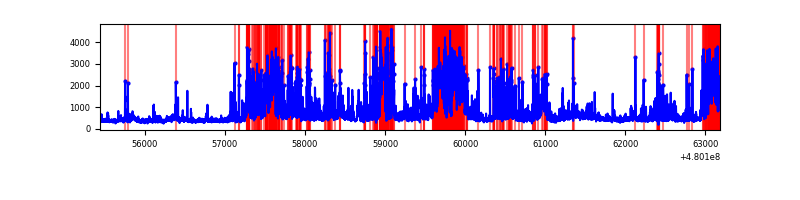 |
Top three noisy pixels from each quadrant. If the there are fewer than three noisy pixels in the level2.evt file, extra rows are filled as -1
| Pixel properties | Quadrant properties | ||||||
|---|---|---|---|---|---|---|---|
| Quadrant | DetID | PixID | Counts | Sigma | Mean | Median | Sigma |
| A | 12 | 250 | 1588611 | 8086.24 | 778 | 756 | 196.4 |
| A | 12 | 3 | 1200159 | 6108.03 | 778 | 756 | 196.4 |
| A | 4 | 249 | 204640 | 1038.29 | 778 | 756 | 196.4 |
| B | 4 | 171 | 444950 | 2627.09 | 792 | 764 | 169.1 |
| B | 7 | 252 | 202162 | 1191.15 | 792 | 764 | 169.1 |
| B | 8 | 128 | 130491 | 767.26 | 792 | 764 | 169.1 |
| C | 4 | 12 | 4939154 | 32327.88 | 544 | 542 | 152.8 |
| C | 15 | 205 | 4749693 | 31087.68 | 544 | 542 | 152.8 |
| C | 3 | 242 | 1147064 | 7505.07 | 544 | 542 | 152.8 |
| D | 7 | 60 | 1368102 | 6546.89 | 740 | 714 | 208.9 |
| D | 8 | 176 | 956832 | 4577.78 | 740 | 714 | 208.9 |
| D | 7 | 96 | 279498 | 1334.78 | 740 | 714 | 208.9 |
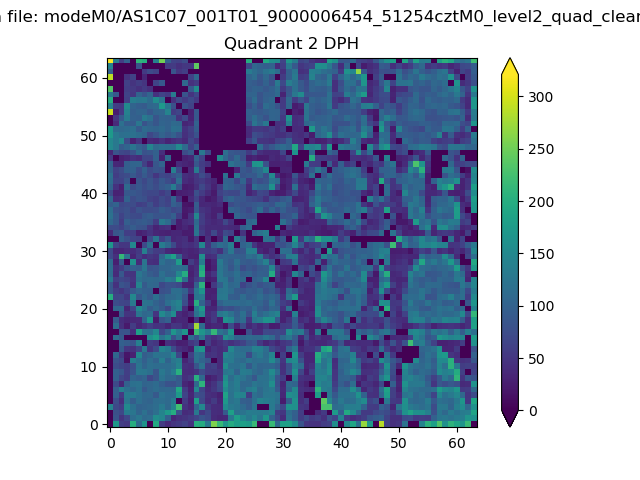
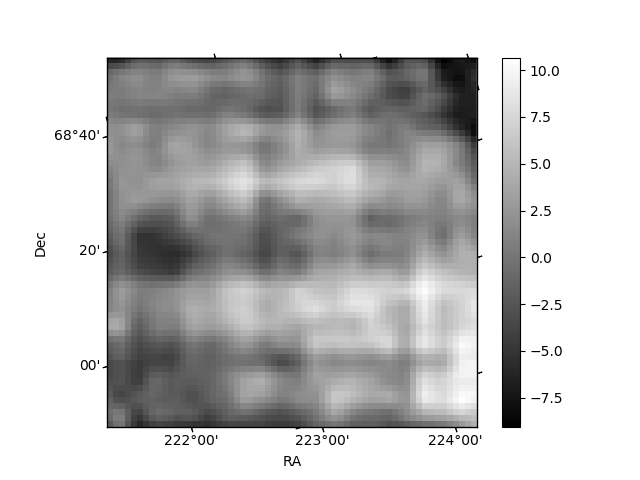
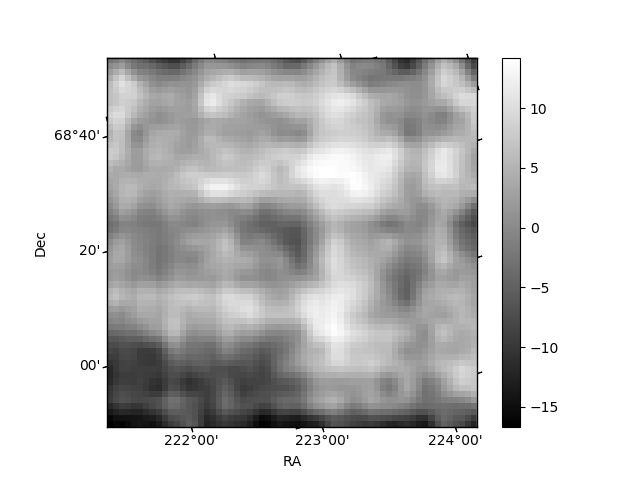
Histogram calculated using DETX and DETY for each event in the final _common_clean file
| Quadrant A | 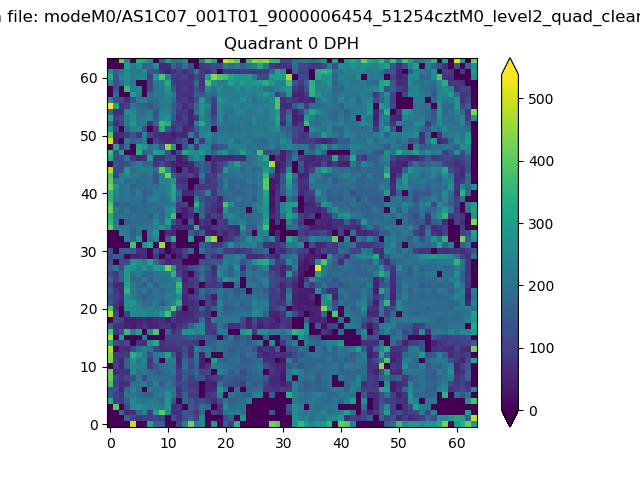 |
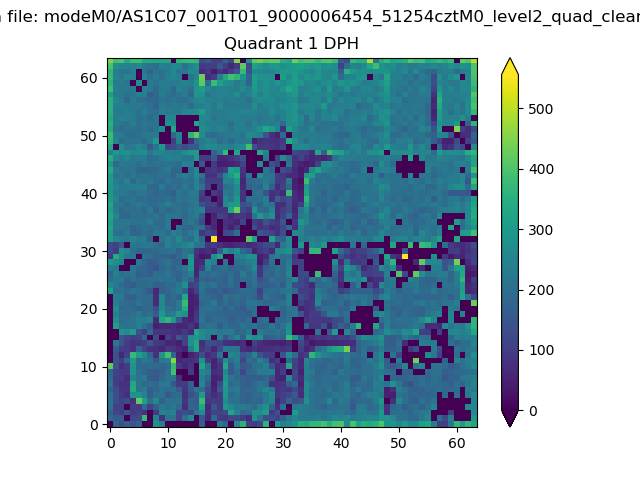 |
Quadrant B |
|---|---|---|---|
| Quadrant D | 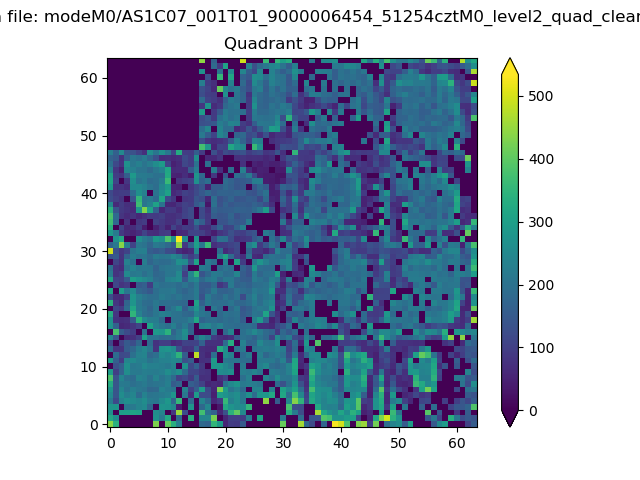 |
 |
Quadrant C |
| Plot type | Count rate plots | Images |
|---|---|---|
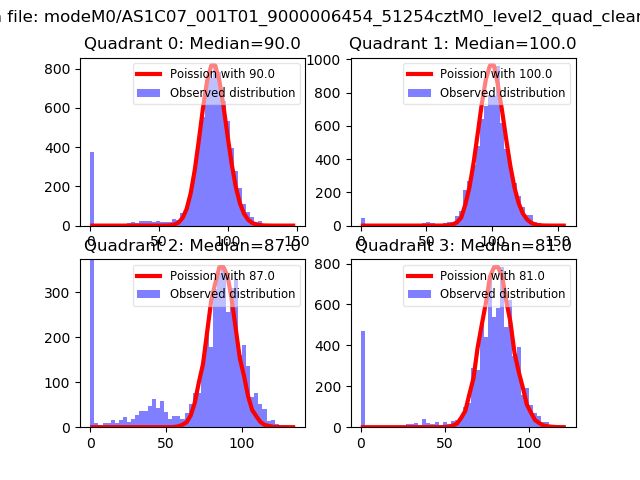
| Comparison with Poisson distribution Blue bars denote a histogram of data divided into 1 sec bins. Red curve is a Poisson curve with rate = median count rate of data. |
 |
 |
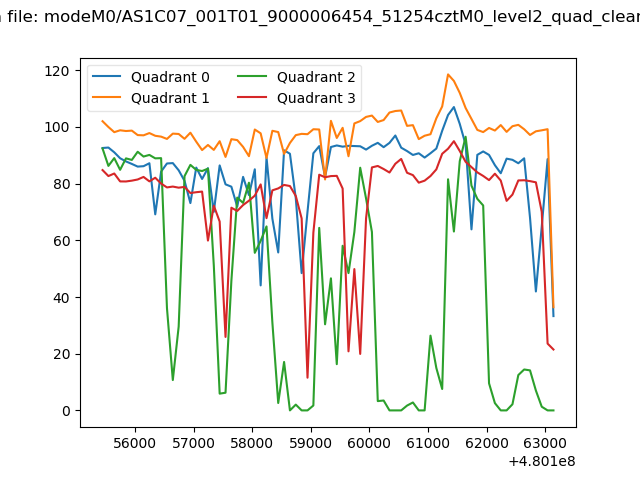
| Quadrant-wise count rates Data is divided into 100 sec bins |
 |
|
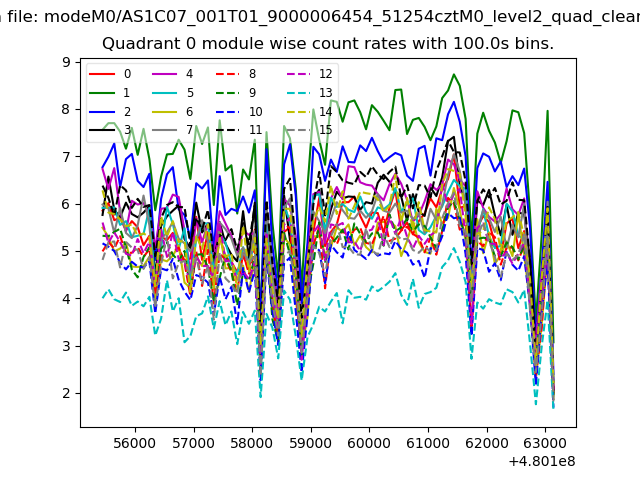
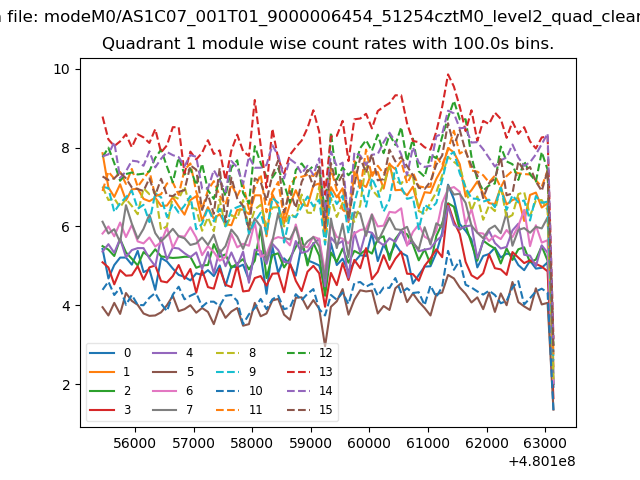
| Module-wise count rates for Quadrant A Data is divided into 100 sec bins |
 |
 |
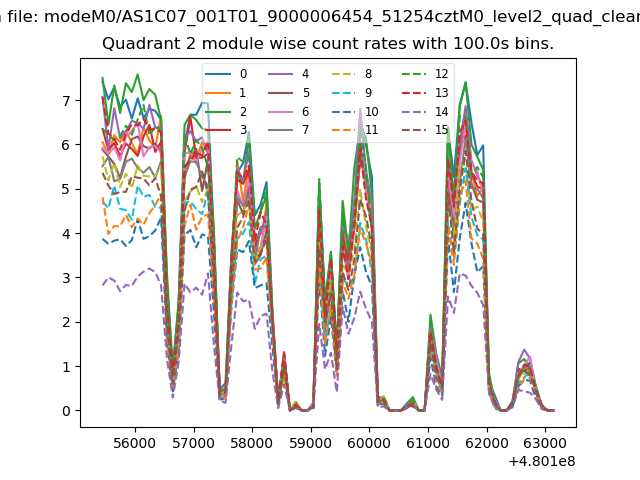
| Module-wise count rates for Quadrant B Data is divided into 100 sec bins |
 |
 |
| Module-wise count rates for Quadrant C Data is divided into 100 sec bins |
 |
 |
| Module-wise count rates for Quadrant D Data is divided into 100 sec bins |
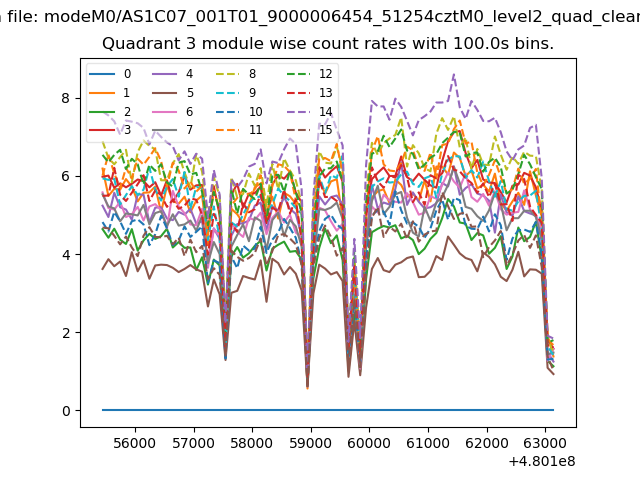 |
 |
| Parameter | Plot |
|---|---|
| CZT HV Monitor | 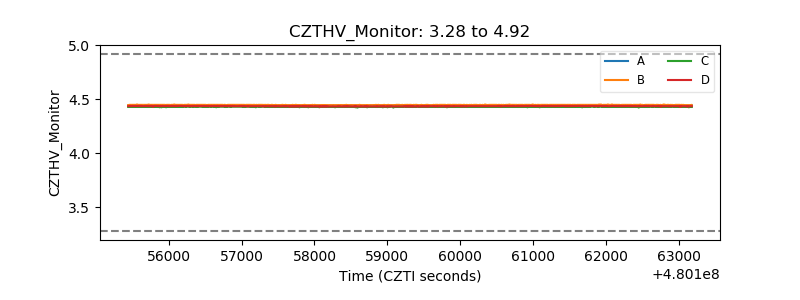 |
| D_VDD | 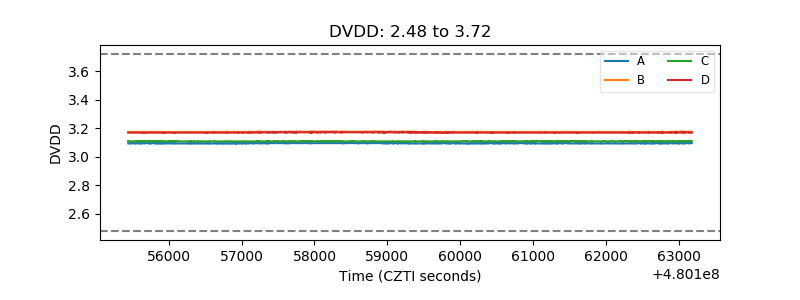 |
| Temperature 1 | 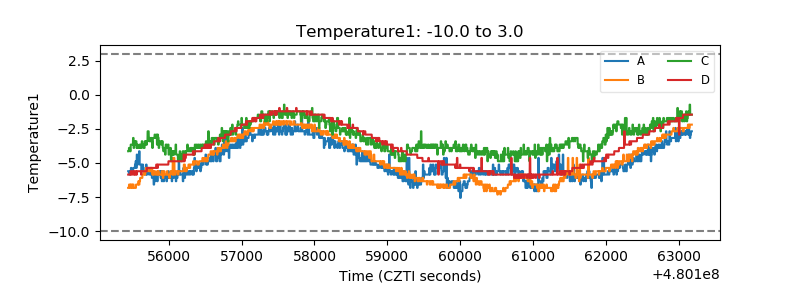 |
| Veto HV Monitor |  |
| Veto LLD | 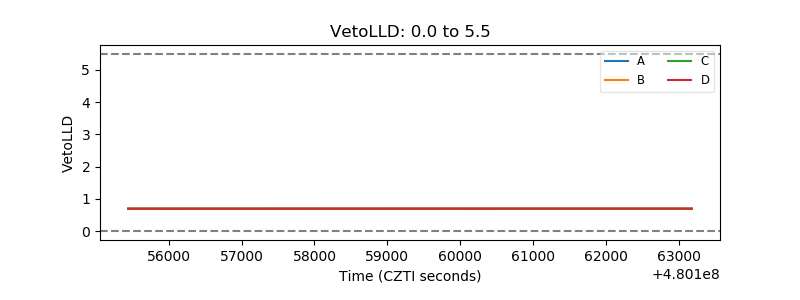 |
| Alpha Counter | 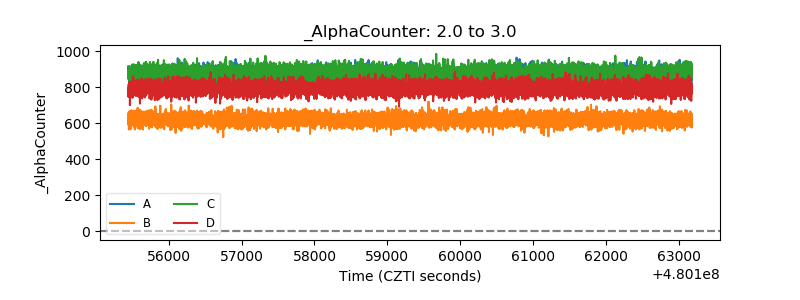 |
| _CPM_Rate | 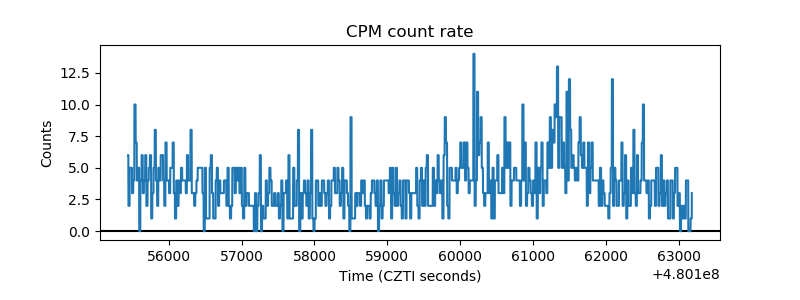 |
| CZT Counter | 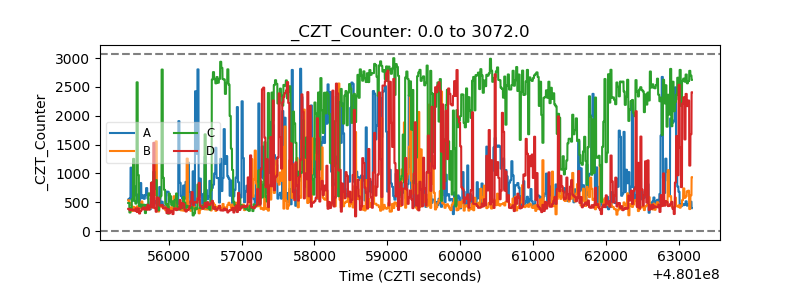 |
| +2.5 Volts monitor | 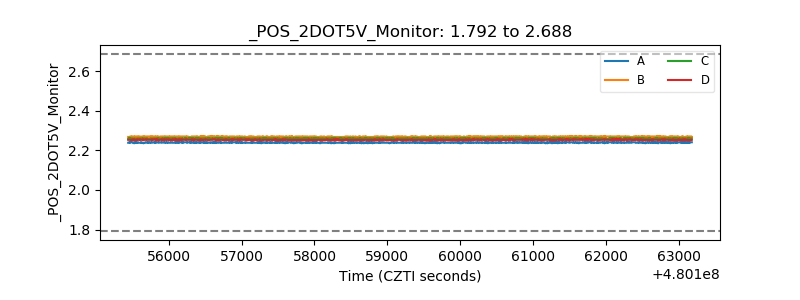 |
| +5 Volts monitor | 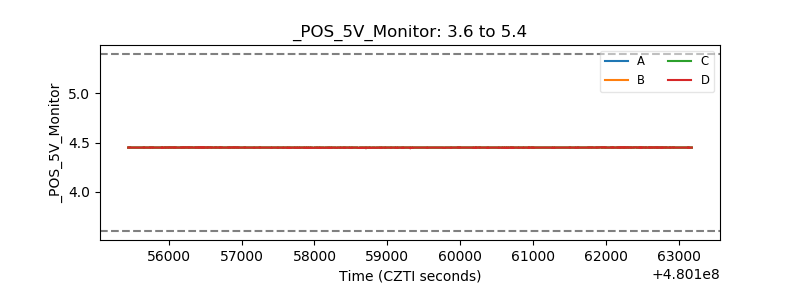 |
| _ROLL_ROT | 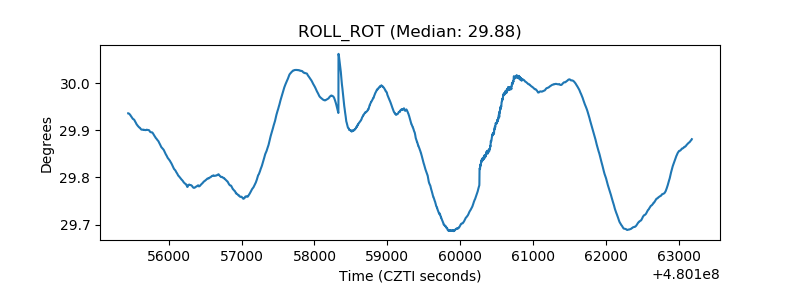 |
| _Roll_DEC | 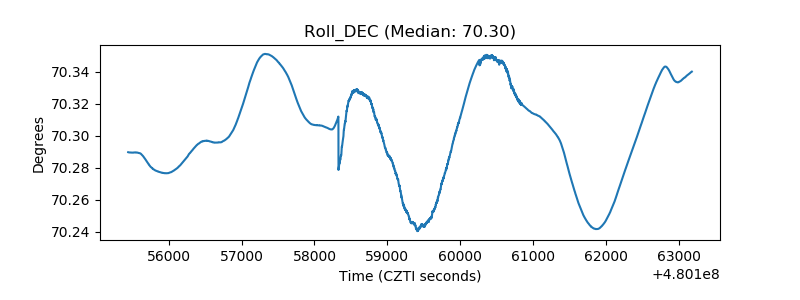 |
| _Roll_RA | 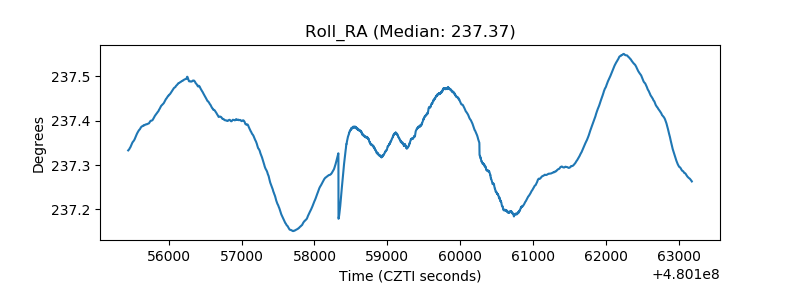 |
| Veto Counter | 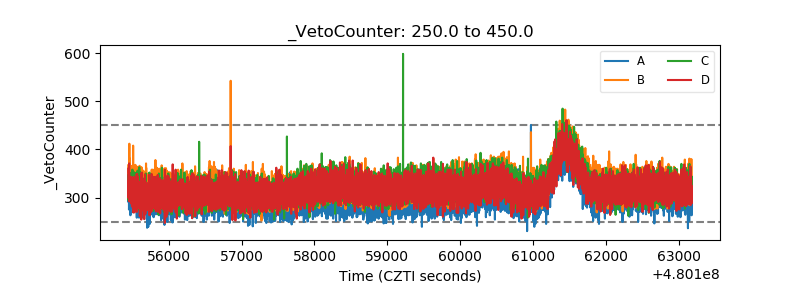 |