| Param | Original file | Final file |
|---|---|---|
| Filename | modeM0/AS1C07_001T01_9000006454_51258cztM0_level2.fits | modeM0/AS1C07_001T01_9000006454_51258cztM0_level2_quad_clean.evt |
| Size (bytes) | 719,026,560 | 88,548,480 |
| Size | 685.7 MB | 84.4 MB |
| Events in quadrant A | 6,317,346 | 607,049 |
| Events in quadrant B | 4,500,545 | 666,392 |
| Events in quadrant C | 10,709,496 | 375,004 |
| Events in quadrant D | 4,563,493 | 559,793 |
| Mode M0 | |||
|---|---|---|---|
| Quadrant | BADHDUFLAG | Total packets | Discarded packets |
| A | 0 | 23496 | 3 |
| B | 0 | 18066 | 2 |
| C | 0 | 36429 | 2 |
| D | 0 | 18496 | 2 |
| Mode SS | |||
|---|---|---|---|
| Quadrant | BADHDUFLAG | Total packets | Discarded packets |
| A | 0 | 138 | 0 |
| B | 0 | 138 | 0 |
| C | 0 | 138 | 0 |
| D | 0 | 138 | 0 |
| Mode M9 | |||
|---|---|---|---|
| Quadrant | BADHDUFLAG | Total packets | Discarded packets |
| A | 0 | 11 | 0 |
| B | 0 | 12 | 0 |
| C | 0 | 12 | 0 |
| D | 0 | 12 | 0 |
| Quadrant | Total seconds | Saturated seconds | Saturation percentage |
|---|---|---|---|
| A | 6780 | 439 | 6.474926% |
| B | 6780 | 393 | 5.796460% |
| C | 6780 | 2980 | 43.952802% |
| D | 6780 | 334 | 4.926254% |
Noise dominated data is calculated using 1-second bins in cleaned event files. If a bin has >2000 counts, and if more than 50% of those come from <1% of pixels, then it is considered to be noise-dominated and hence unusable.
| Quadrant | # 1 sec bins | Bins with >0 counts | Bins with >2000 counts | High rate bins dominated by noise | Noise dominated (total time) | Noise dominated (detector-on time) | Marked lightcurve |
|---|---|---|---|---|---|---|---|
| A | 7680 | 6781 | 289 | 289 | 3.76% | 4.26% | 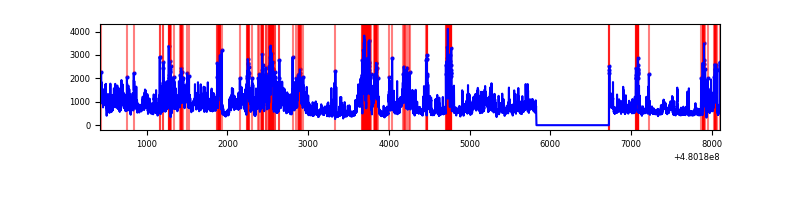 |
| B | 7680 | 6780 | 202 | 202 | 2.63% | 2.98% | 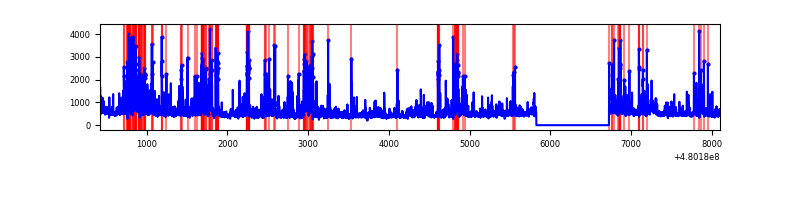 |
| C | 7679 | 6780 | 2601 | 2601 | 33.87% | 38.36% | 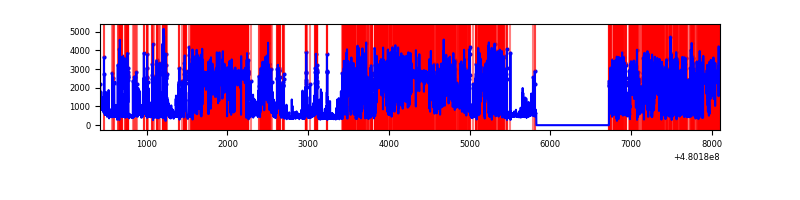 |
| D | 7680 | 6781 | 215 | 215 | 2.80% | 3.17% | 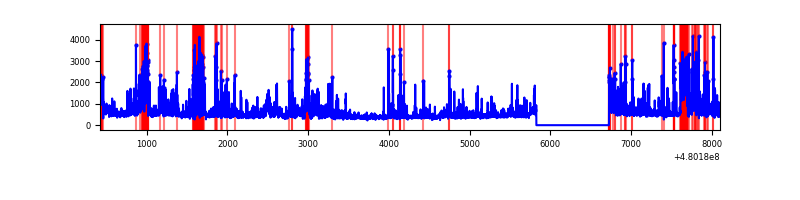 |
Top three noisy pixels from each quadrant. If the there are fewer than three noisy pixels in the level2.evt file, extra rows are filled as -1
| Pixel properties | Quadrant properties | ||||||
|---|---|---|---|---|---|---|---|
| Quadrant | DetID | PixID | Counts | Sigma | Mean | Median | Sigma |
| A | 12 | 3 | 1632117 | 9215.14 | 716 | 698 | 177.0 |
| A | 12 | 250 | 732545 | 4133.87 | 716 | 698 | 177.0 |
| A | 12 | 194 | 184335 | 1037.28 | 716 | 698 | 177.0 |
| B | 5 | 185 | 612015 | 3966.11 | 714 | 687 | 154.1 |
| B | 8 | 128 | 306226 | 1982.25 | 714 | 687 | 154.1 |
| B | 0 | 245 | 137367 | 886.74 | 714 | 687 | 154.1 |
| C | 4 | 12 | 5762247 | 37789.06 | 553 | 550 | 152.5 |
| C | 15 | 205 | 1933823 | 12679.7 | 553 | 550 | 152.5 |
| C | 3 | 233 | 515767 | 3379.14 | 553 | 550 | 152.5 |
| D | 3 | 12 | 439802 | 2245.67 | 697 | 671 | 195.5 |
| D | 2 | 216 | 246779 | 1258.57 | 697 | 671 | 195.5 |
| D | 8 | 176 | 236209 | 1204.52 | 697 | 671 | 195.5 |
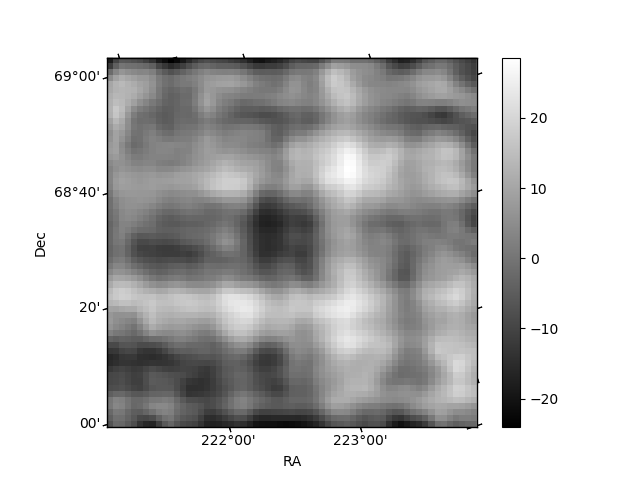
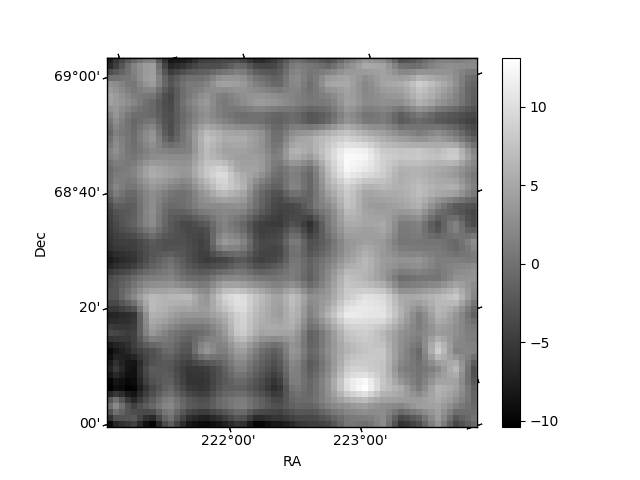
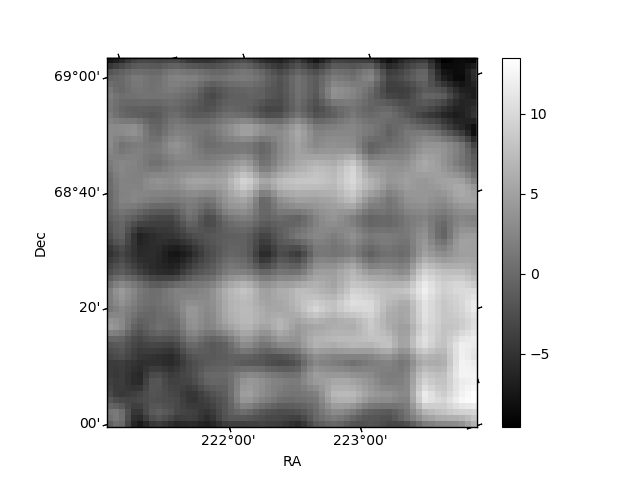
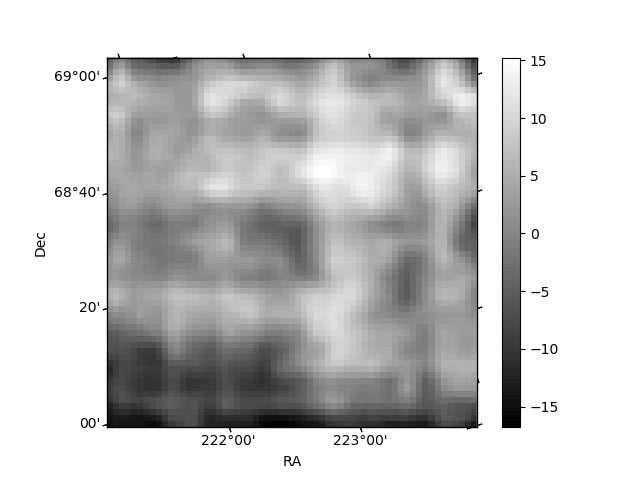
Histogram calculated using DETX and DETY for each event in the final _common_clean file
| Quadrant A | 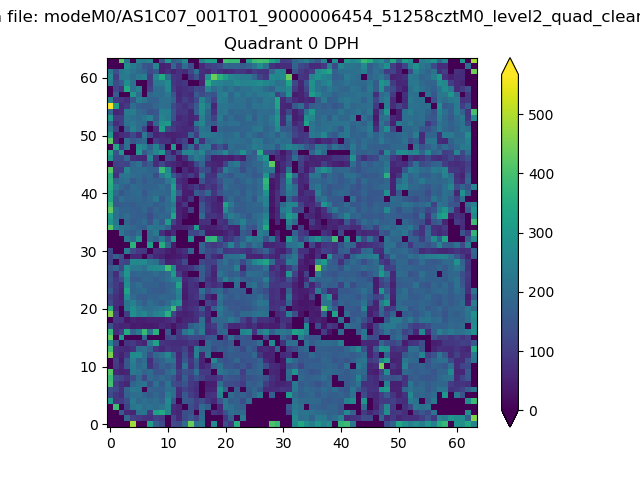 |
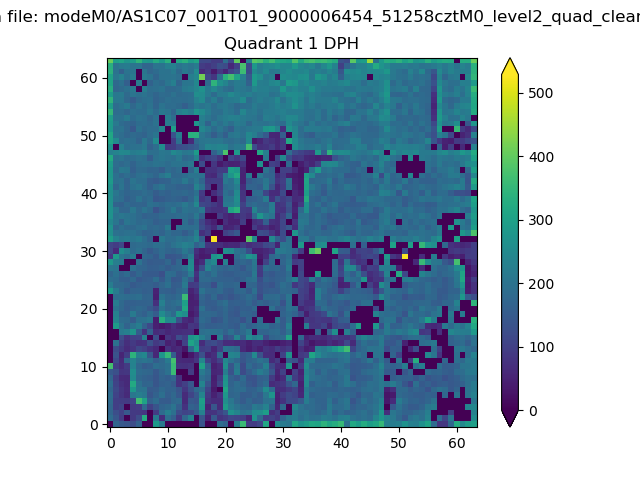 |
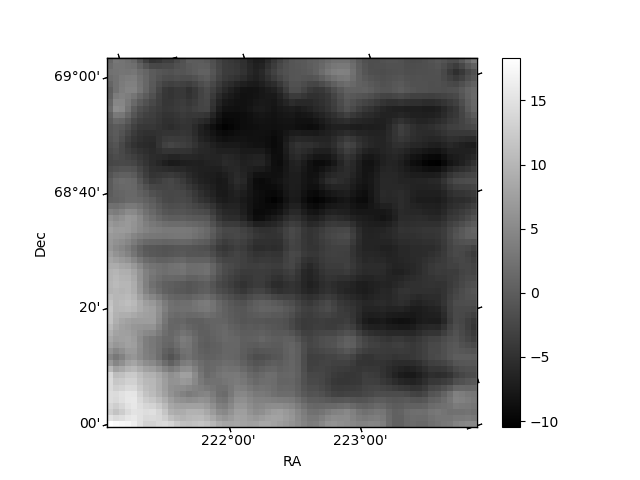
Quadrant B |
|---|---|---|---|
| Quadrant D | 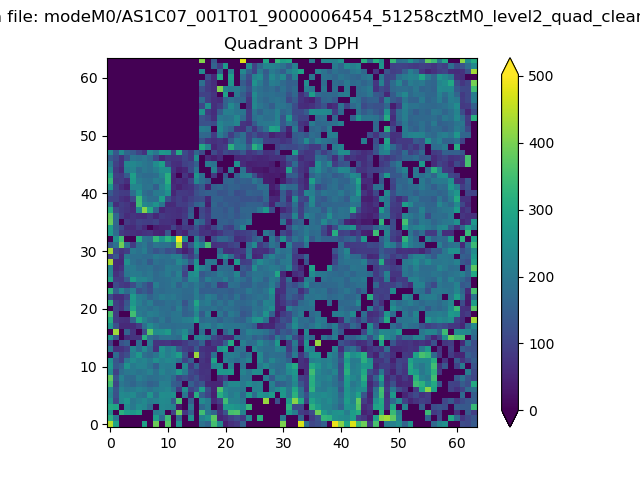 |
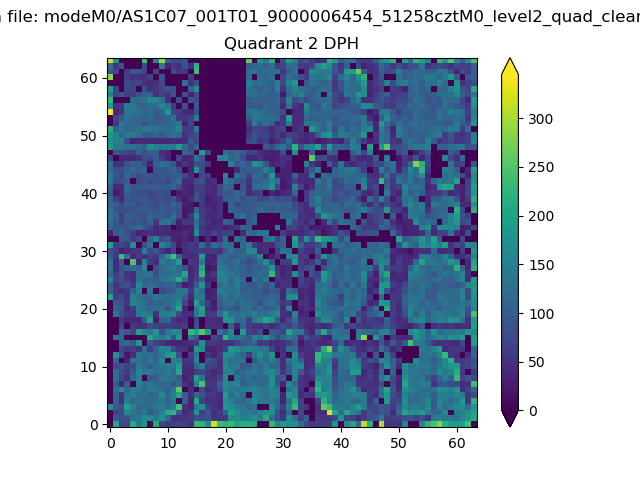 |
Quadrant C |
| Plot type | Count rate plots | Images |
|---|---|---|
| Comparison with Poisson distribution Blue bars denote a histogram of data divided into 1 sec bins. Red curve is a Poisson curve with rate = median count rate of data. |
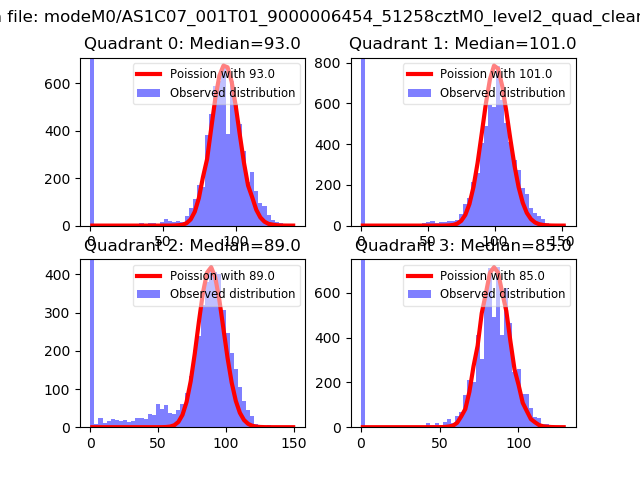 |
 |
| Quadrant-wise count rates Data is divided into 100 sec bins |
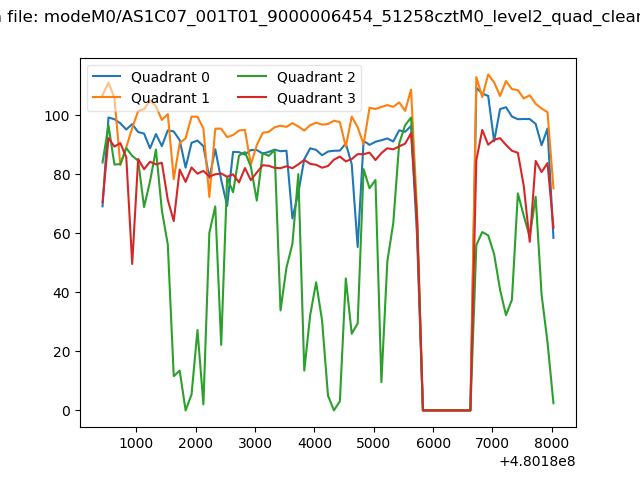 |
|
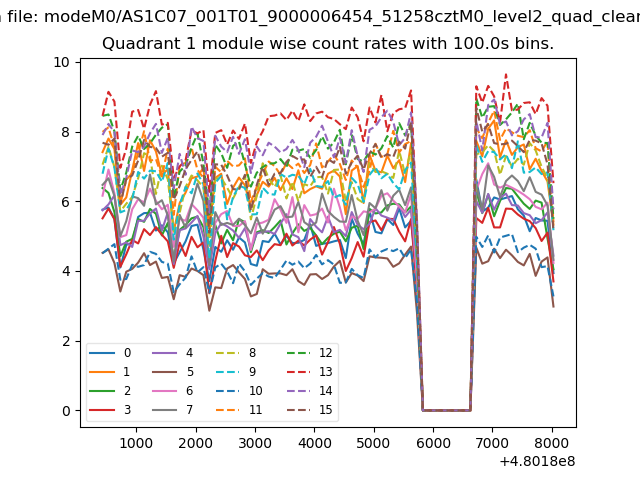
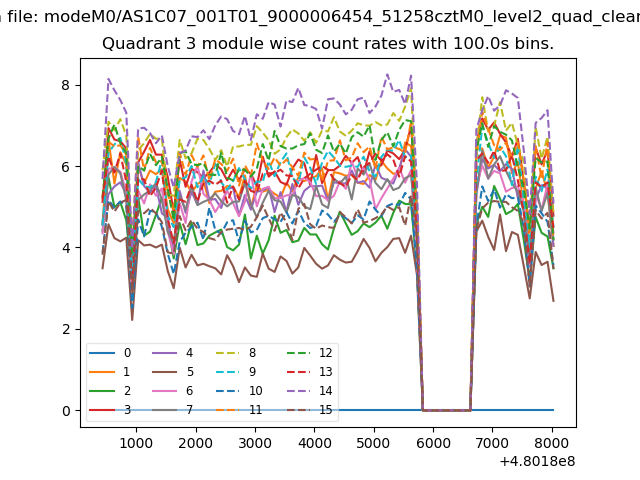
| Module-wise count rates for Quadrant A Data is divided into 100 sec bins |
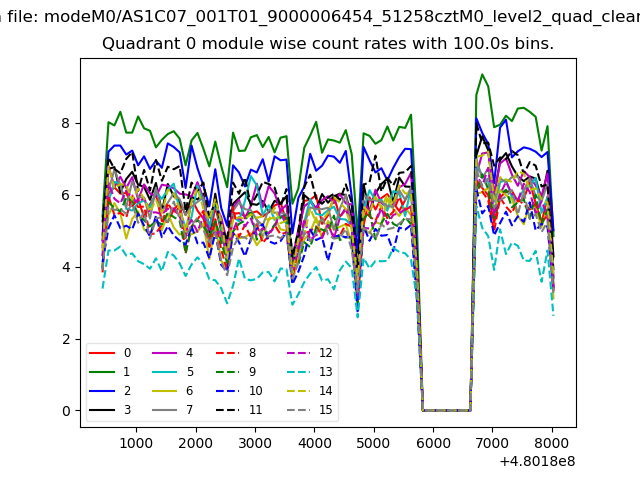 |
 |
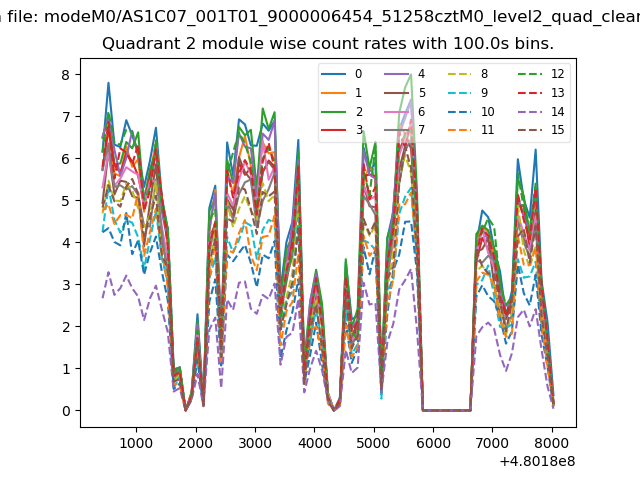
| Module-wise count rates for Quadrant B Data is divided into 100 sec bins |
 |
 |
| Module-wise count rates for Quadrant C Data is divided into 100 sec bins |
 |
 |
| Module-wise count rates for Quadrant D Data is divided into 100 sec bins |
 |
 |
| Parameter | Plot |
|---|---|
| CZT HV Monitor | 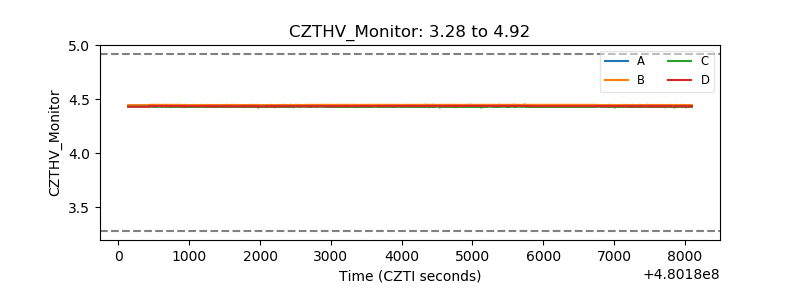 |
| D_VDD | 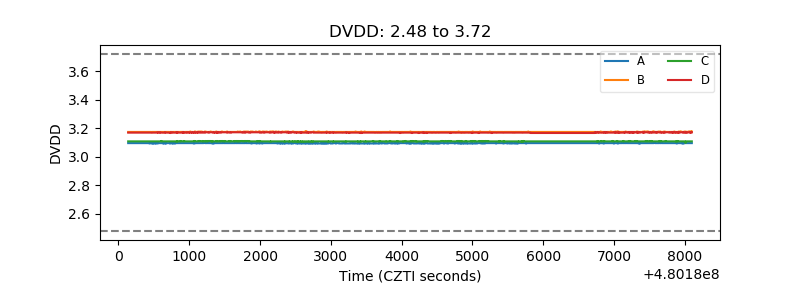 |
| Temperature 1 | 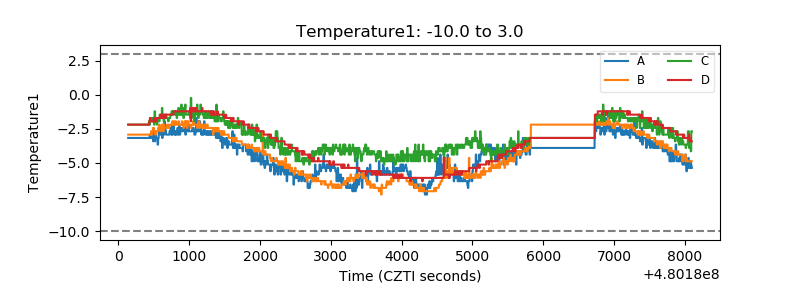 |
| Veto HV Monitor | 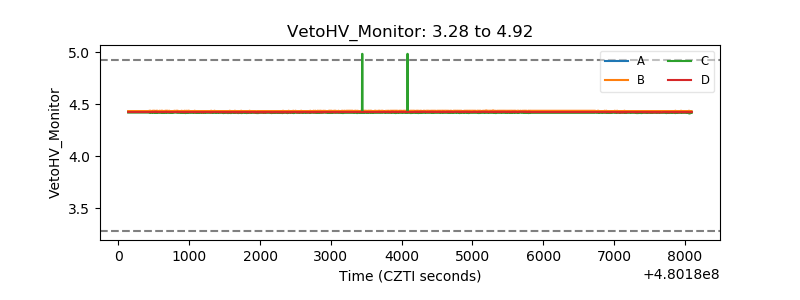 |
| Veto LLD | 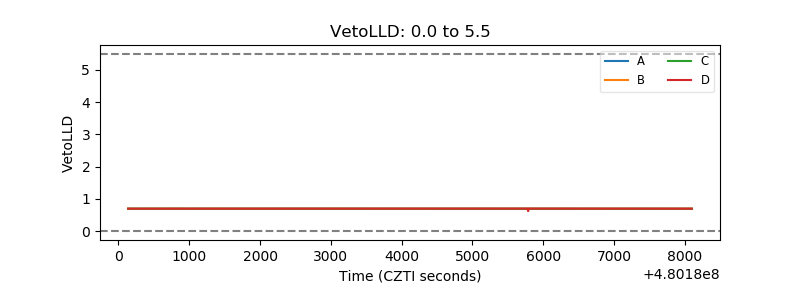 |
| Alpha Counter | 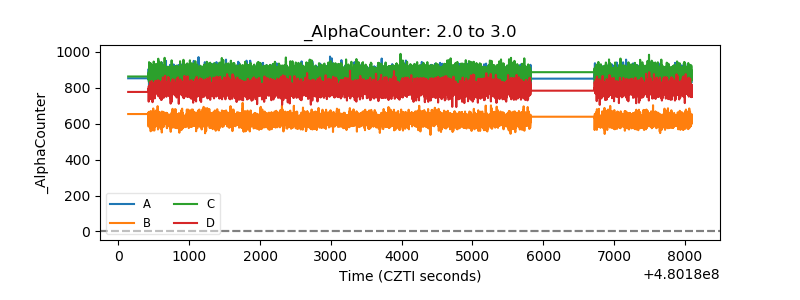 |
| _CPM_Rate | 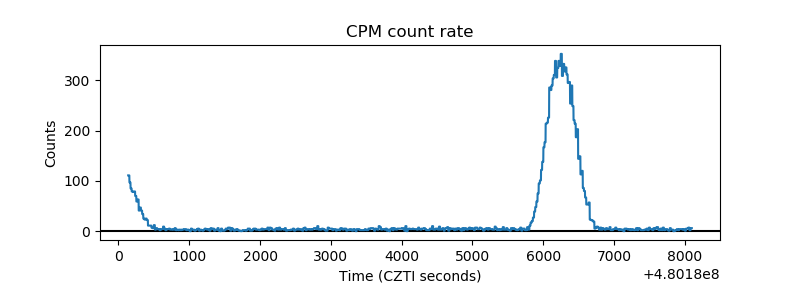 |
| CZT Counter | 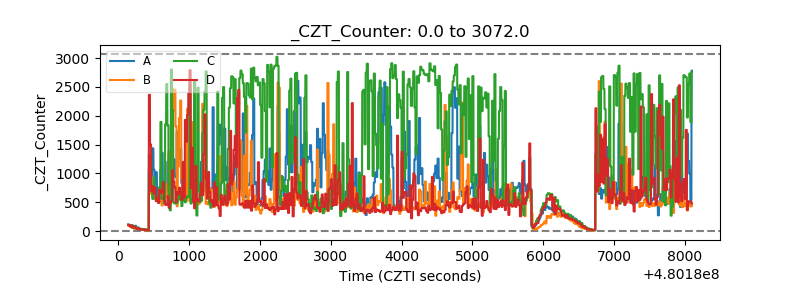 |
| +2.5 Volts monitor | 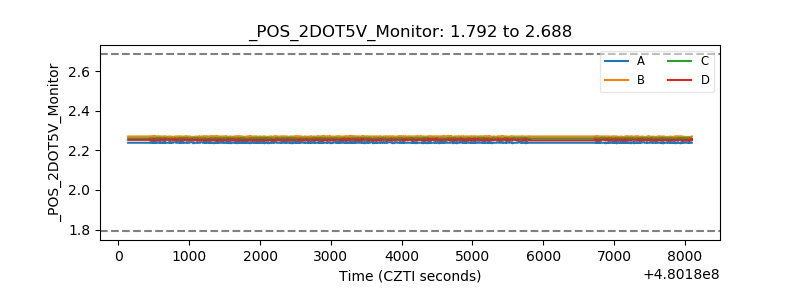 |
| +5 Volts monitor | 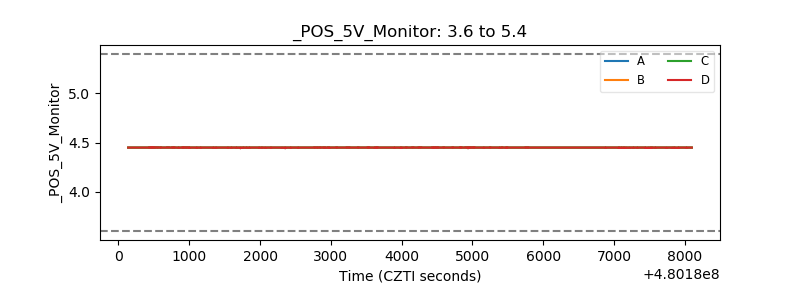 |
| _ROLL_ROT | 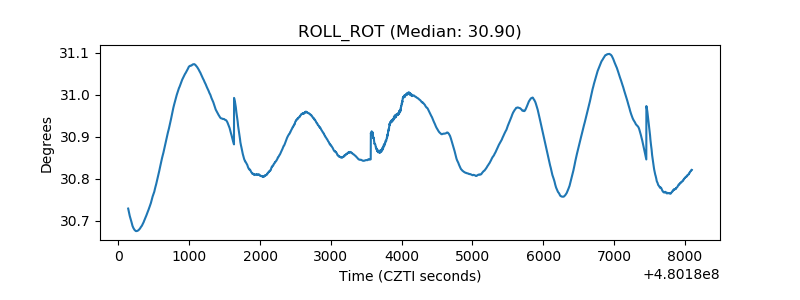 |
| _Roll_DEC | 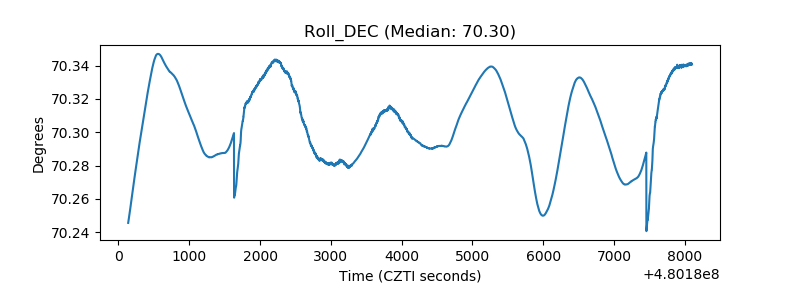 |
| _Roll_RA | 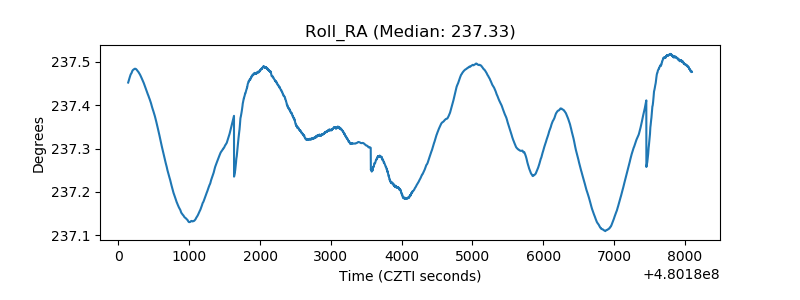 |
| Veto Counter | 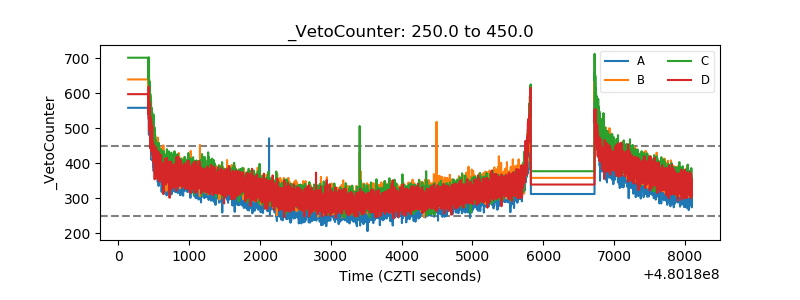 |