| Param | Original file | Final file |
|---|---|---|
| Filename | modeM0/AS1C07_001T01_9000006454_51260cztM0_level2.fits | modeM0/AS1C07_001T01_9000006454_51260cztM0_level2_quad_clean.evt |
| Size (bytes) | 700,266,240 | 85,512,960 |
| Size | 667.8 MB | 81.6 MB |
| Events in quadrant A | 5,340,162 | 610,492 |
| Events in quadrant B | 4,149,375 | 666,675 |
| Events in quadrant C | 11,430,365 | 303,717 |
| Events in quadrant D | 4,495,888 | 553,115 |
| Mode M0 | |||
|---|---|---|---|
| Quadrant | BADHDUFLAG | Total packets | Discarded packets |
| A | 0 | 20387 | 2 |
| B | 0 | 16850 | 2 |
| C | 0 | 38420 | 2 |
| D | 0 | 18043 | 2 |
| Mode SS | |||
|---|---|---|---|
| Quadrant | BADHDUFLAG | Total packets | Discarded packets |
| A | 0 | 132 | 0 |
| B | 0 | 132 | 0 |
| C | 0 | 132 | 0 |
| D | 0 | 132 | 0 |
| Mode M9 | |||
|---|---|---|---|
| Quadrant | BADHDUFLAG | Total packets | Discarded packets |
| A | 0 | 15 | 0 |
| B | 0 | 16 | 0 |
| C | 0 | 16 | 0 |
| D | 0 | 16 | 0 |
| Quadrant | Total seconds | Saturated seconds | Saturation percentage |
|---|---|---|---|
| A | 6527 | 256 | 3.922169% |
| B | 6527 | 242 | 3.707676% |
| C | 6527 | 3482 | 53.347633% |
| D | 6526 | 298 | 4.566350% |
Noise dominated data is calculated using 1-second bins in cleaned event files. If a bin has >2000 counts, and if more than 50% of those come from <1% of pixels, then it is considered to be noise-dominated and hence unusable.
| Quadrant | # 1 sec bins | Bins with >0 counts | Bins with >2000 counts | High rate bins dominated by noise | Noise dominated (total time) | Noise dominated (detector-on time) | Marked lightcurve |
|---|---|---|---|---|---|---|---|
| A | 7587 | 6527 | 175 | 175 | 2.31% | 2.68% | 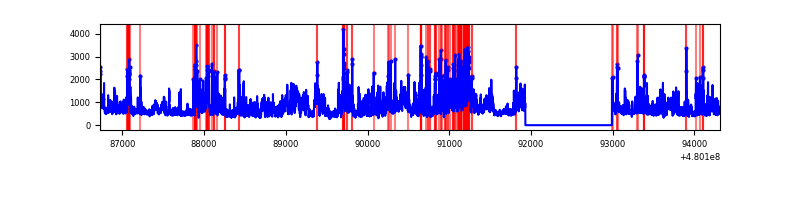 |
| B | 7587 | 6527 | 144 | 144 | 1.90% | 2.21% | 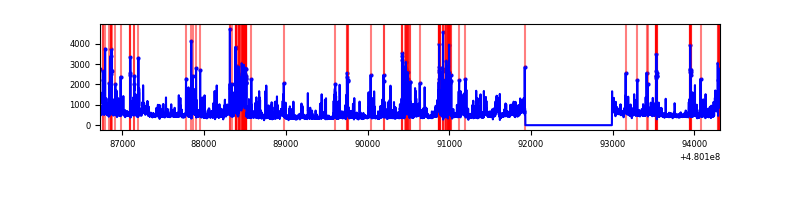 |
| C | 7586 | 6526 | 3145 | 3145 | 41.46% | 48.19% | 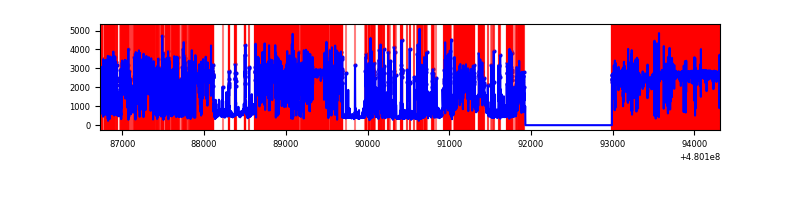 |
| D | 7586 | 6527 | 239 | 239 | 3.15% | 3.66% | 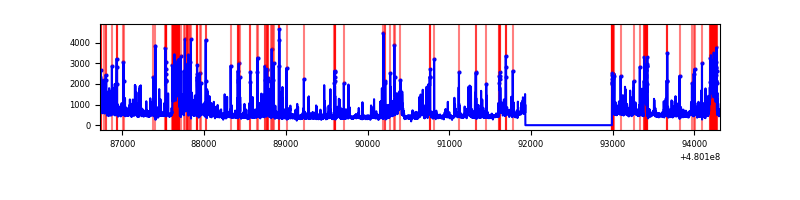 |
Top three noisy pixels from each quadrant. If the there are fewer than three noisy pixels in the level2.evt file, extra rows are filled as -1
| Pixel properties | Quadrant properties | ||||||
|---|---|---|---|---|---|---|---|
| Quadrant | DetID | PixID | Counts | Sigma | Mean | Median | Sigma |
| A | 12 | 3 | 1370995 | 7914.48 | 692 | 674 | 173.1 |
| A | 3 | 79 | 174931 | 1006.44 | 692 | 674 | 173.1 |
| A | 12 | 194 | 159507 | 917.36 | 692 | 674 | 173.1 |
| B | 5 | 185 | 347298 | 2371.36 | 690 | 666 | 146.2 |
| B | 8 | 128 | 191293 | 1304.11 | 690 | 666 | 146.2 |
| B | 4 | 206 | 164375 | 1119.96 | 690 | 666 | 146.2 |
| C | 4 | 12 | 7718194 | 61119.02 | 453 | 450 | 126.3 |
| C | 15 | 205 | 1174325 | 9296.25 | 453 | 450 | 126.3 |
| C | 3 | 233 | 476558 | 3770.44 | 453 | 450 | 126.3 |
| D | 8 | 176 | 384891 | 2082.6 | 669 | 645 | 184.5 |
| D | 6 | 42 | 344451 | 1863.41 | 669 | 645 | 184.5 |
| D | 10 | 181 | 215285 | 1163.34 | 669 | 645 | 184.5 |
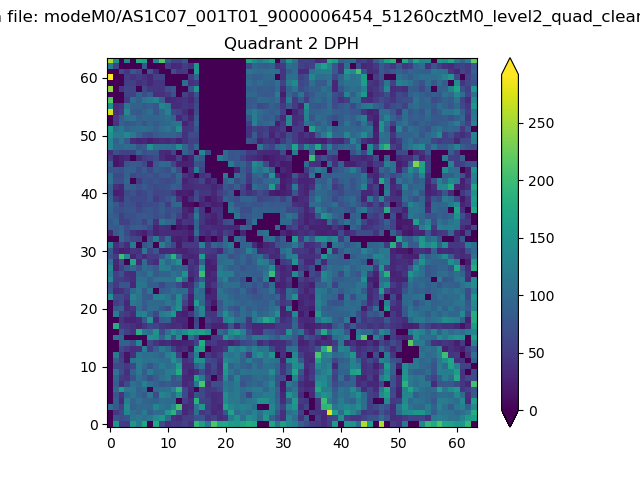
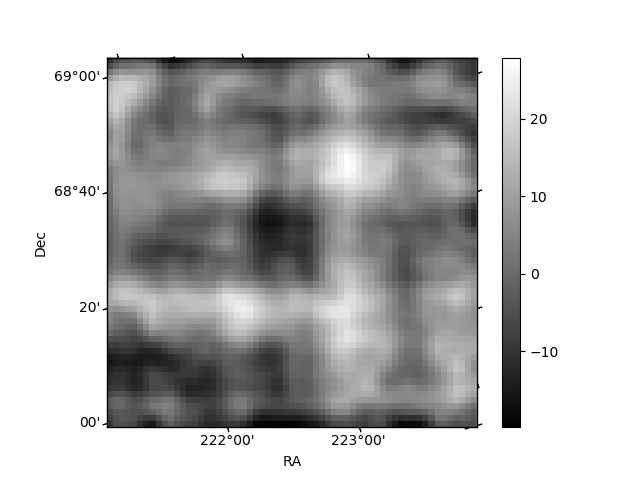
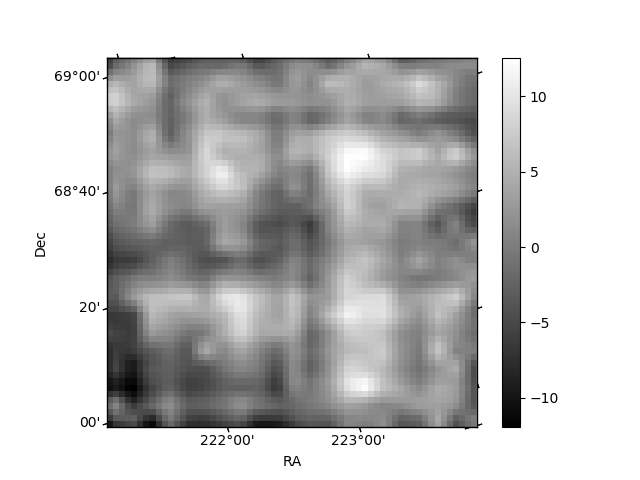
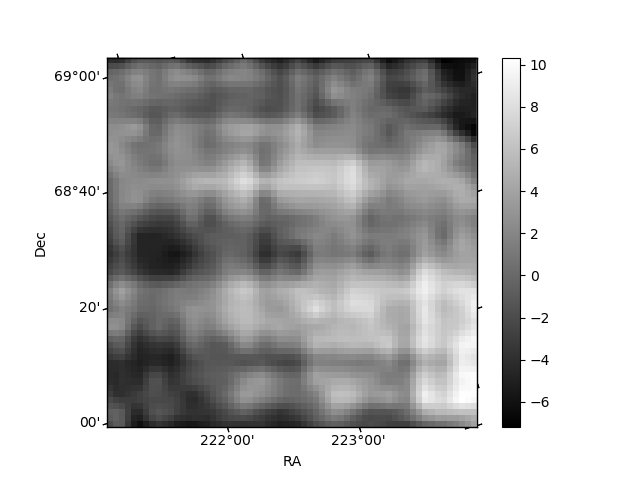
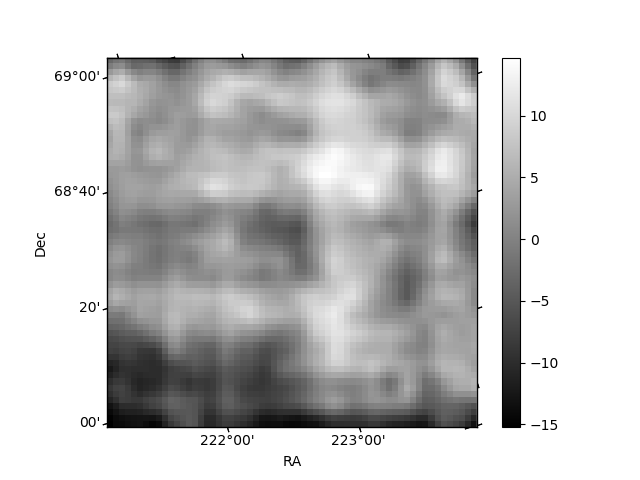
Histogram calculated using DETX and DETY for each event in the final _common_clean file
| Quadrant A | 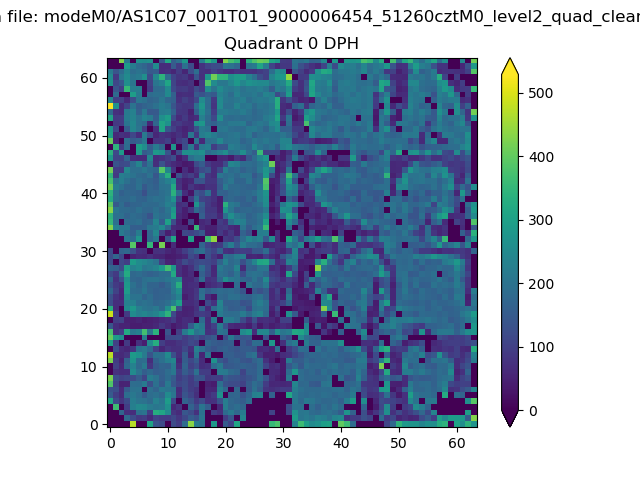 |
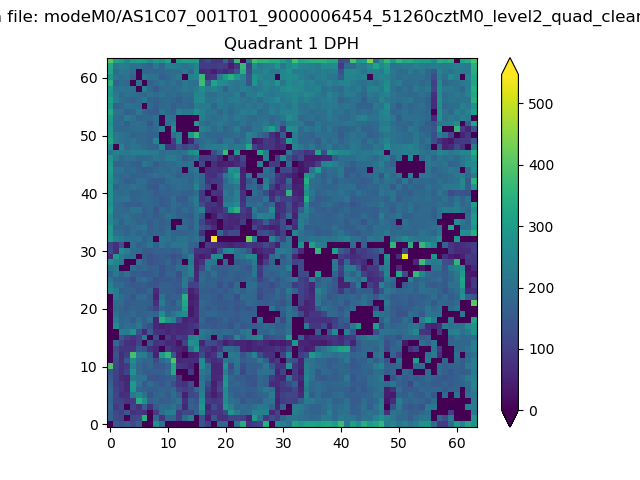 |
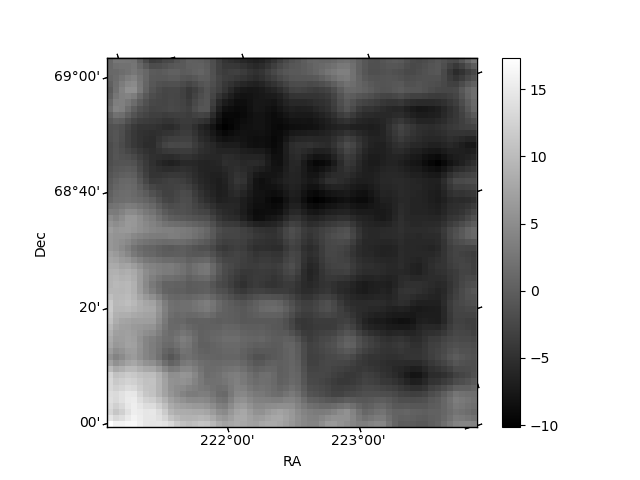
Quadrant B |
|---|---|---|---|
| Quadrant D | 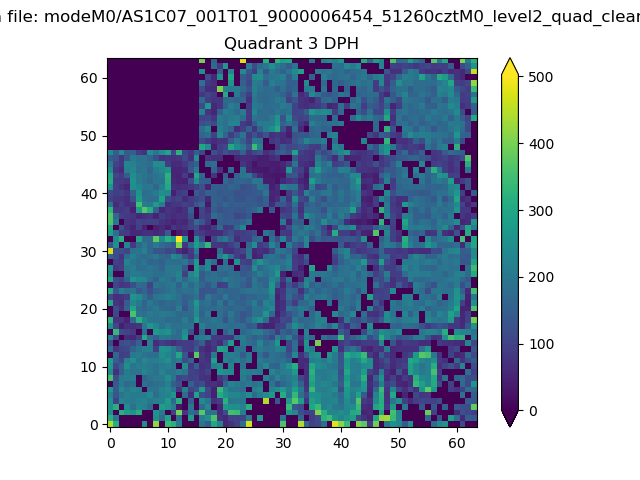 |
 |
Quadrant C |
| Plot type | Count rate plots | Images |
|---|---|---|
| Comparison with Poisson distribution Blue bars denote a histogram of data divided into 1 sec bins. Red curve is a Poisson curve with rate = median count rate of data. |
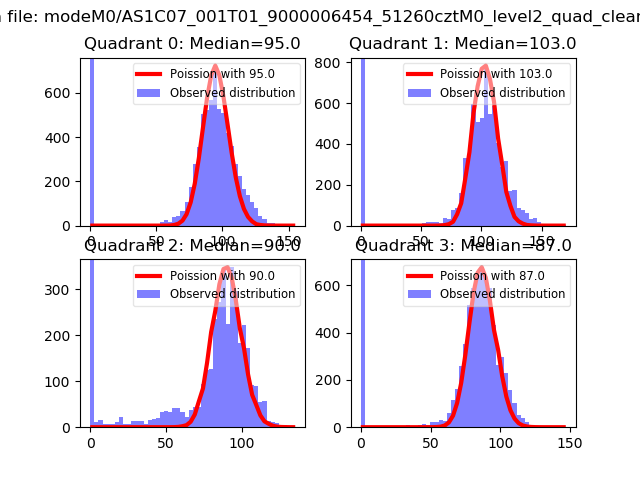 |
 |
| Quadrant-wise count rates Data is divided into 100 sec bins |
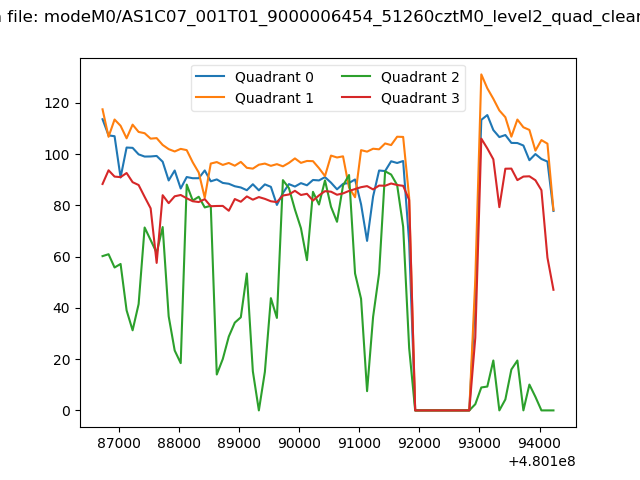 |
|
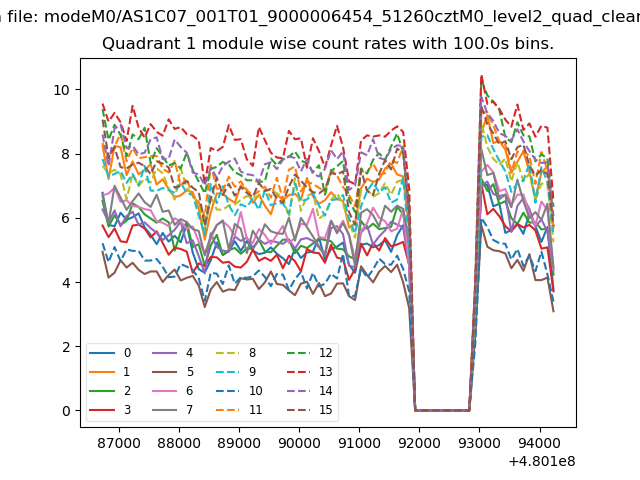
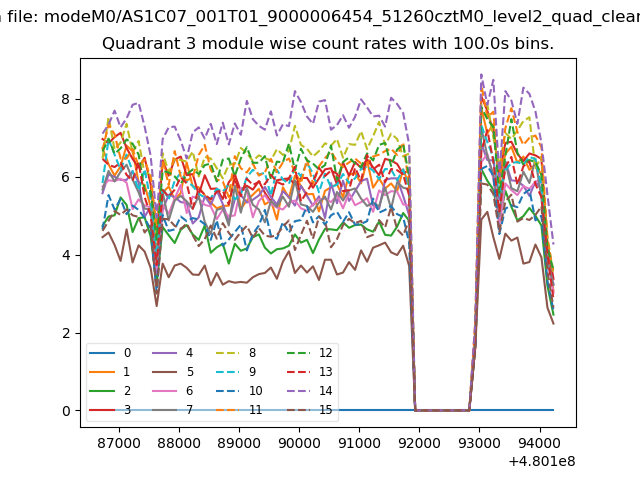
| Module-wise count rates for Quadrant A Data is divided into 100 sec bins |
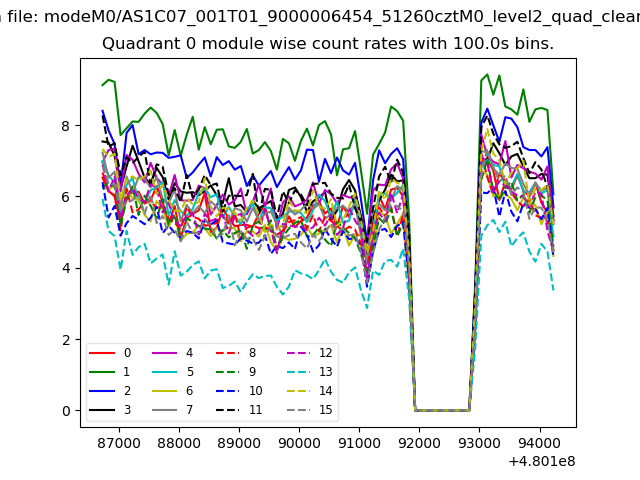 |
 |
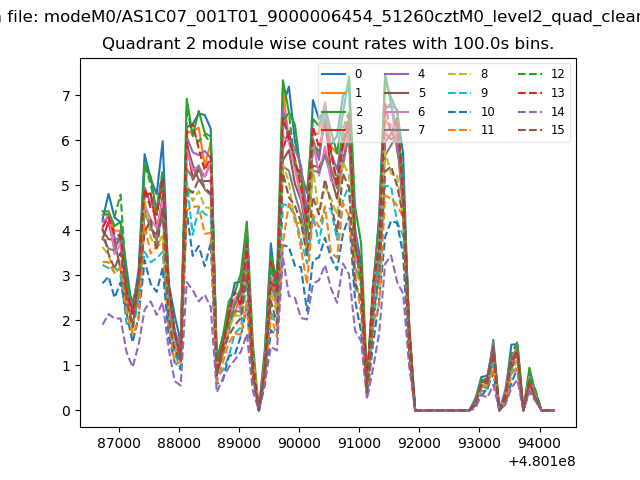
| Module-wise count rates for Quadrant B Data is divided into 100 sec bins |
 |
 |
| Module-wise count rates for Quadrant C Data is divided into 100 sec bins |
 |
 |
| Module-wise count rates for Quadrant D Data is divided into 100 sec bins |
 |
 |
| Parameter | Plot |
|---|---|
| CZT HV Monitor | 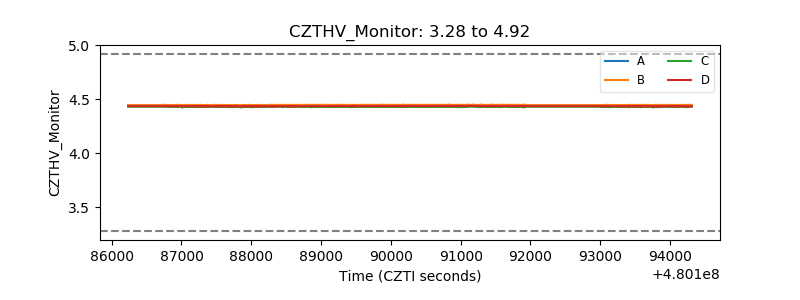 |
| D_VDD | 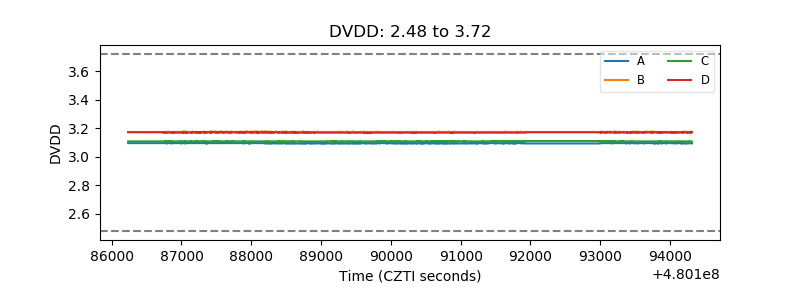 |
| Temperature 1 | 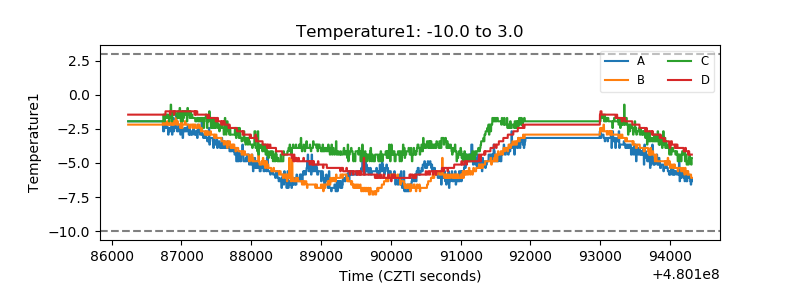 |
| Veto HV Monitor | 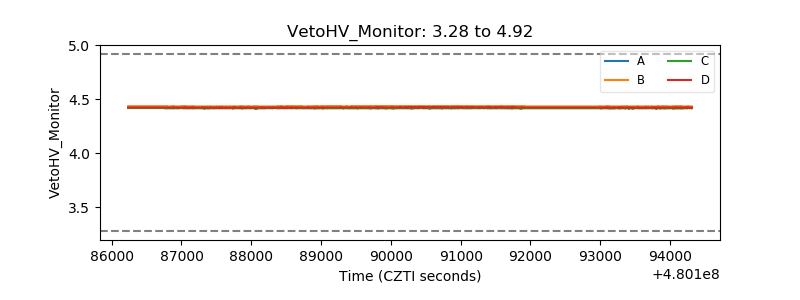 |
| Veto LLD | 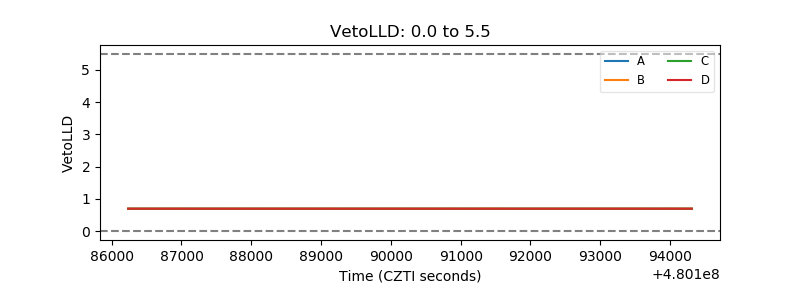 |
| Alpha Counter | 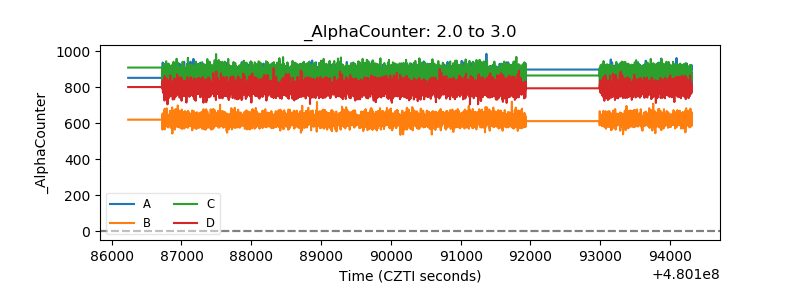 |
| _CPM_Rate | 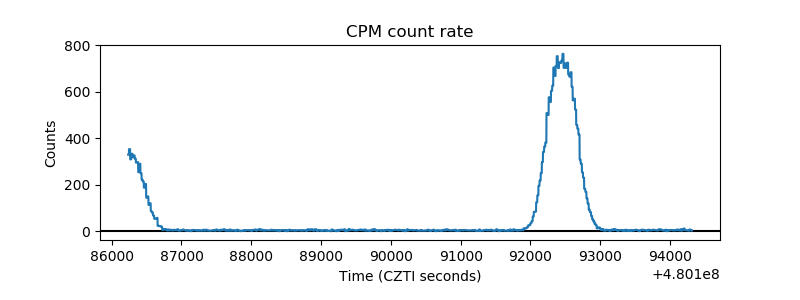 |
| CZT Counter | 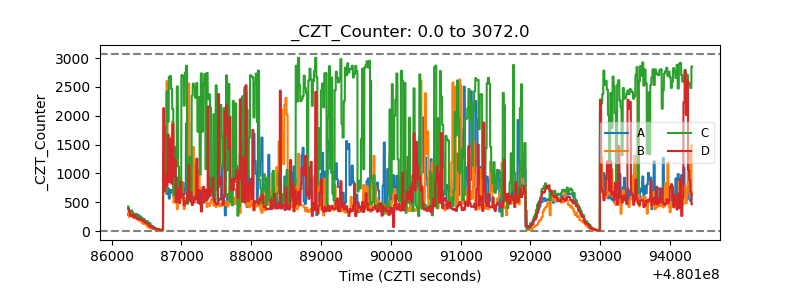 |
| +2.5 Volts monitor | 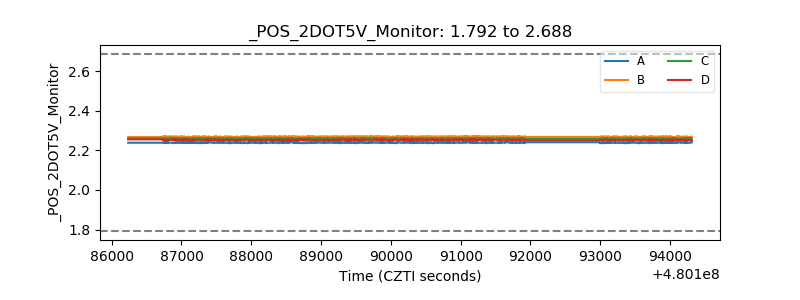 |
| +5 Volts monitor | 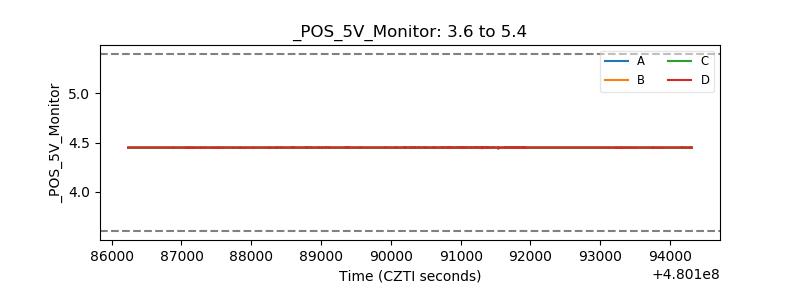 |
| _ROLL_ROT | 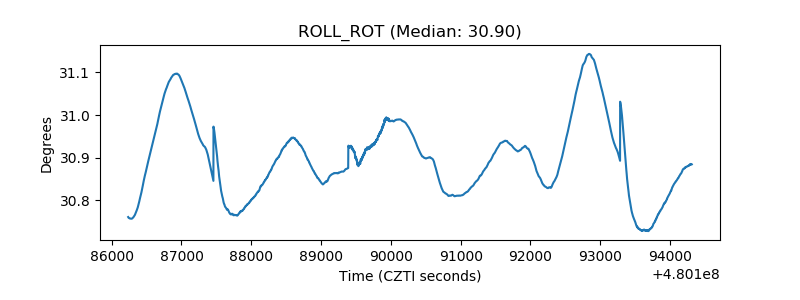 |
| _Roll_DEC | 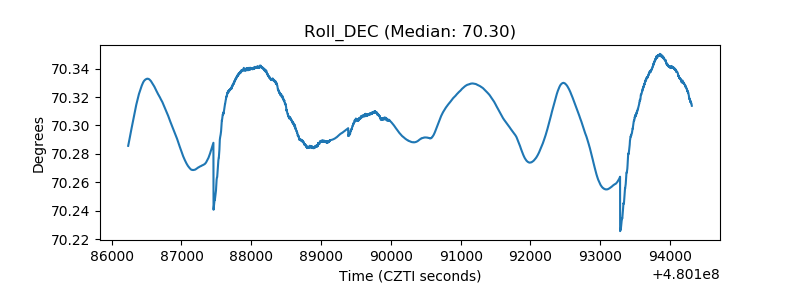 |
| _Roll_RA | 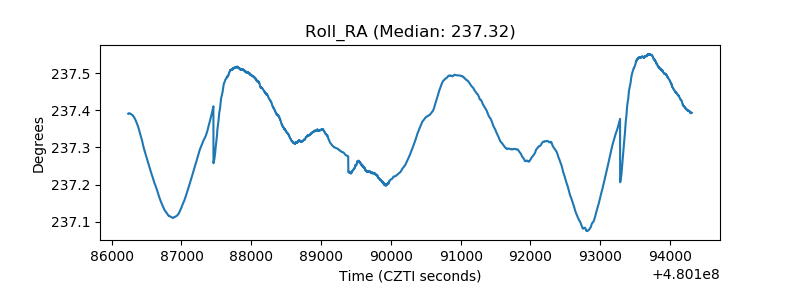 |
| Veto Counter | 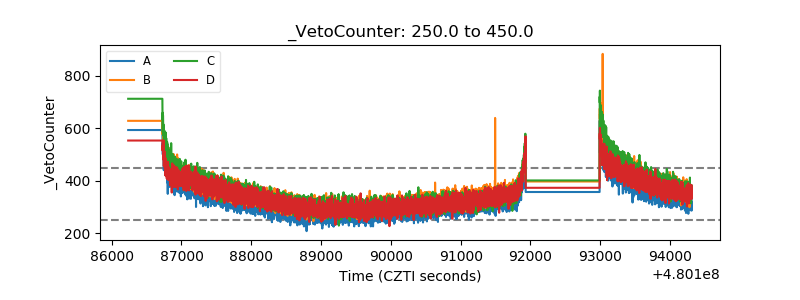 |