| Param | Original file | Final file |
|---|---|---|
| Filename | modeM0/AS1C07_001T01_9000006454_51261cztM0_level2.fits | modeM0/AS1C07_001T01_9000006454_51261cztM0_level2_quad_clean.evt |
| Size (bytes) | 812,661,120 | 79,715,520 |
| Size | 775.0 MB | 76.0 MB |
| Events in quadrant A | 5,294,902 | 625,155 |
| Events in quadrant B | 4,430,324 | 669,962 |
| Events in quadrant C | 15,280,562 | 101,311 |
| Events in quadrant D | 4,575,556 | 566,395 |
| Mode M0 | |||
|---|---|---|---|
| Quadrant | BADHDUFLAG | Total packets | Discarded packets |
| A | 0 | 20240 | 2 |
| B | 0 | 17621 | 2 |
| C | 0 | 49853 | 2 |
| D | 0 | 18171 | 2 |
| Mode SS | |||
|---|---|---|---|
| Quadrant | BADHDUFLAG | Total packets | Discarded packets |
| A | 0 | 132 | 0 |
| B | 0 | 132 | 0 |
| C | 0 | 132 | 0 |
| D | 0 | 132 | 0 |
| Mode M9 | |||
|---|---|---|---|
| Quadrant | BADHDUFLAG | Total packets | Discarded packets |
| A | 0 | 11 | 0 |
| B | 0 | 11 | 0 |
| C | 0 | 11 | 0 |
| D | 0 | 11 | 0 |
| Quadrant | Total seconds | Saturated seconds | Saturation percentage |
|---|---|---|---|
| A | 6459 | 156 | 2.415235% |
| B | 6460 | 317 | 4.907121% |
| C | 6460 | 5607 | 86.795666% |
| D | 6459 | 264 | 4.087320% |
Noise dominated data is calculated using 1-second bins in cleaned event files. If a bin has >2000 counts, and if more than 50% of those come from <1% of pixels, then it is considered to be noise-dominated and hence unusable.
| Quadrant | # 1 sec bins | Bins with >0 counts | Bins with >2000 counts | High rate bins dominated by noise | Noise dominated (total time) | Noise dominated (detector-on time) | Marked lightcurve |
|---|---|---|---|---|---|---|---|
| A | 7604 | 6460 | 84 | 84 | 1.10% | 1.30% | 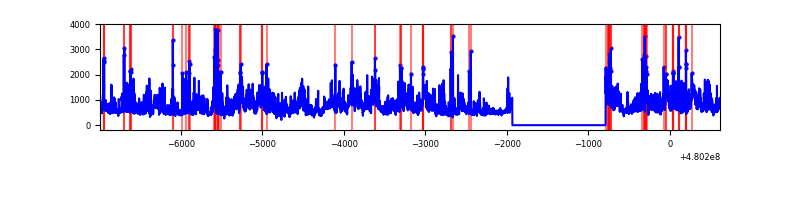 |
| B | 7605 | 6461 | 194 | 194 | 2.55% | 3.00% | 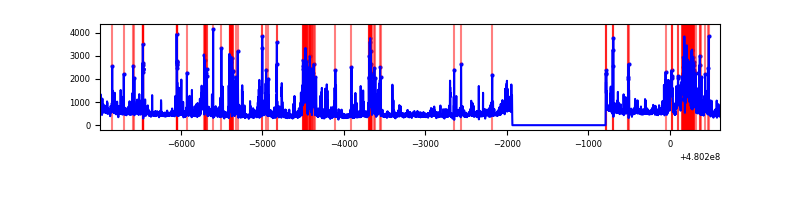 |
| C | 7604 | 6459 | 5144 | 5144 | 67.65% | 79.64% | 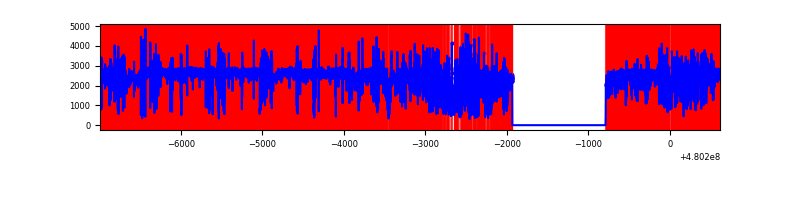 |
| D | 7604 | 6460 | 243 | 243 | 3.20% | 3.76% | 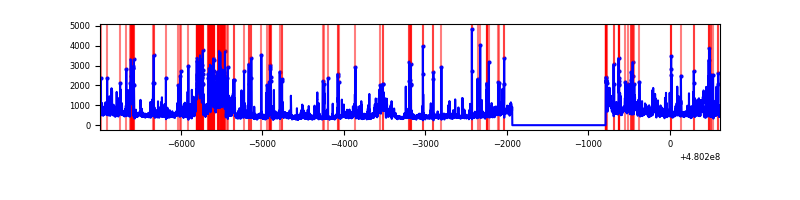 |
Top three noisy pixels from each quadrant. If the there are fewer than three noisy pixels in the level2.evt file, extra rows are filled as -1
| Pixel properties | Quadrant properties | ||||||
|---|---|---|---|---|---|---|---|
| Quadrant | DetID | PixID | Counts | Sigma | Mean | Median | Sigma |
| A | 12 | 3 | 1703651 | 10108.93 | 684 | 668 | 168.5 |
| A | 12 | 194 | 197165 | 1166.41 | 684 | 668 | 168.5 |
| A | 12 | 80 | 97578 | 575.26 | 684 | 668 | 168.5 |
| B | 5 | 185 | 652715 | 4505.64 | 683 | 659 | 144.7 |
| B | 8 | 128 | 260727 | 1797.04 | 683 | 659 | 144.7 |
| B | 10 | 254 | 231449 | 1594.73 | 683 | 659 | 144.7 |
| C | 4 | 12 | 10350113 | 148016.02 | 248 | 245 | 69.9 |
| C | 15 | 248 | 3106013 | 44416.36 | 248 | 245 | 69.9 |
| C | 1 | 60 | 559906 | 8003.85 | 248 | 245 | 69.9 |
| D | 6 | 42 | 570989 | 3065.5 | 667 | 644 | 186.1 |
| D | 2 | 216 | 219852 | 1178.2 | 667 | 644 | 186.1 |
| D | 8 | 176 | 183522 | 982.94 | 667 | 644 | 186.1 |
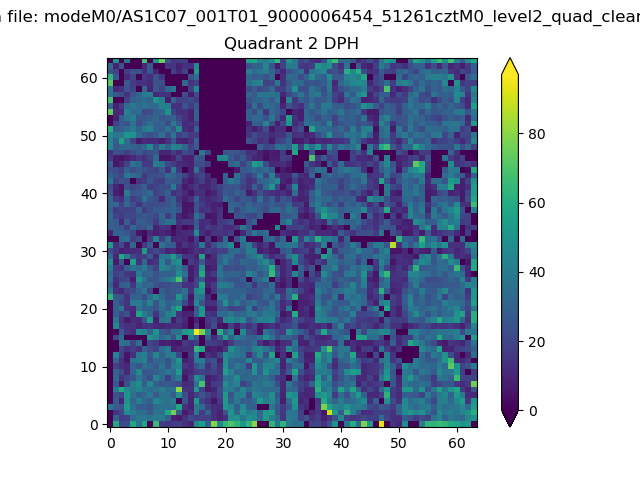
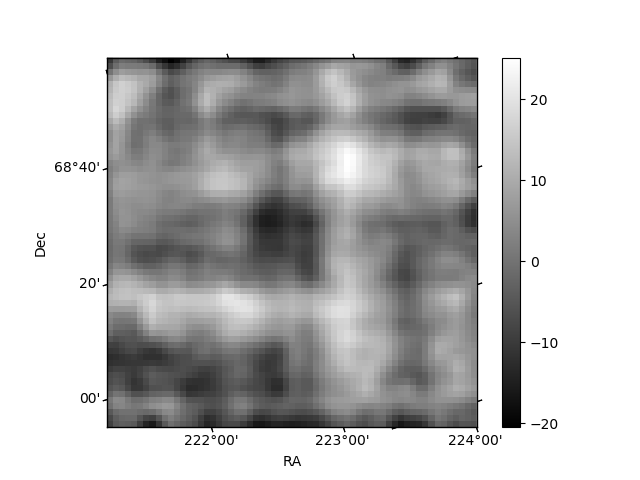
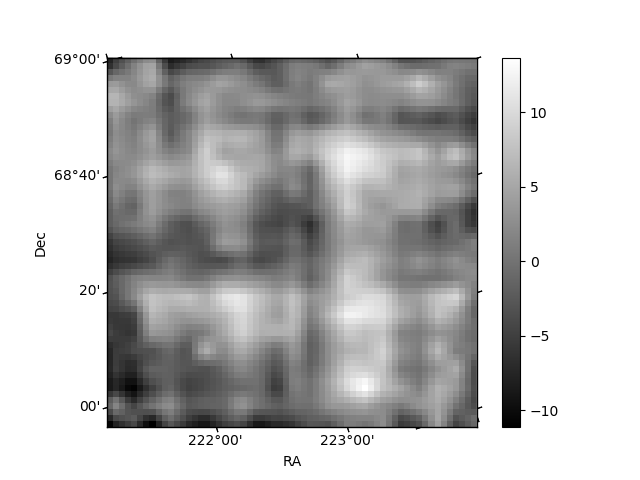
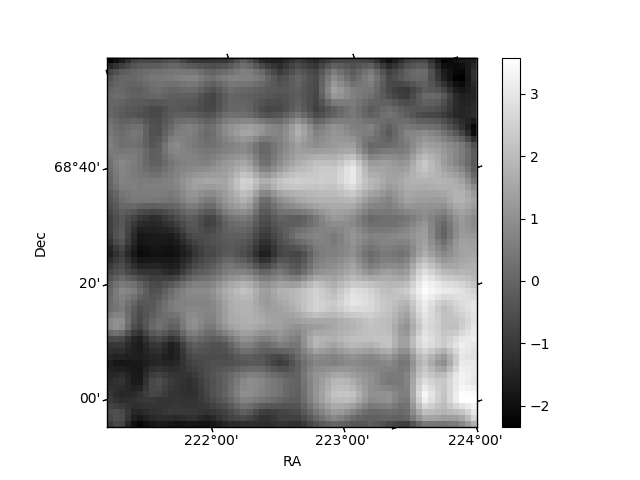
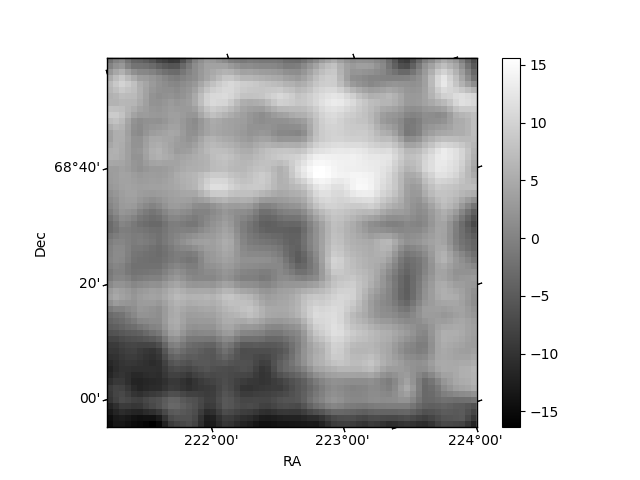
Histogram calculated using DETX and DETY for each event in the final _common_clean file
| Quadrant A | 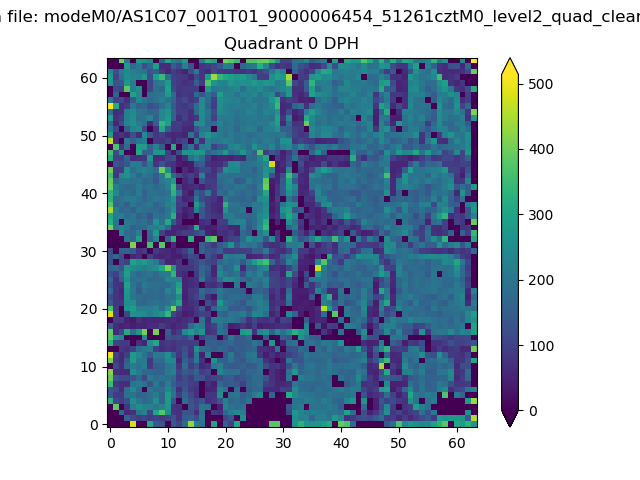 |
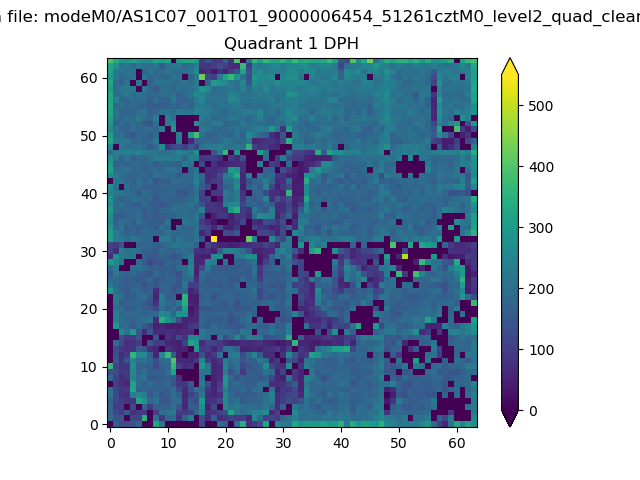 |
Quadrant B |
|---|---|---|---|
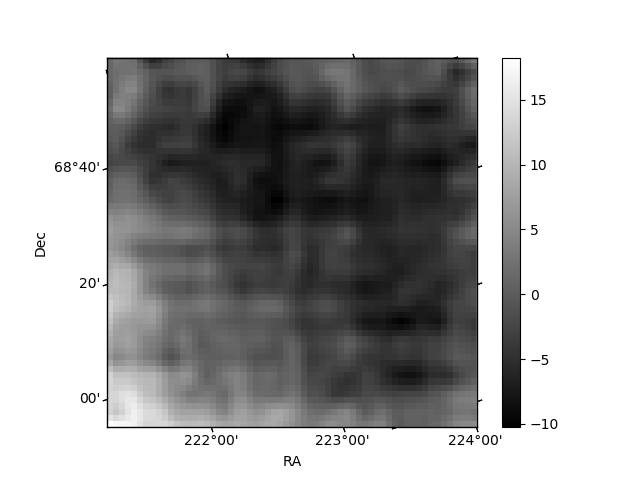
| Quadrant D | 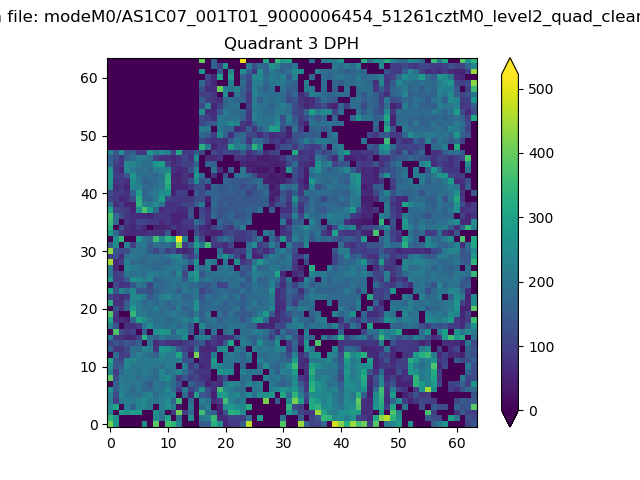 |
 |
Quadrant C |
| Plot type | Count rate plots | Images |
|---|---|---|
| Comparison with Poisson distribution Blue bars denote a histogram of data divided into 1 sec bins. Red curve is a Poisson curve with rate = median count rate of data. |
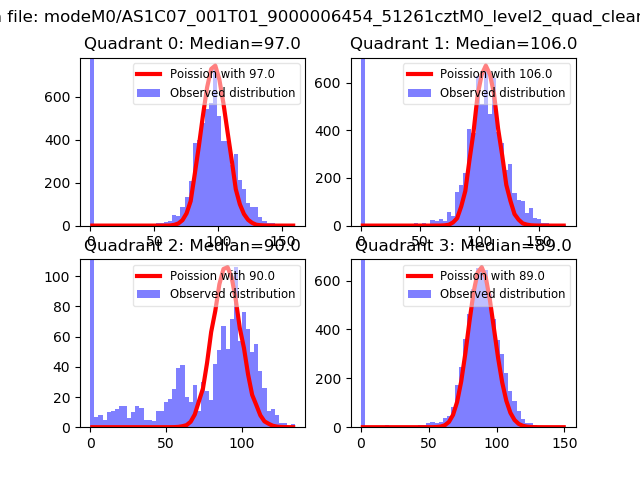 |
 |
| Quadrant-wise count rates Data is divided into 100 sec bins |
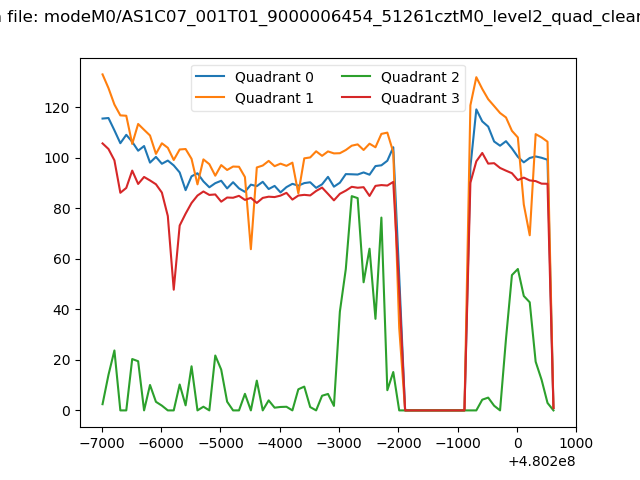 |
|
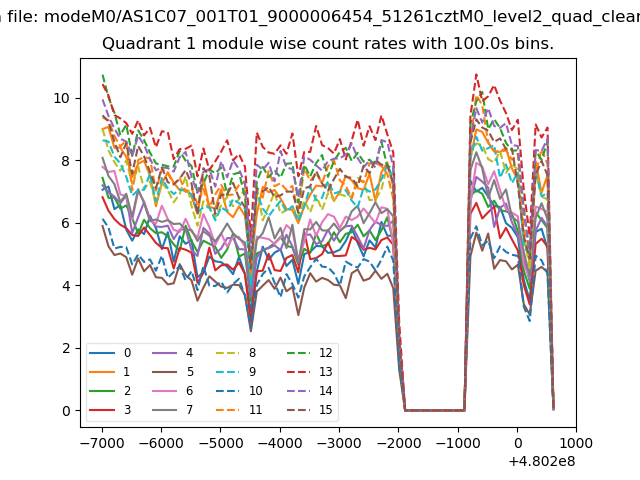
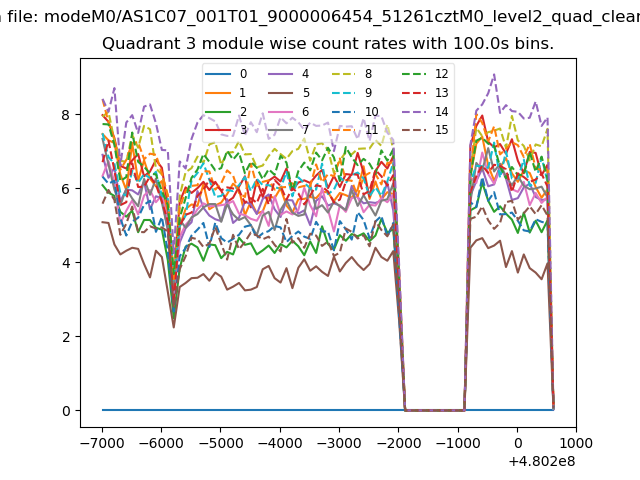
| Module-wise count rates for Quadrant A Data is divided into 100 sec bins |
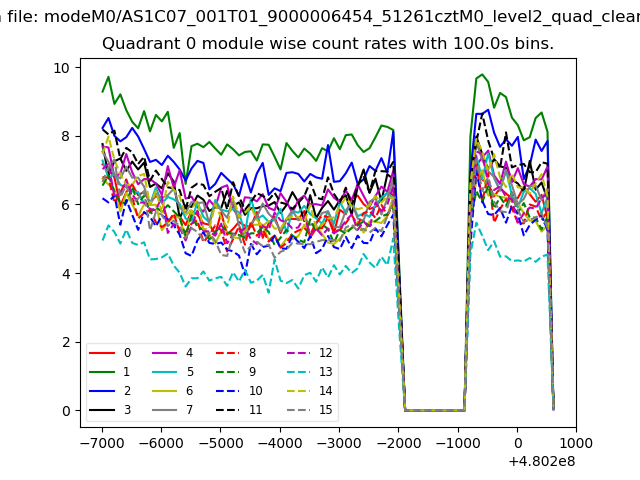 |
 |
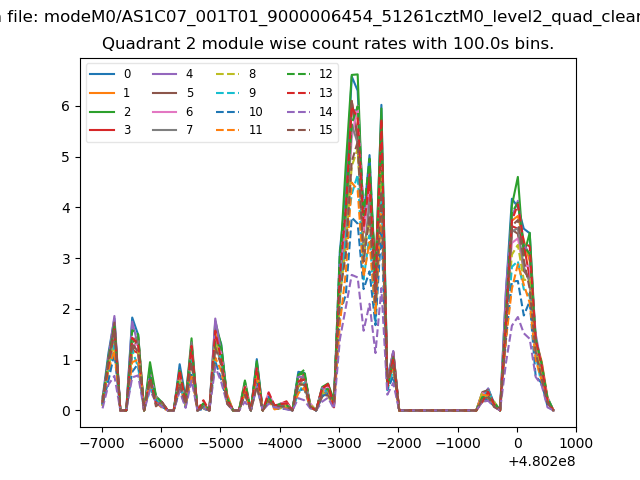
| Module-wise count rates for Quadrant B Data is divided into 100 sec bins |
 |
 |
| Module-wise count rates for Quadrant C Data is divided into 100 sec bins |
 |
 |
| Module-wise count rates for Quadrant D Data is divided into 100 sec bins |
 |
 |
| Parameter | Plot |
|---|---|
| CZT HV Monitor | 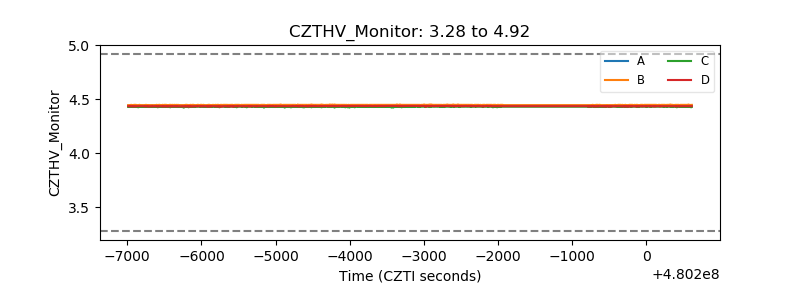 |
| D_VDD | 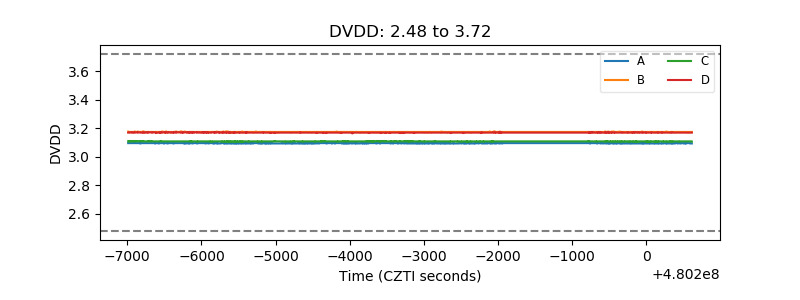 |
| Temperature 1 | 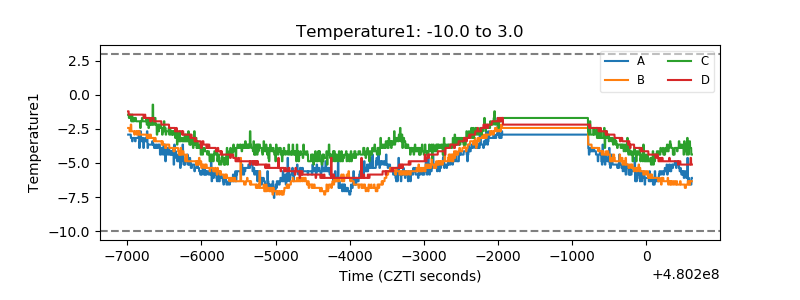 |
| Veto HV Monitor | 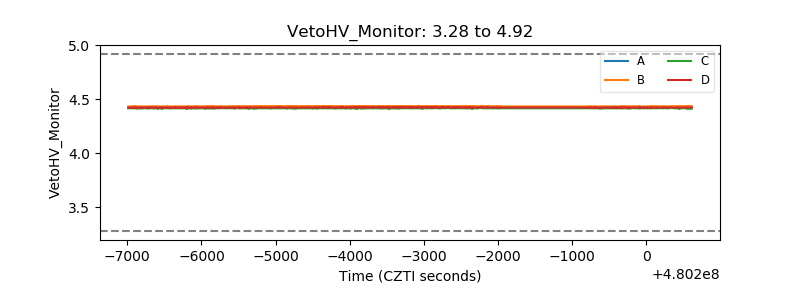 |
| Veto LLD | 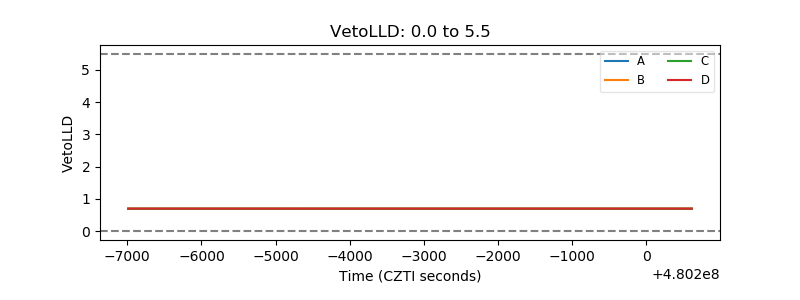 |
| Alpha Counter | 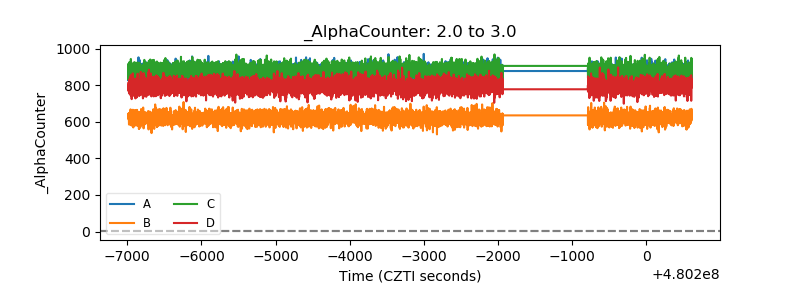 |
| _CPM_Rate | 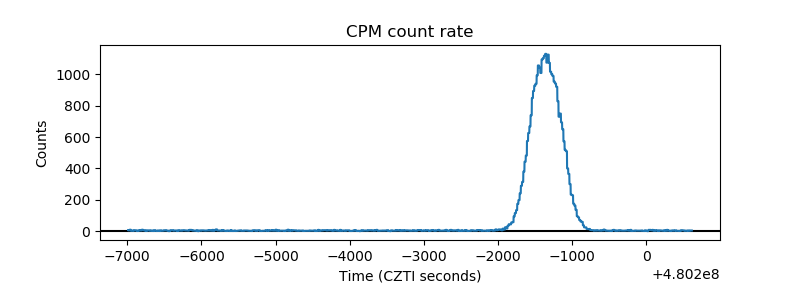 |
| CZT Counter | 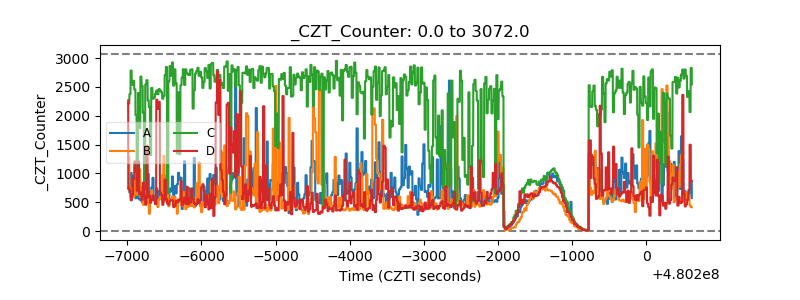 |
| +2.5 Volts monitor | 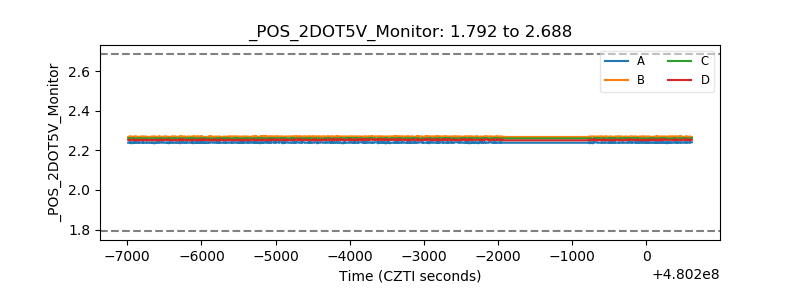 |
| +5 Volts monitor | 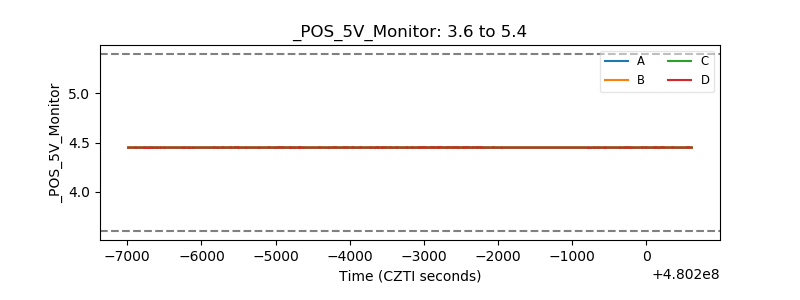 |
| _ROLL_ROT | 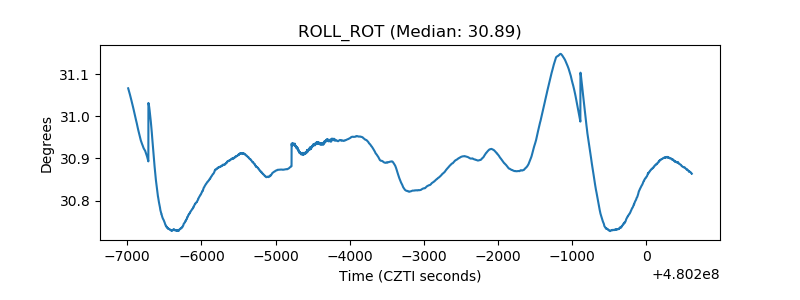 |
| _Roll_DEC | 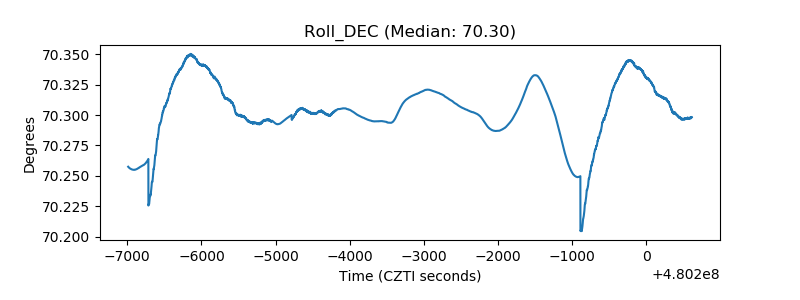 |
| _Roll_RA | 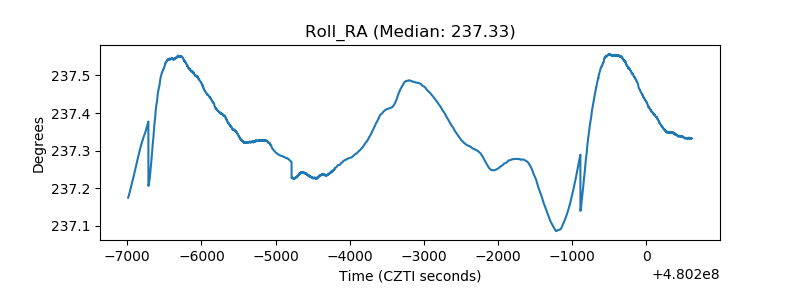 |
| Veto Counter | 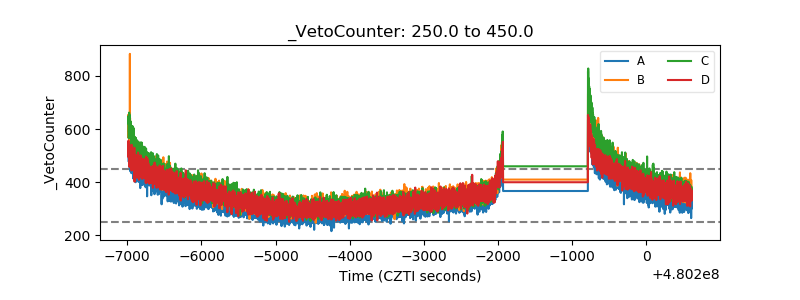 |