| Param | Original file | Final file |
|---|---|---|
| Filename | modeM0/AS1C07_001T01_9000006454_51263cztM0_level2.fits | modeM0/AS1C07_001T01_9000006454_51263cztM0_level2_quad_clean.evt |
| Size (bytes) | 673,358,400 | 90,843,840 |
| Size | 642.2 MB | 86.6 MB |
| Events in quadrant A | 6,436,694 | 613,140 |
| Events in quadrant B | 4,240,022 | 683,714 |
| Events in quadrant C | 9,823,604 | 432,314 |
| Events in quadrant D | 3,928,732 | 573,617 |
| Mode M0 | |||
|---|---|---|---|
| Quadrant | BADHDUFLAG | Total packets | Discarded packets |
| A | 0 | 23703 | 7 |
| B | 0 | 17144 | 2 |
| C | 0 | 33650 | 2 |
| D | 0 | 16350 | 2 |
| Mode SS | |||
|---|---|---|---|
| Quadrant | BADHDUFLAG | Total packets | Discarded packets |
| A | 0 | 132 | 0 |
| B | 0 | 132 | 0 |
| C | 0 | 132 | 0 |
| D | 0 | 132 | 0 |
| Mode M9 | |||
|---|---|---|---|
| Quadrant | BADHDUFLAG | Total packets | Discarded packets |
| A | 0 | 14 | 0 |
| B | 0 | 15 | 0 |
| C | 0 | 15 | 0 |
| D | 0 | 15 | 0 |
| Quadrant | Total seconds | Saturated seconds | Saturation percentage |
|---|---|---|---|
| A | 6414 | 297 | 4.630496% |
| B | 6414 | 254 | 3.960087% |
| C | 6414 | 2324 | 36.233240% |
| D | 6414 | 187 | 2.915497% |
Noise dominated data is calculated using 1-second bins in cleaned event files. If a bin has >2000 counts, and if more than 50% of those come from <1% of pixels, then it is considered to be noise-dominated and hence unusable.
| Quadrant | # 1 sec bins | Bins with >0 counts | Bins with >2000 counts | High rate bins dominated by noise | Noise dominated (total time) | Noise dominated (detector-on time) | Marked lightcurve |
|---|---|---|---|---|---|---|---|
| A | 7609 | 6415 | 276 | 276 | 3.63% | 4.30% | 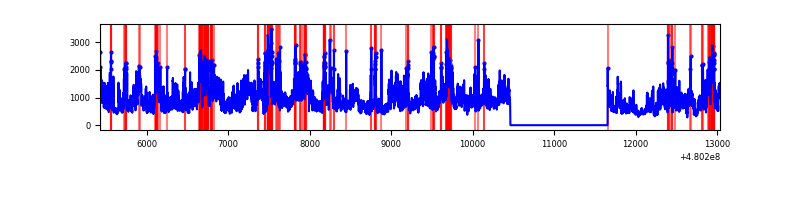 |
| B | 7609 | 6415 | 162 | 162 | 2.13% | 2.53% | 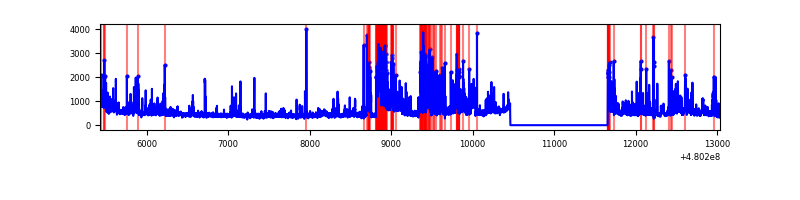 |
| C | 7609 | 6415 | 2240 | 2240 | 29.44% | 34.92% | 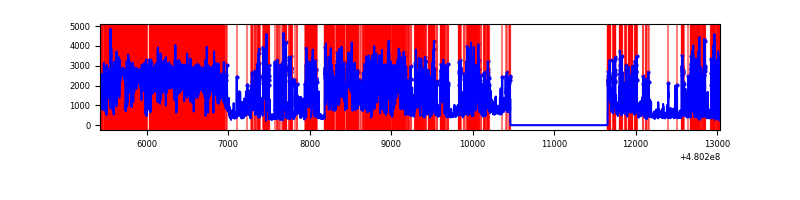 |
| D | 7609 | 6415 | 153 | 153 | 2.01% | 2.39% | 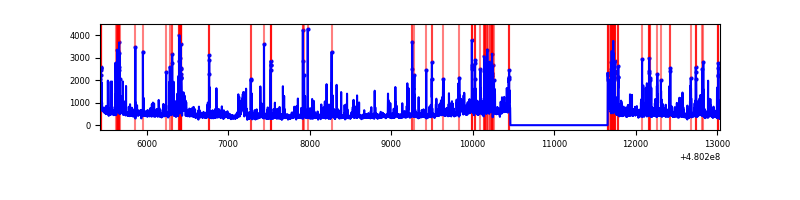 |
Top three noisy pixels from each quadrant. If the there are fewer than three noisy pixels in the level2.evt file, extra rows are filled as -1
| Pixel properties | Quadrant properties | ||||||
|---|---|---|---|---|---|---|---|
| Quadrant | DetID | PixID | Counts | Sigma | Mean | Median | Sigma |
| A | 12 | 3 | 2367814 | 14156.76 | 672 | 656 | 167.2 |
| A | 12 | 80 | 570011 | 3405.02 | 672 | 656 | 167.2 |
| A | 12 | 194 | 268087 | 1599.37 | 672 | 656 | 167.2 |
| B | 5 | 185 | 715463 | 5000.22 | 677 | 654 | 143.0 |
| B | 8 | 128 | 177468 | 1236.85 | 677 | 654 | 143.0 |
| B | 1 | 255 | 98011 | 681.03 | 677 | 654 | 143.0 |
| C | 4 | 12 | 6434191 | 39967.8 | 579 | 574 | 161.0 |
| C | 15 | 248 | 514249 | 3191.12 | 579 | 574 | 161.0 |
| C | 13 | 3 | 140868 | 871.55 | 579 | 574 | 161.0 |
| D | 3 | 12 | 284622 | 1553.85 | 650 | 628 | 182.8 |
| D | 2 | 216 | 259605 | 1416.97 | 650 | 628 | 182.8 |
| D | 8 | 176 | 157731 | 859.57 | 650 | 628 | 182.8 |
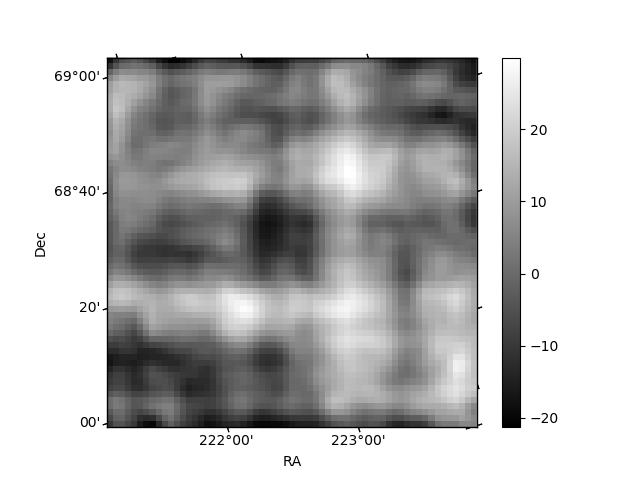
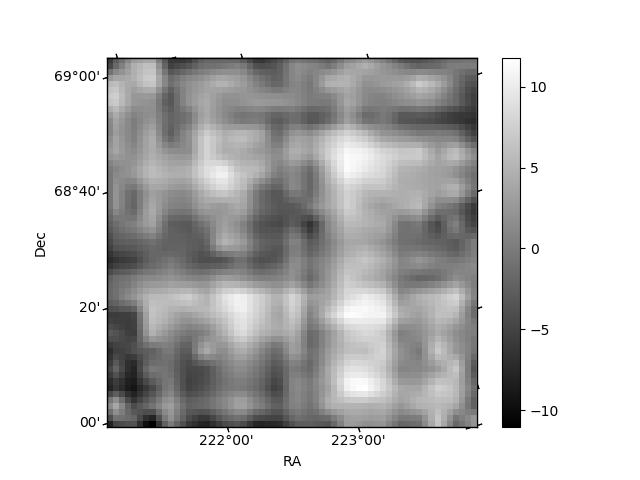
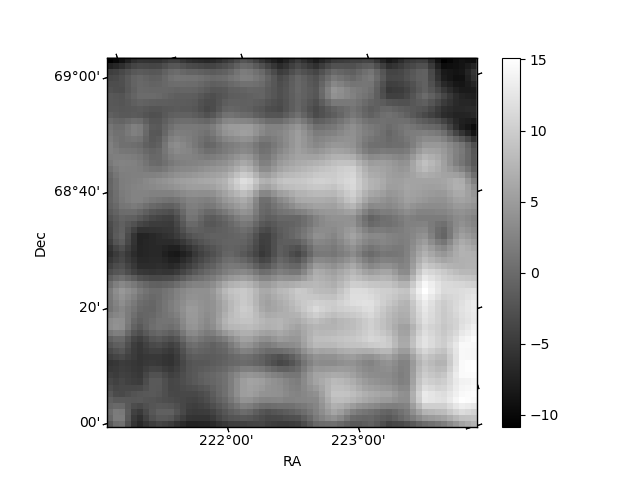
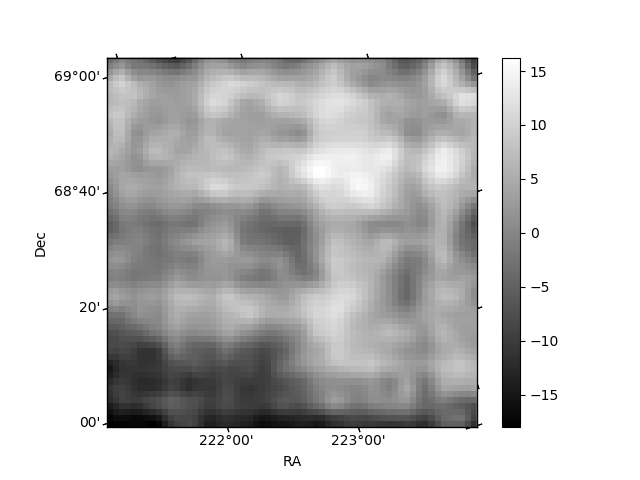
Histogram calculated using DETX and DETY for each event in the final _common_clean file
| Quadrant A | 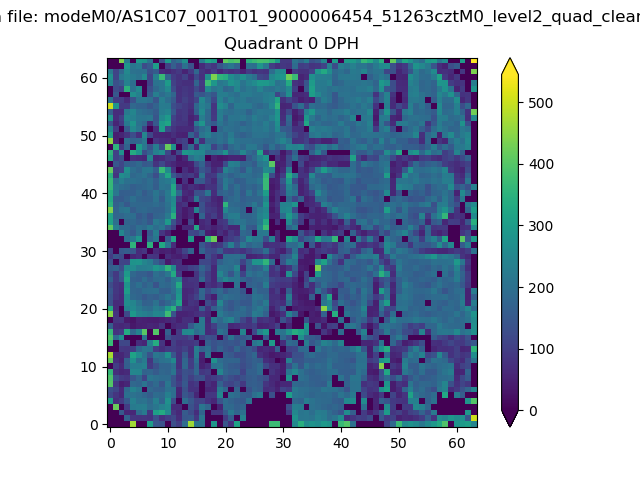 |
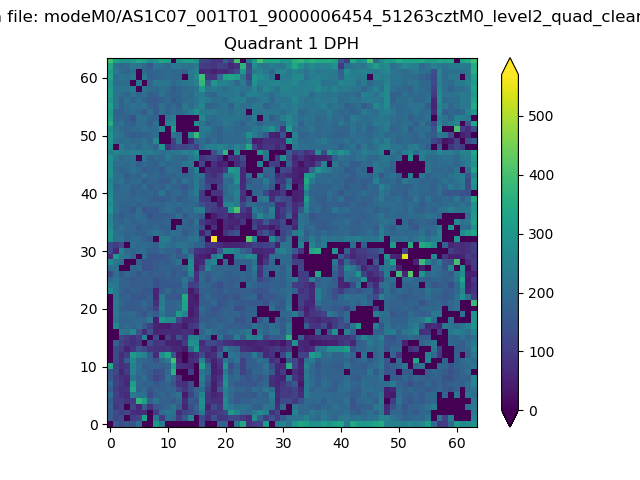 |
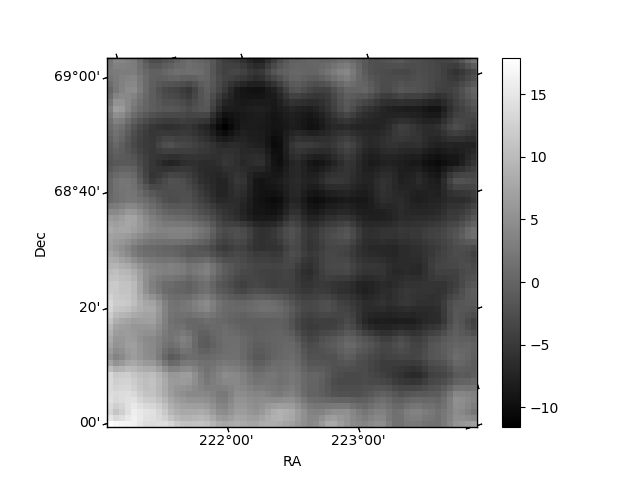
Quadrant B |
|---|---|---|---|
| Quadrant D | 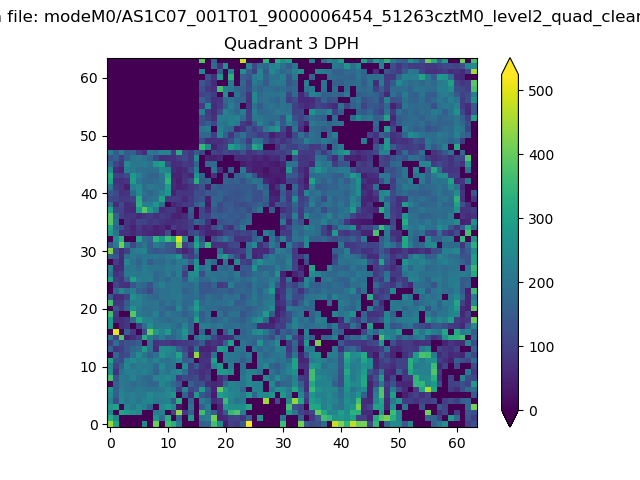 |
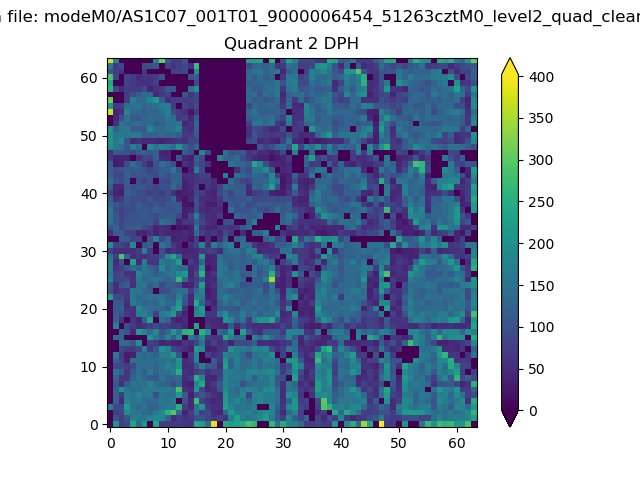 |
Quadrant C |
| Plot type | Count rate plots | Images |
|---|---|---|
| Comparison with Poisson distribution Blue bars denote a histogram of data divided into 1 sec bins. Red curve is a Poisson curve with rate = median count rate of data. |
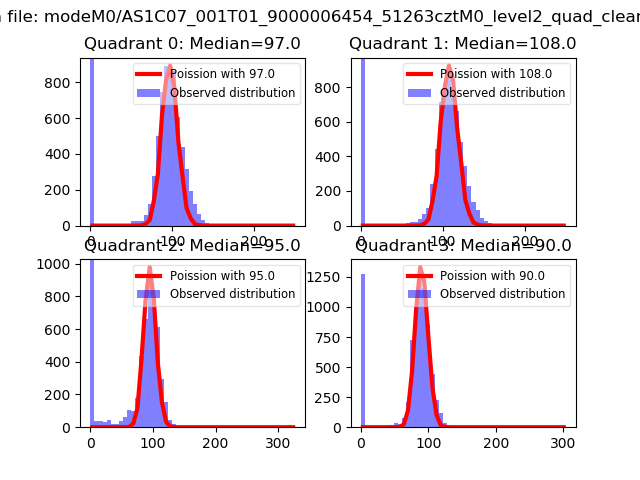 |
 |
| Quadrant-wise count rates Data is divided into 100 sec bins |
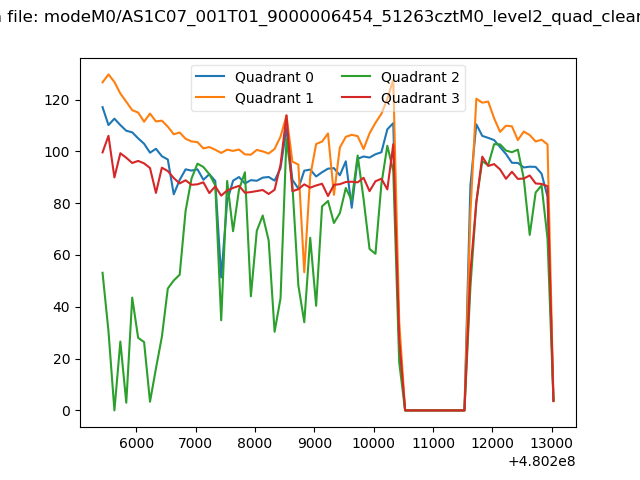 |
|
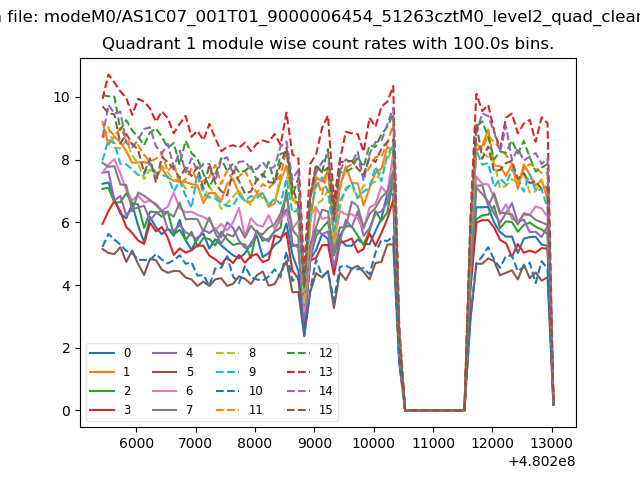
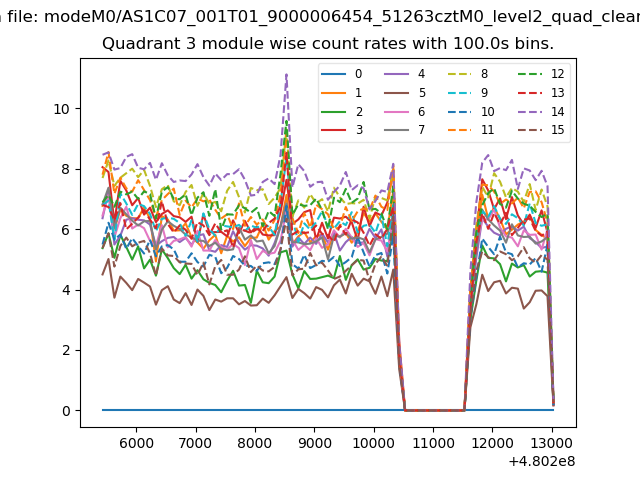
| Module-wise count rates for Quadrant A Data is divided into 100 sec bins |
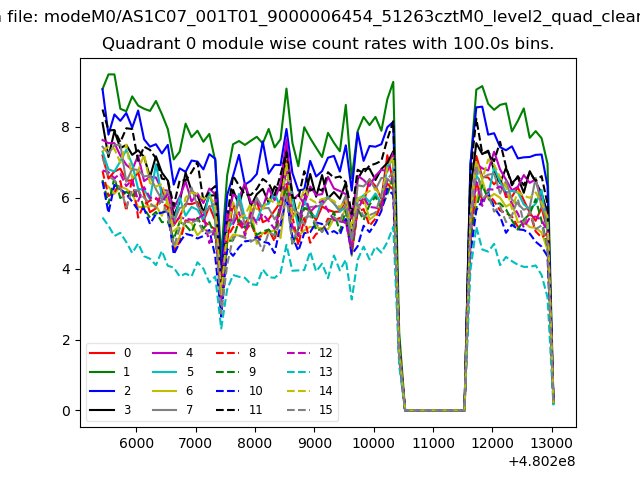 |
 |
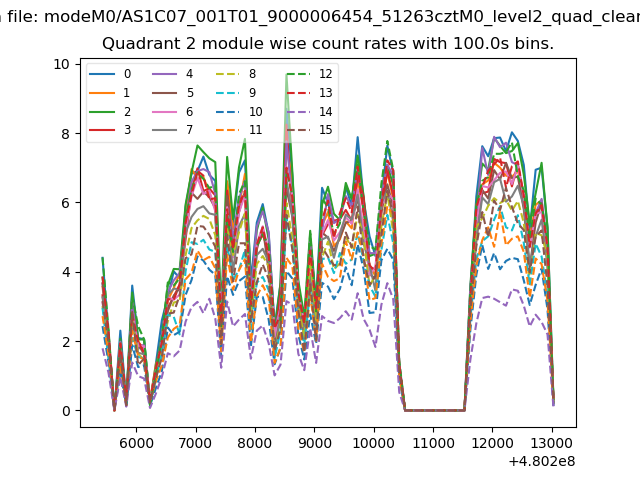
| Module-wise count rates for Quadrant B Data is divided into 100 sec bins |
 |
 |
| Module-wise count rates for Quadrant C Data is divided into 100 sec bins |
 |
 |
| Module-wise count rates for Quadrant D Data is divided into 100 sec bins |
 |
 |
| Parameter | Plot |
|---|---|
| CZT HV Monitor | 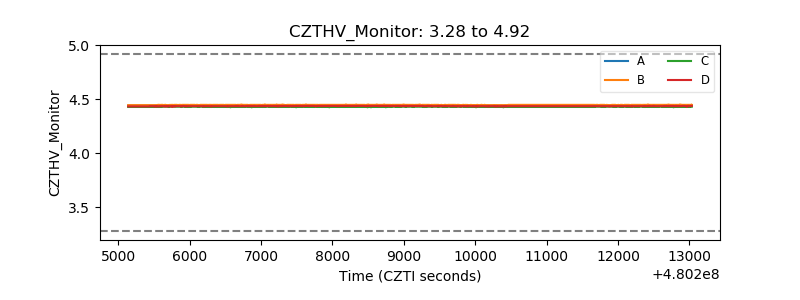 |
| D_VDD | 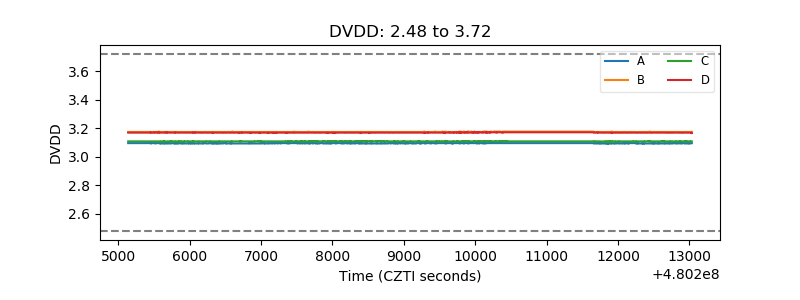 |
| Temperature 1 | 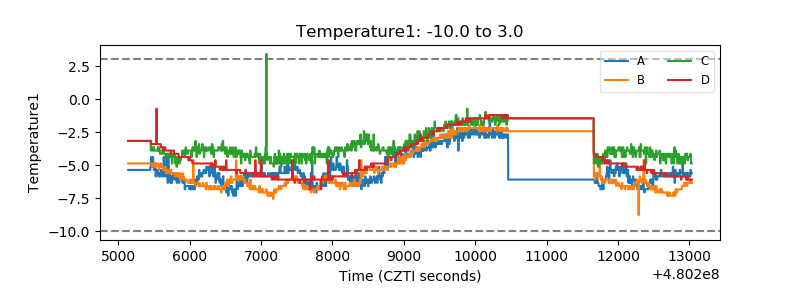 |
| Veto HV Monitor | 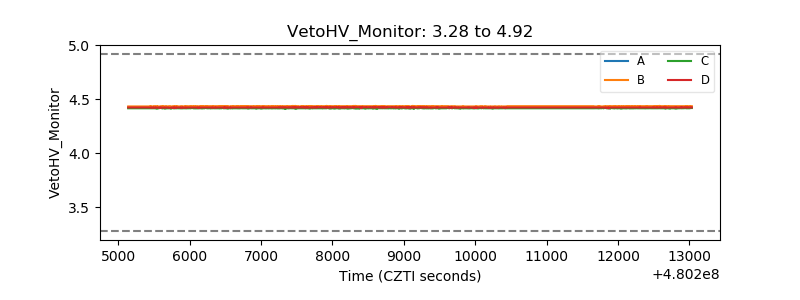 |
| Veto LLD | 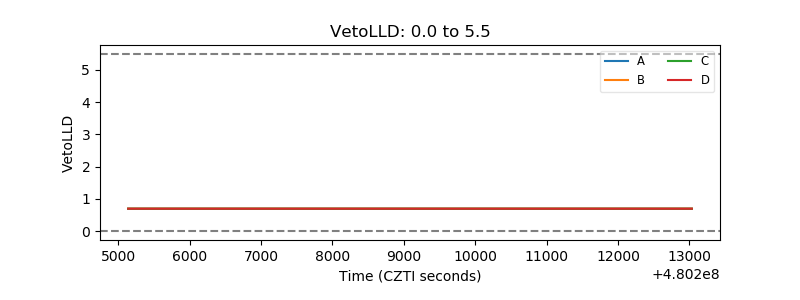 |
| Alpha Counter | 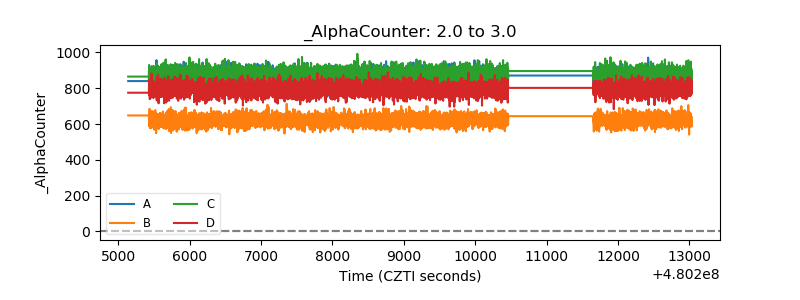 |
| _CPM_Rate | 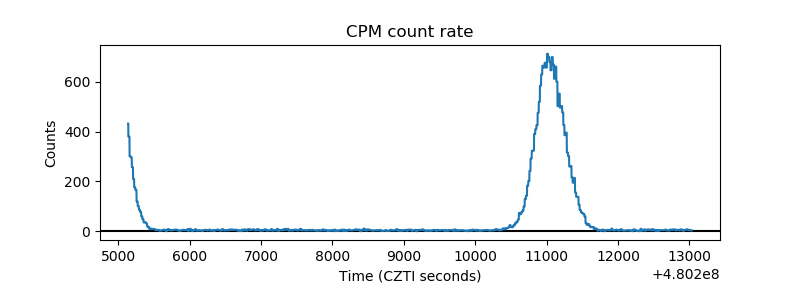 |
| CZT Counter | 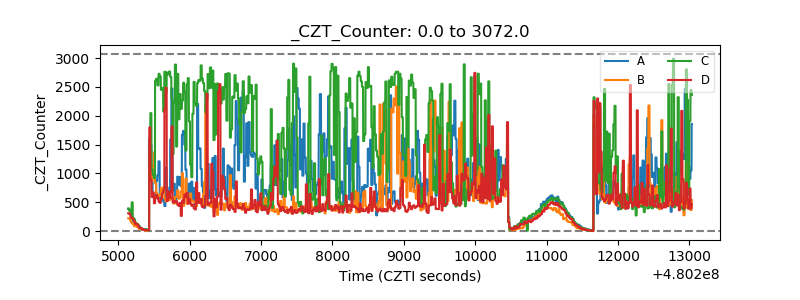 |
| +2.5 Volts monitor | 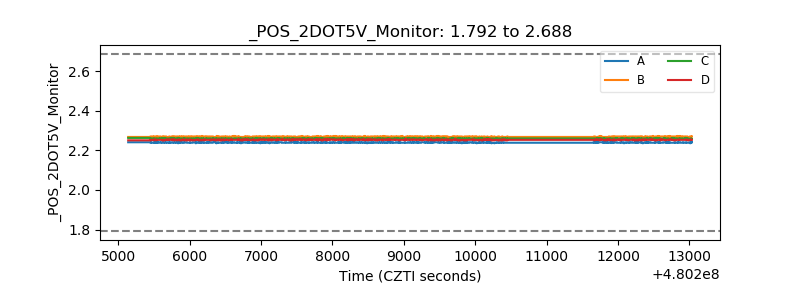 |
| +5 Volts monitor | 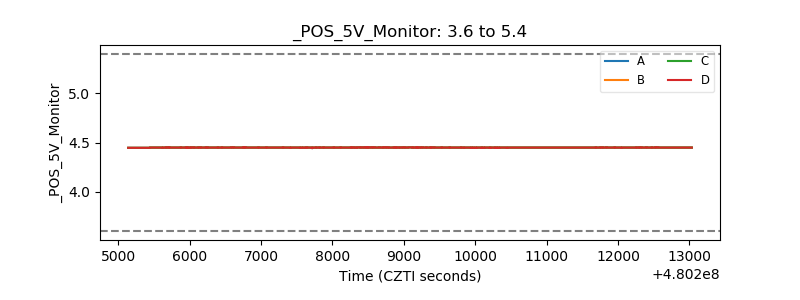 |
| _ROLL_ROT | 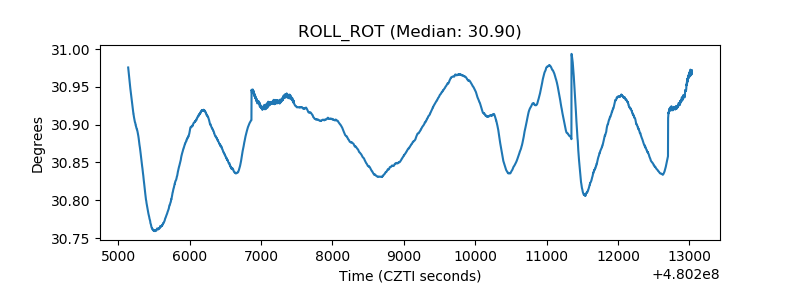 |
| _Roll_DEC | 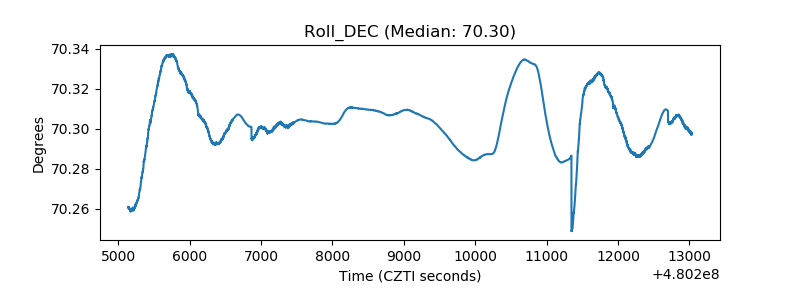 |
| _Roll_RA | 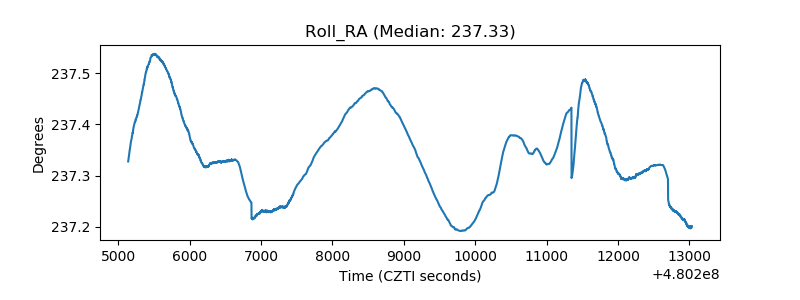 |
| Veto Counter | 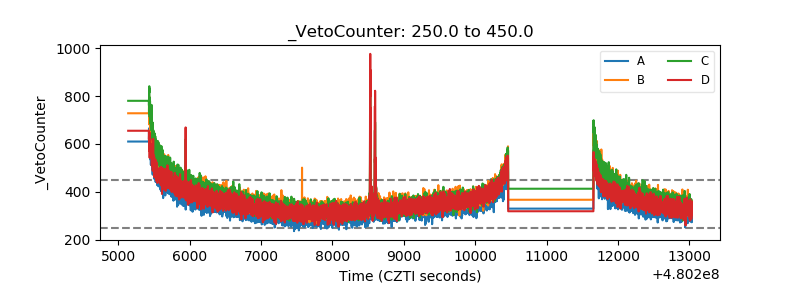 |