| Param | Original file | Final file |
|---|---|---|
| Filename | modeM0/AS1C07_001T01_9000006454_51264cztM0_level2.fits | modeM0/AS1C07_001T01_9000006454_51264cztM0_level2_quad_clean.evt |
| Size (bytes) | 756,996,480 | 91,416,960 |
| Size | 721.9 MB | 87.2 MB |
| Events in quadrant A | 6,899,777 | 630,748 |
| Events in quadrant B | 4,360,473 | 701,213 |
| Events in quadrant C | 11,596,109 | 382,325 |
| Events in quadrant D | 4,639,341 | 579,787 |
| Mode M0 | |||
|---|---|---|---|
| Quadrant | BADHDUFLAG | Total packets | Discarded packets |
| A | 0 | 25346 | 5 |
| B | 0 | 17768 | 2 |
| C | 0 | 39165 | 2 |
| D | 0 | 18846 | 2 |
| Mode SS | |||
|---|---|---|---|
| Quadrant | BADHDUFLAG | Total packets | Discarded packets |
| A | 0 | 138 | 0 |
| B | 0 | 138 | 0 |
| C | 0 | 138 | 0 |
| D | 0 | 138 | 0 |
| Mode M9 | |||
|---|---|---|---|
| Quadrant | BADHDUFLAG | Total packets | Discarded packets |
| A | 0 | 13 | 0 |
| B | 0 | 14 | 0 |
| C | 0 | 14 | 0 |
| D | 0 | 14 | 0 |
| Quadrant | Total seconds | Saturated seconds | Saturation percentage |
|---|---|---|---|
| A | 6799 | 295 | 4.338873% |
| B | 6799 | 231 | 3.397558% |
| C | 6799 | 3109 | 45.727313% |
| D | 6799 | 318 | 4.677158% |
Noise dominated data is calculated using 1-second bins in cleaned event files. If a bin has >2000 counts, and if more than 50% of those come from <1% of pixels, then it is considered to be noise-dominated and hence unusable.
| Quadrant | # 1 sec bins | Bins with >0 counts | Bins with >2000 counts | High rate bins dominated by noise | Noise dominated (total time) | Noise dominated (detector-on time) | Marked lightcurve |
|---|---|---|---|---|---|---|---|
| A | 7889 | 6801 | 304 | 304 | 3.85% | 4.47% | 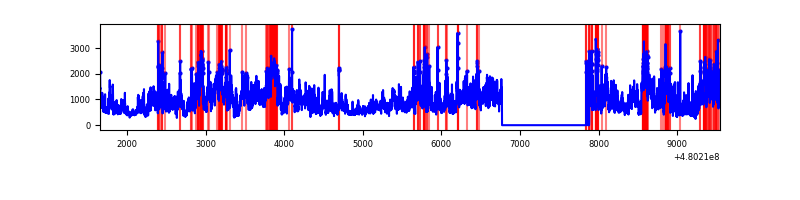 |
| B | 7889 | 6801 | 135 | 135 | 1.71% | 1.99% | 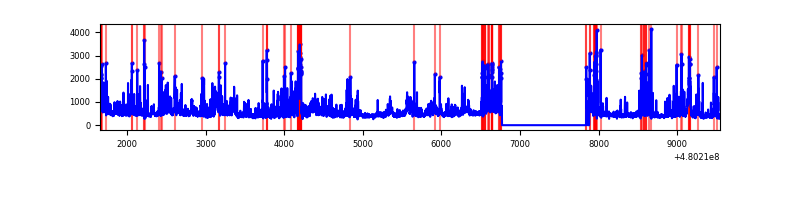 |
| C | 7889 | 6799 | 2987 | 2987 | 37.86% | 43.93% | 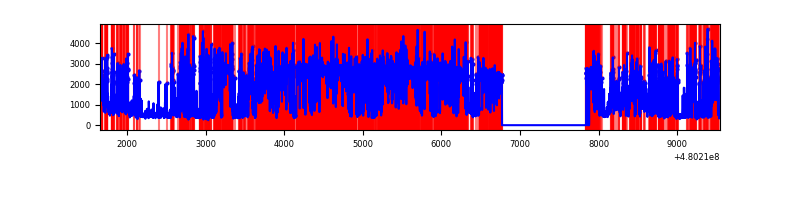 |
| D | 7889 | 6801 | 284 | 284 | 3.60% | 4.18% | 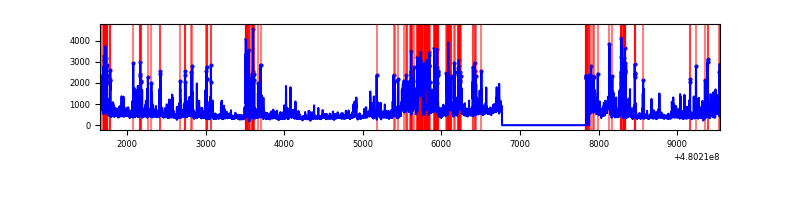 |
Top three noisy pixels from each quadrant. If the there are fewer than three noisy pixels in the level2.evt file, extra rows are filled as -1
| Pixel properties | Quadrant properties | ||||||
|---|---|---|---|---|---|---|---|
| Quadrant | DetID | PixID | Counts | Sigma | Mean | Median | Sigma |
| A | 12 | 3 | 2537984 | 14596.82 | 694 | 678 | 173.8 |
| A | 12 | 80 | 917543 | 5274.62 | 694 | 678 | 173.8 |
| A | 12 | 194 | 291336 | 1672.12 | 694 | 678 | 173.8 |
| B | 8 | 128 | 373064 | 2529.85 | 698 | 674 | 147.2 |
| B | 10 | 254 | 368999 | 2502.23 | 698 | 674 | 147.2 |
| B | 5 | 185 | 344853 | 2338.2 | 698 | 674 | 147.2 |
| C | 4 | 12 | 8173080 | 54148.02 | 543 | 539 | 150.9 |
| C | 15 | 158 | 827136 | 5476.7 | 543 | 539 | 150.9 |
| C | 13 | 3 | 79932 | 526.03 | 543 | 539 | 150.9 |
| D | 3 | 12 | 805675 | 4243.12 | 666 | 639 | 189.7 |
| D | 2 | 216 | 479990 | 2526.52 | 666 | 639 | 189.7 |
| D | 8 | 176 | 228479 | 1200.88 | 666 | 639 | 189.7 |
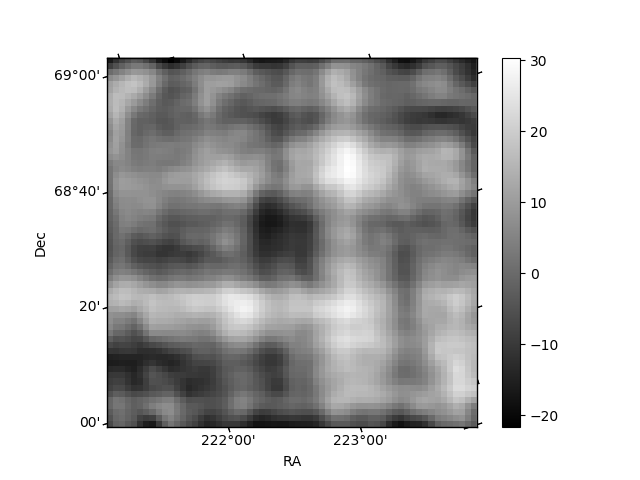
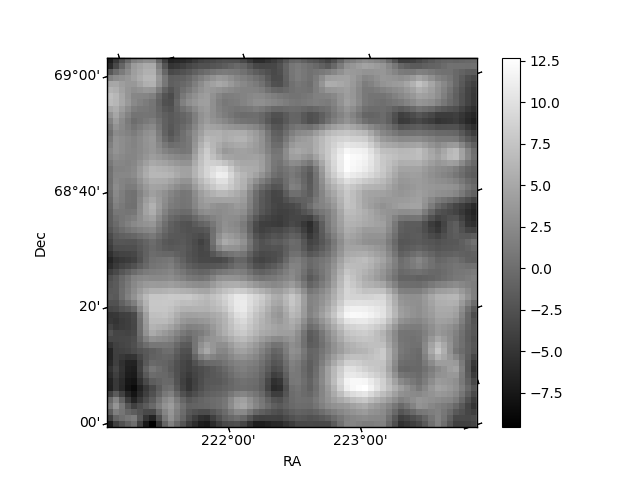
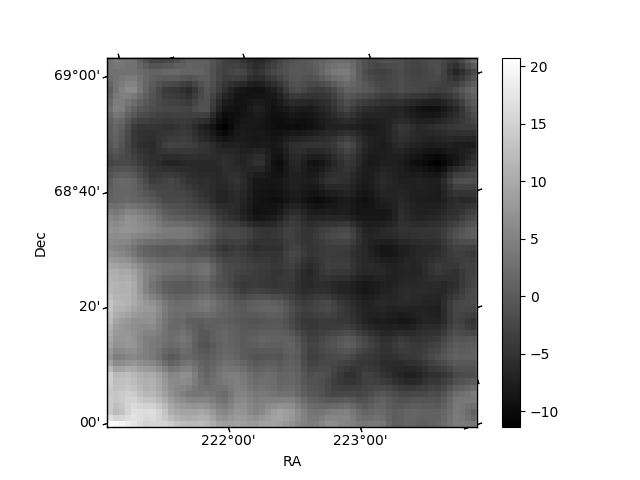
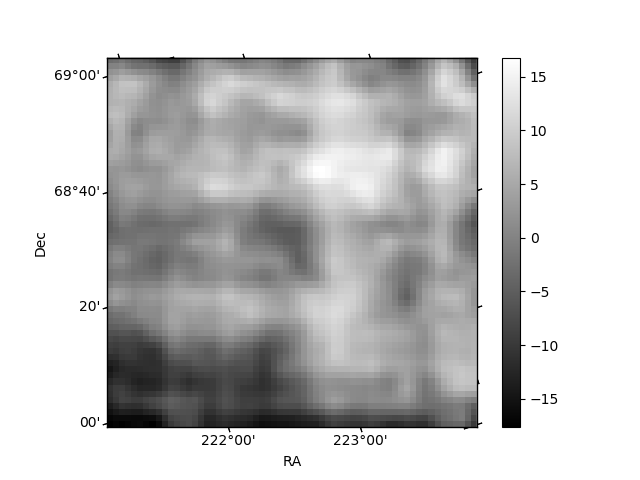
Histogram calculated using DETX and DETY for each event in the final _common_clean file
| Quadrant A | 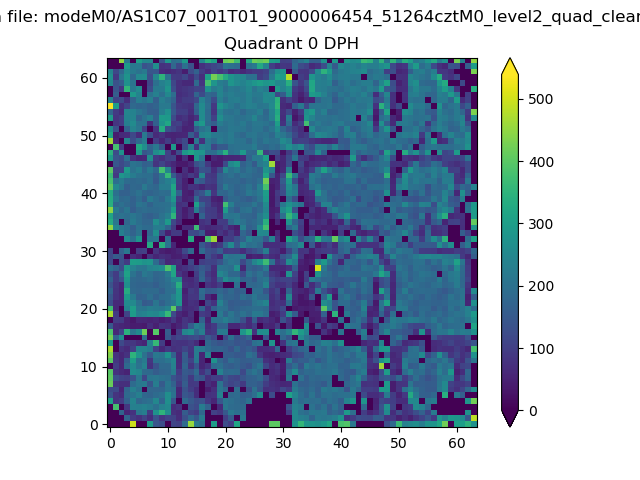 |
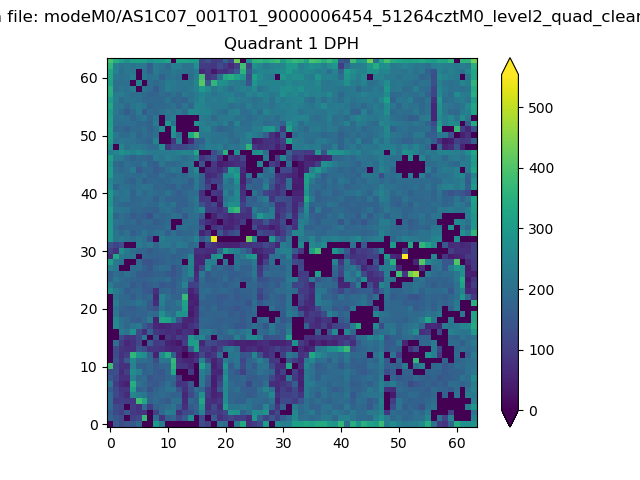 |
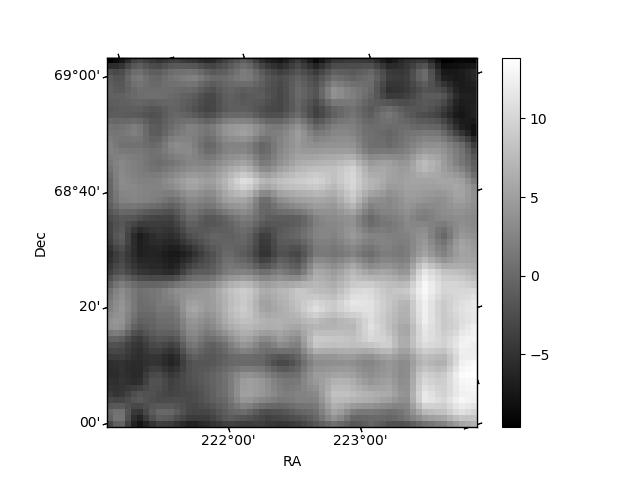
Quadrant B |
|---|---|---|---|
| Quadrant D | 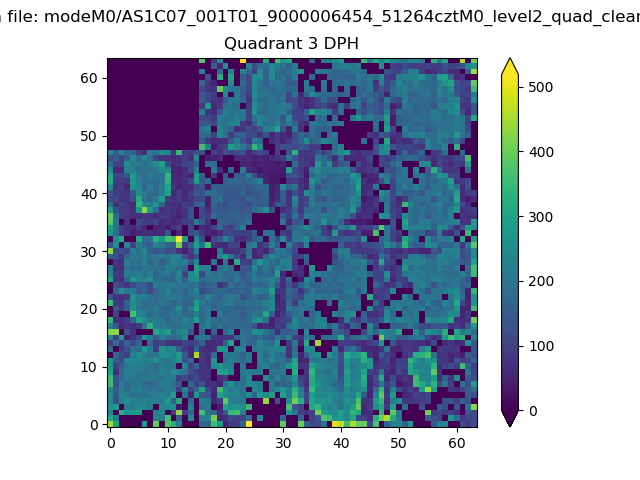 |
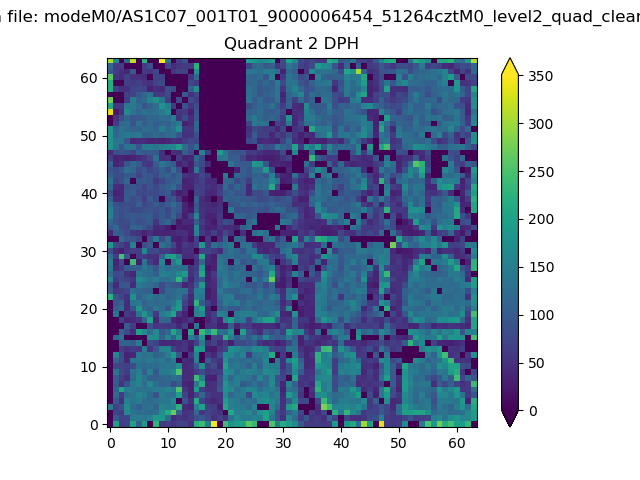 |
Quadrant C |
| Plot type | Count rate plots | Images |
|---|---|---|
| Comparison with Poisson distribution Blue bars denote a histogram of data divided into 1 sec bins. Red curve is a Poisson curve with rate = median count rate of data. |
 |
 |
| Quadrant-wise count rates Data is divided into 100 sec bins |
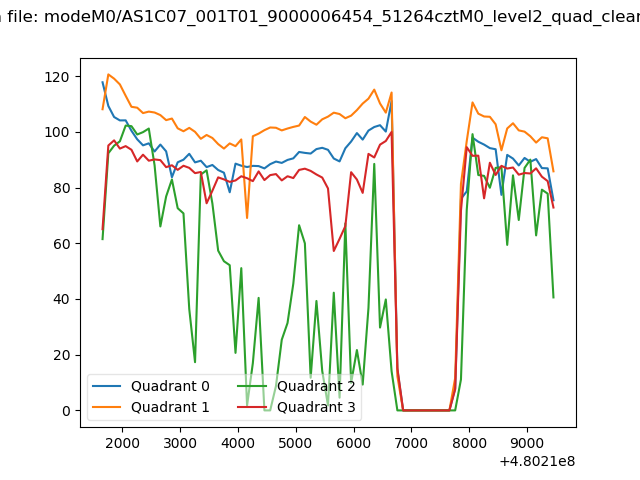 |
|
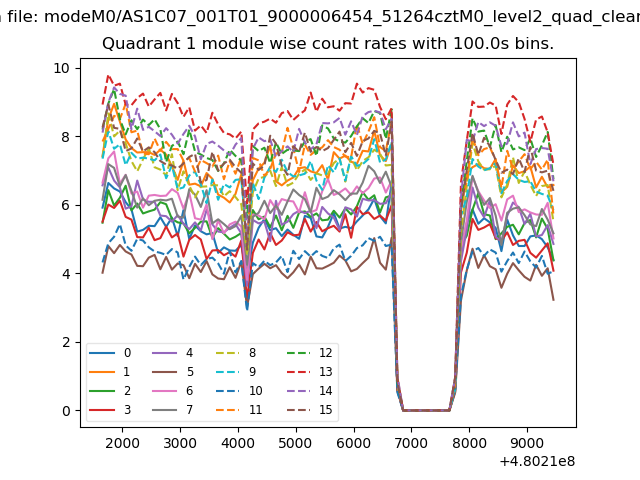
| Module-wise count rates for Quadrant A Data is divided into 100 sec bins |
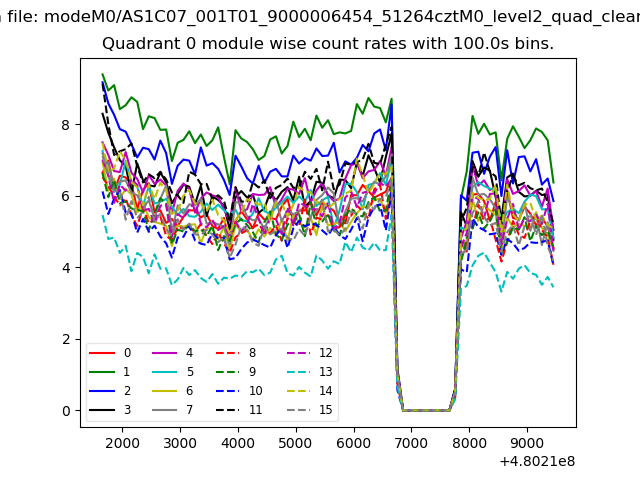 |
 |
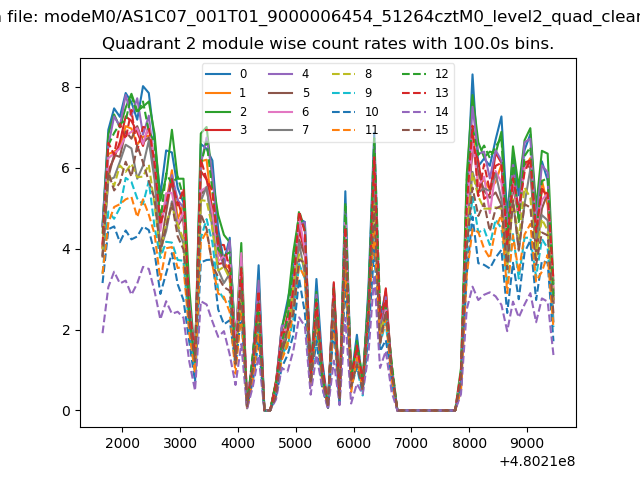
| Module-wise count rates for Quadrant B Data is divided into 100 sec bins |
 |
 |
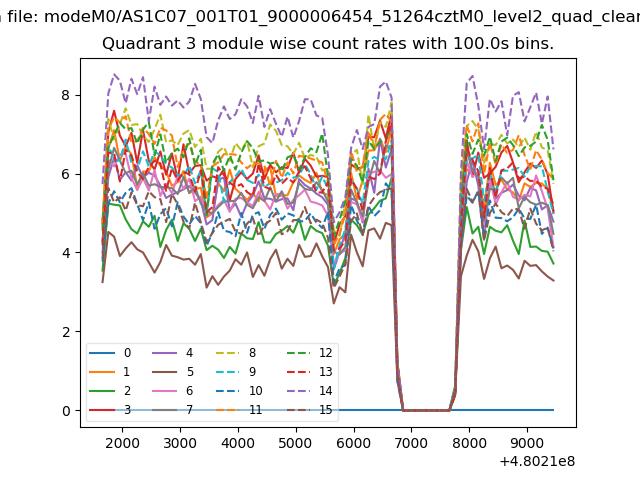
| Module-wise count rates for Quadrant C Data is divided into 100 sec bins |
 |
 |
| Module-wise count rates for Quadrant D Data is divided into 100 sec bins |
 |
 |
| Parameter | Plot |
|---|---|
| CZT HV Monitor | 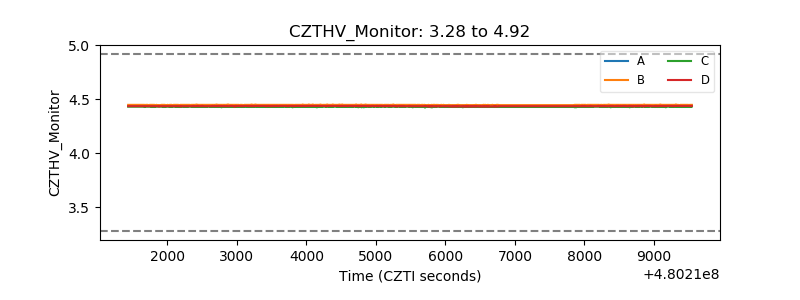 |
| D_VDD | 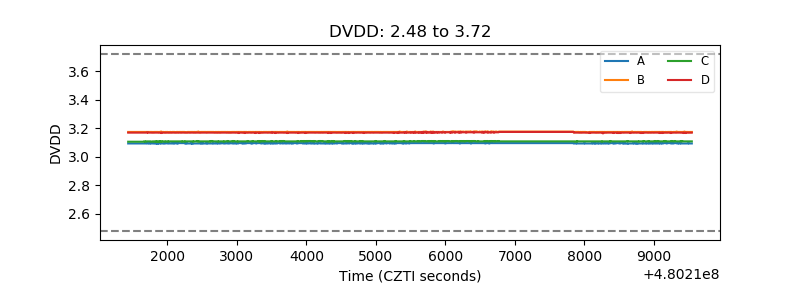 |
| Temperature 1 | 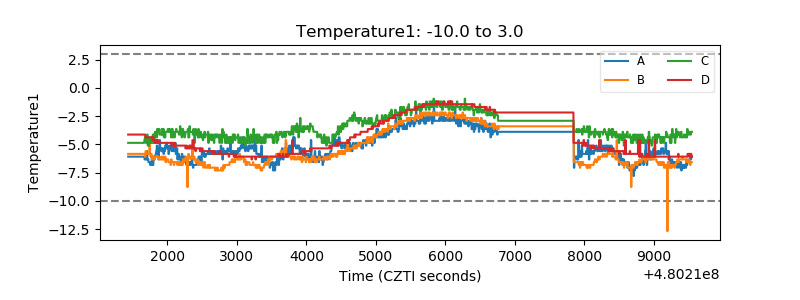 |
| Veto HV Monitor | 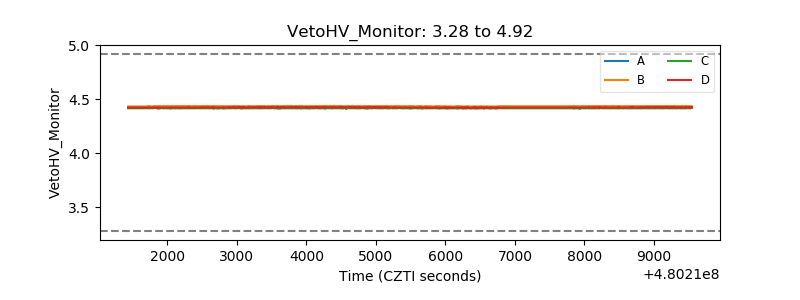 |
| Veto LLD | 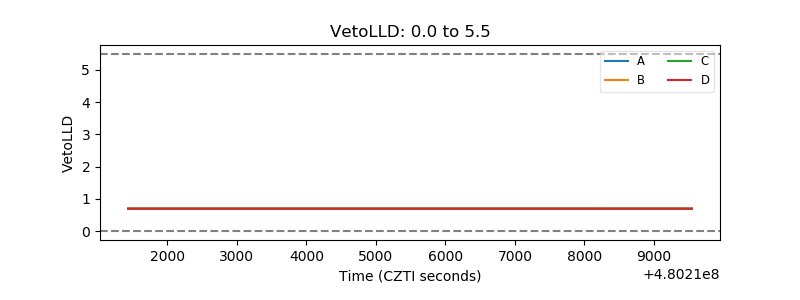 |
| Alpha Counter | 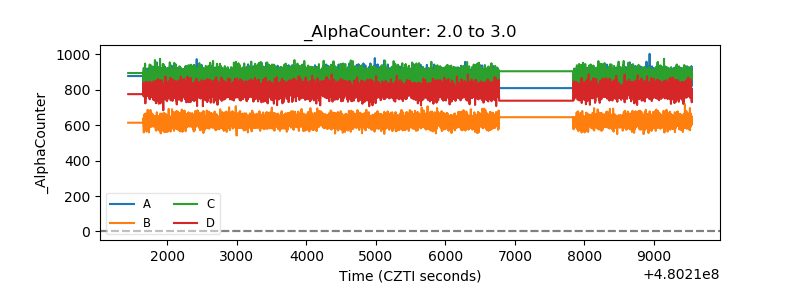 |
| _CPM_Rate | 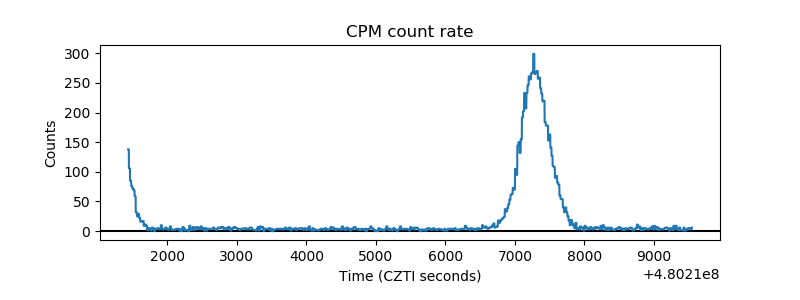 |
| CZT Counter | 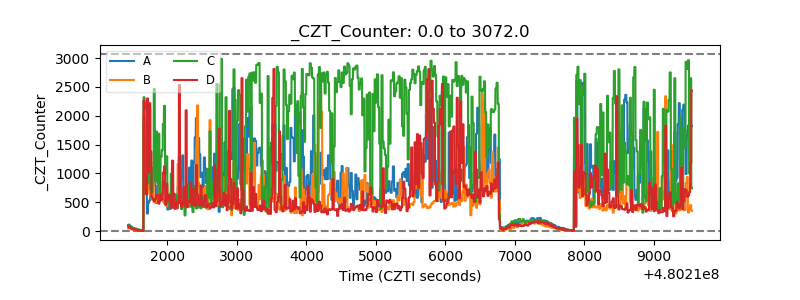 |
| +2.5 Volts monitor |  |
| +5 Volts monitor |  |
| _ROLL_ROT | 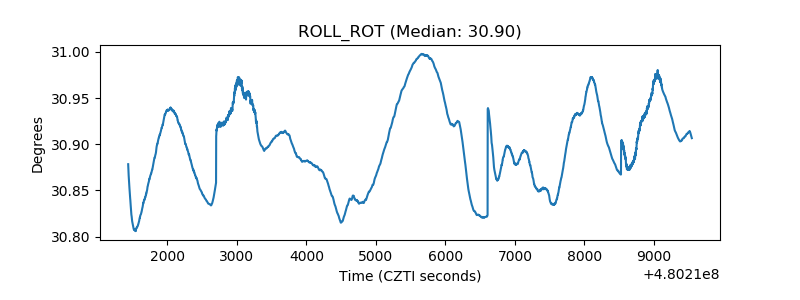 |
| _Roll_DEC | 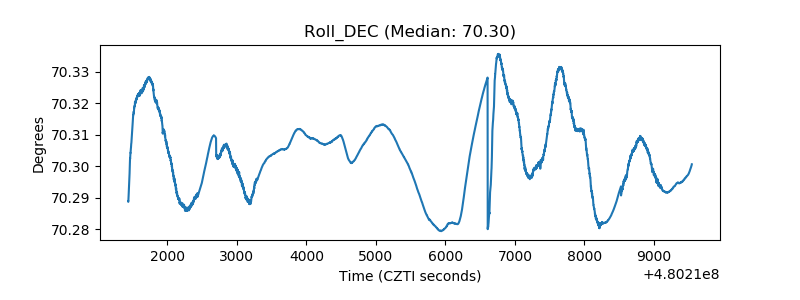 |
| _Roll_RA | 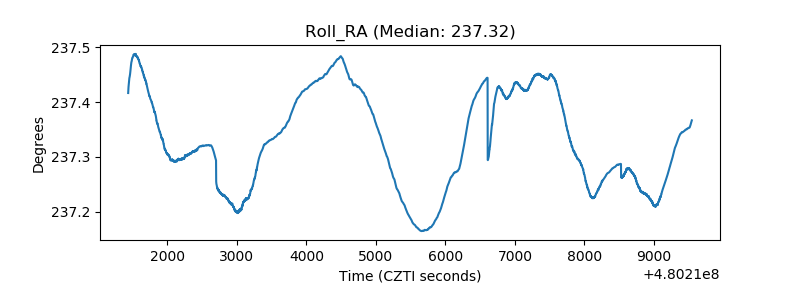 |
| Veto Counter | 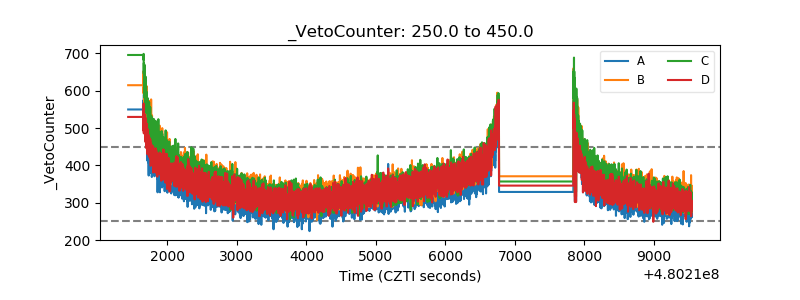 |