| Param | Original file | Final file |
|---|---|---|
| Filename | modeM0/AS1C07_001T01_9000006454_51265cztM0_level2.fits | modeM0/AS1C07_001T01_9000006454_51265cztM0_level2_quad_clean.evt |
| Size (bytes) | 803,255,040 | 92,292,480 |
| Size | 766.0 MB | 88.0 MB |
| Events in quadrant A | 8,107,501 | 619,213 |
| Events in quadrant B | 5,216,849 | 639,032 |
| Events in quadrant C | 10,636,252 | 459,360 |
| Events in quadrant D | 5,232,219 | 587,878 |
| Mode M0 | |||
|---|---|---|---|
| Quadrant | BADHDUFLAG | Total packets | Discarded packets |
| A | 0 | 29030 | 2 |
| B | 0 | 20686 | 2 |
| C | 0 | 36469 | 5 |
| D | 0 | 20507 | 2 |
| Mode SS | |||
|---|---|---|---|
| Quadrant | BADHDUFLAG | Total packets | Discarded packets |
| A | 0 | 144 | 0 |
| B | 0 | 144 | 0 |
| C | 0 | 144 | 0 |
| D | 0 | 144 | 0 |
| Mode M9 | |||
|---|---|---|---|
| Quadrant | BADHDUFLAG | Total packets | Discarded packets |
| A | 0 | 8 | 0 |
| B | 0 | 8 | 0 |
| C | 0 | 8 | 0 |
| D | 0 | 8 | 0 |
| Quadrant | Total seconds | Saturated seconds | Saturation percentage |
|---|---|---|---|
| A | 7009 | 505 | 7.205022% |
| B | 7009 | 830 | 11.841918% |
| C | 7009 | 2336 | 33.328578% |
| D | 7009 | 224 | 3.195891% |
Noise dominated data is calculated using 1-second bins in cleaned event files. If a bin has >2000 counts, and if more than 50% of those come from <1% of pixels, then it is considered to be noise-dominated and hence unusable.
| Quadrant | # 1 sec bins | Bins with >0 counts | Bins with >2000 counts | High rate bins dominated by noise | Noise dominated (total time) | Noise dominated (detector-on time) | Marked lightcurve |
|---|---|---|---|---|---|---|---|
| A | 7855 | 7010 | 474 | 474 | 6.03% | 6.76% | 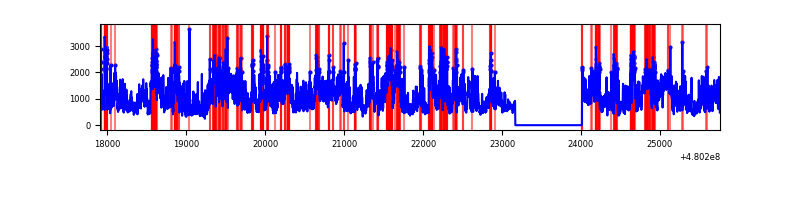 |
| B | 7855 | 7010 | 478 | 478 | 6.09% | 6.82% | 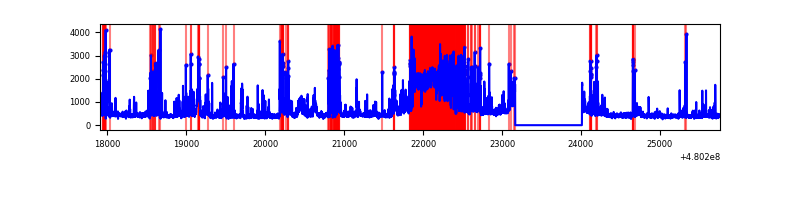 |
| C | 7854 | 7009 | 2289 | 2289 | 29.14% | 32.66% | 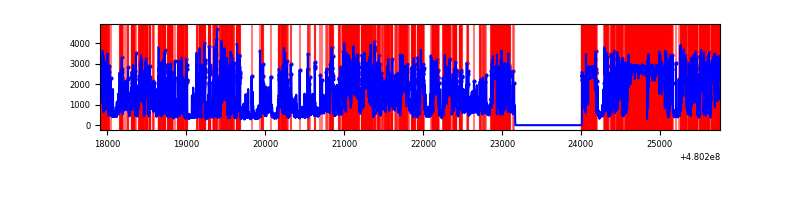 |
| D | 7855 | 7010 | 209 | 209 | 2.66% | 2.98% | 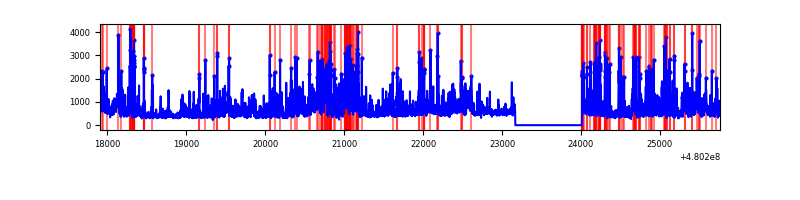 |
Top three noisy pixels from each quadrant. If the there are fewer than three noisy pixels in the level2.evt file, extra rows are filled as -1
| Pixel properties | Quadrant properties | ||||||
|---|---|---|---|---|---|---|---|
| Quadrant | DetID | PixID | Counts | Sigma | Mean | Median | Sigma |
| A | 12 | 80 | 2259570 | 12956.31 | 700 | 683 | 174.3 |
| A | 12 | 3 | 2094944 | 12012.06 | 700 | 683 | 174.3 |
| A | 12 | 250 | 269751 | 1543.29 | 700 | 683 | 174.3 |
| B | 12 | 32 | 1462071 | 10246.63 | 670 | 647 | 142.6 |
| B | 5 | 185 | 275820 | 1929.35 | 670 | 647 | 142.6 |
| B | 7 | 252 | 223715 | 1564.02 | 670 | 647 | 142.6 |
| C | 4 | 12 | 7547211 | 45205.38 | 598 | 592 | 166.9 |
| C | 3 | 233 | 294024 | 1757.7 | 598 | 592 | 166.9 |
| C | 13 | 3 | 83370 | 495.85 | 598 | 592 | 166.9 |
| D | 2 | 216 | 1494935 | 7753.19 | 679 | 654 | 192.7 |
| D | 8 | 176 | 475699 | 2464.81 | 679 | 654 | 192.7 |
| D | 3 | 12 | 327131 | 1693.95 | 679 | 654 | 192.7 |
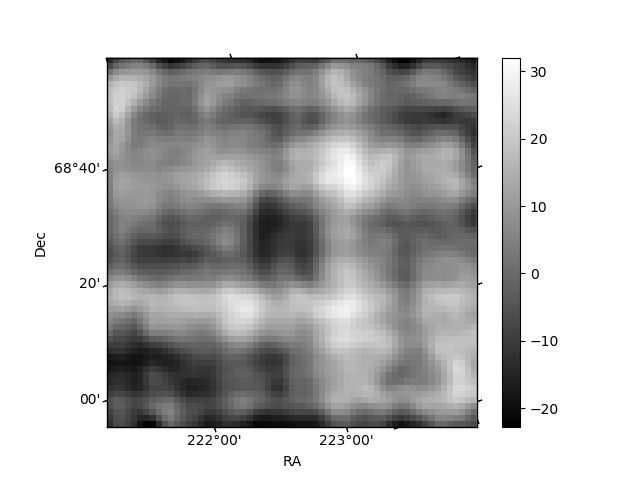
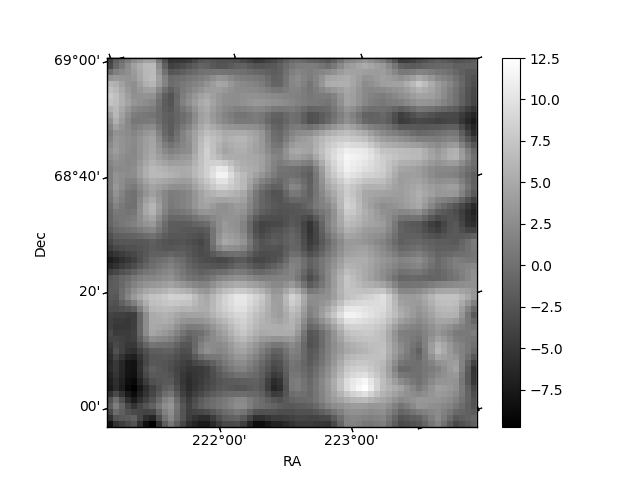
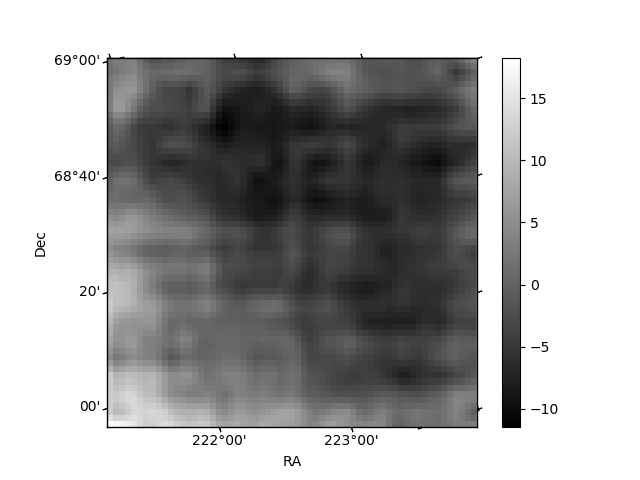
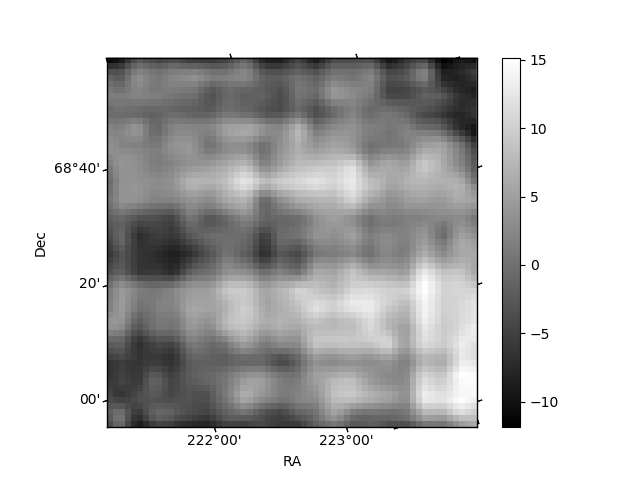
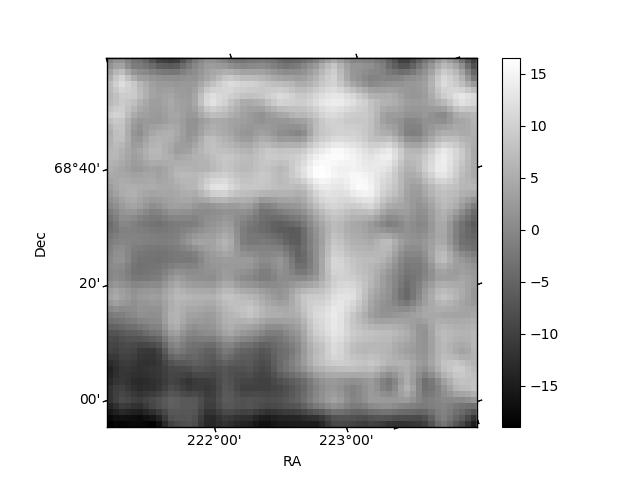
Histogram calculated using DETX and DETY for each event in the final _common_clean file
| Quadrant A | 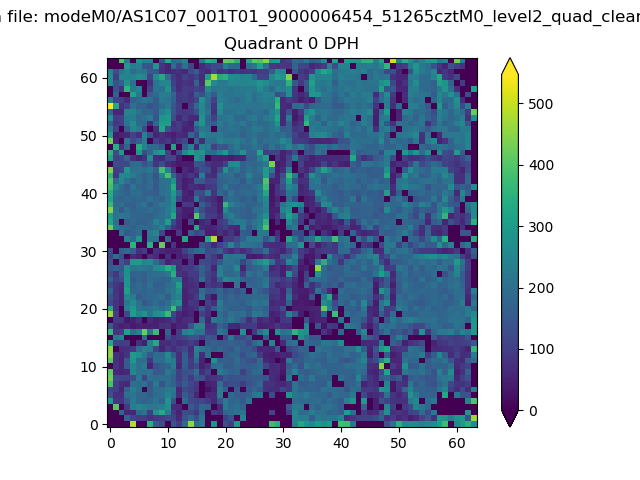 |
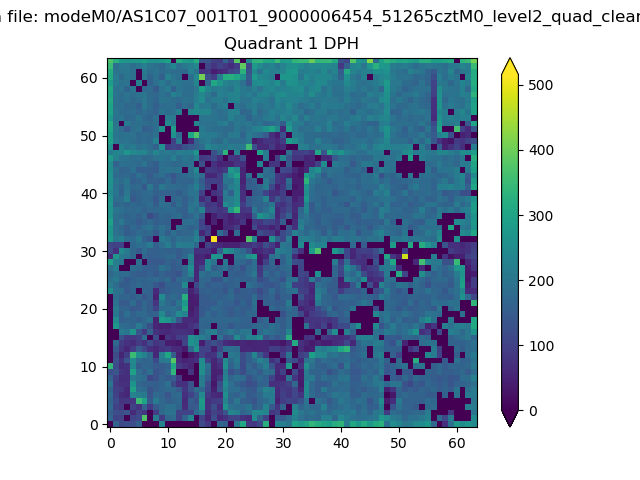 |
Quadrant B |
|---|---|---|---|
| Quadrant D | 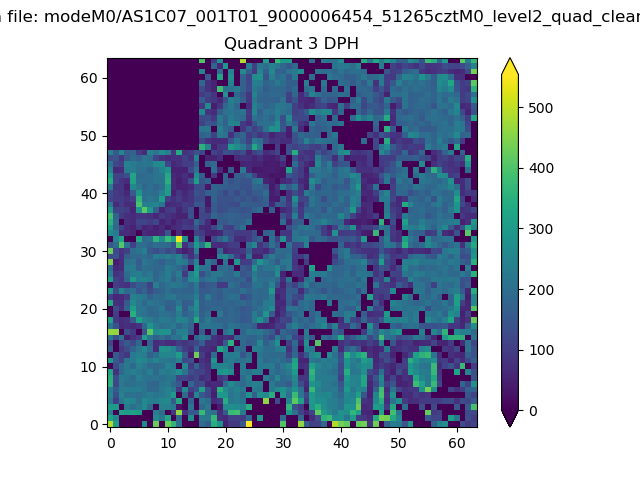 |
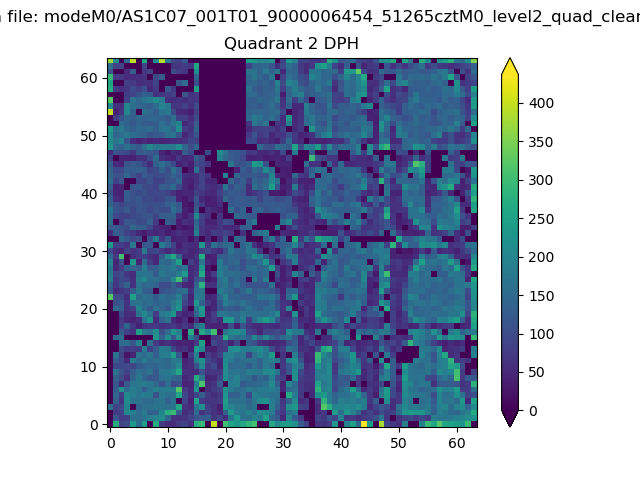 |
Quadrant C |
| Plot type | Count rate plots | Images |
|---|---|---|
| Comparison with Poisson distribution Blue bars denote a histogram of data divided into 1 sec bins. Red curve is a Poisson curve with rate = median count rate of data. |
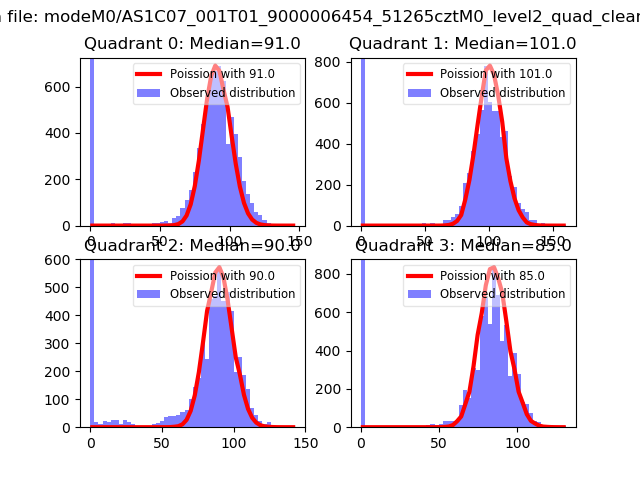 |
 |
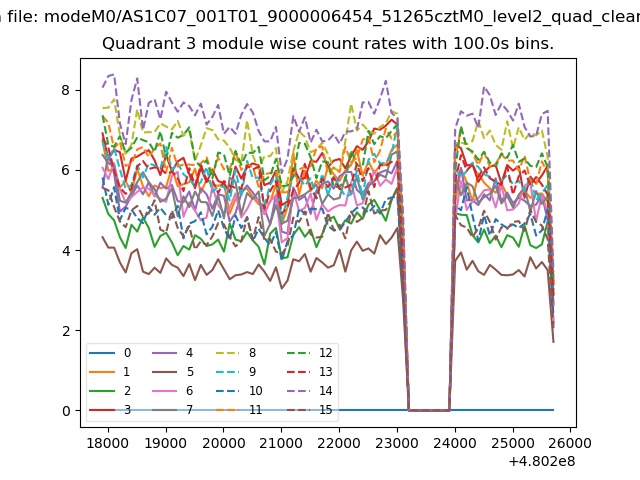
| Quadrant-wise count rates Data is divided into 100 sec bins |
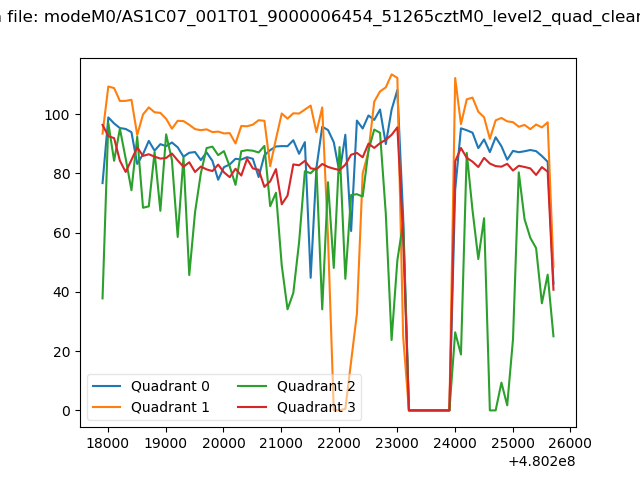 |
|
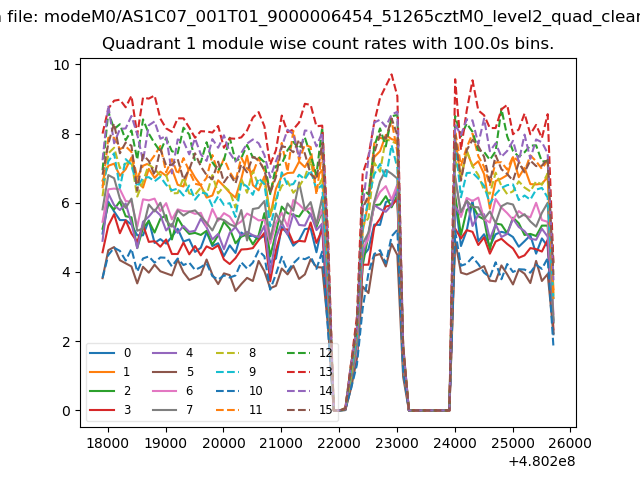
| Module-wise count rates for Quadrant A Data is divided into 100 sec bins |
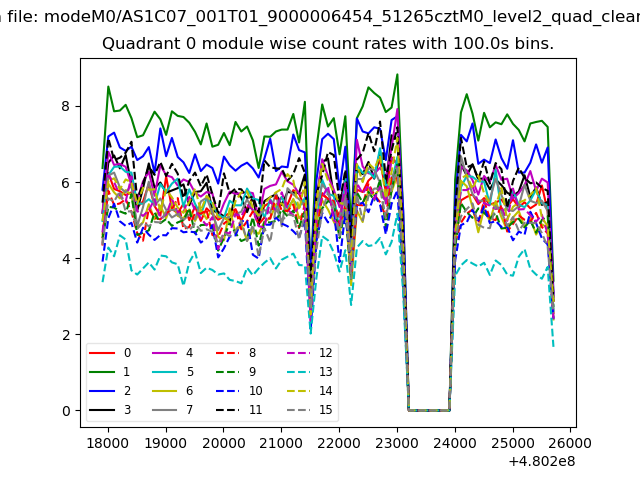 |
 |
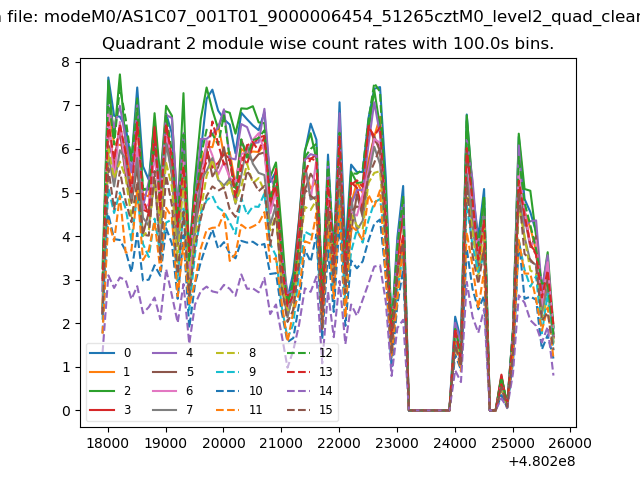
| Module-wise count rates for Quadrant B Data is divided into 100 sec bins |
 |
 |
| Module-wise count rates for Quadrant C Data is divided into 100 sec bins |
 |
 |
| Module-wise count rates for Quadrant D Data is divided into 100 sec bins |
 |
 |
| Parameter | Plot |
|---|---|
| CZT HV Monitor | 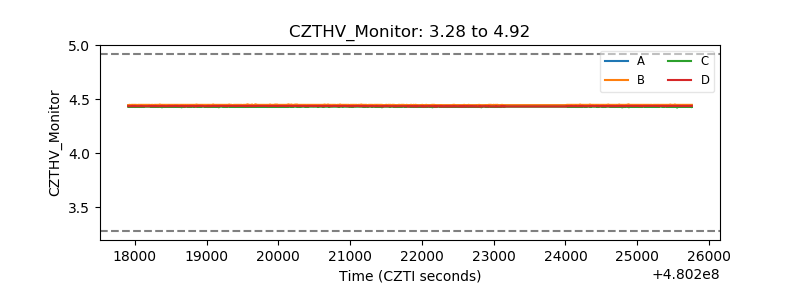 |
| D_VDD | 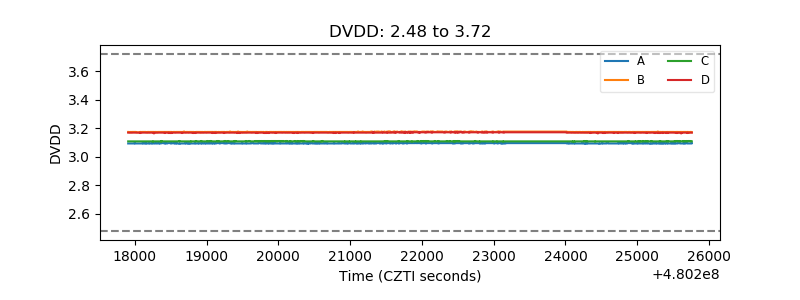 |
| Temperature 1 | 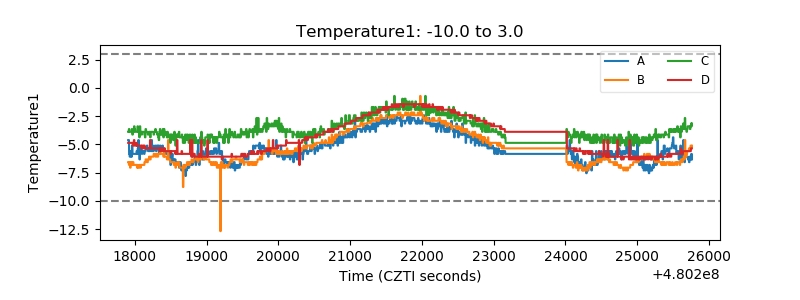 |
| Veto HV Monitor | 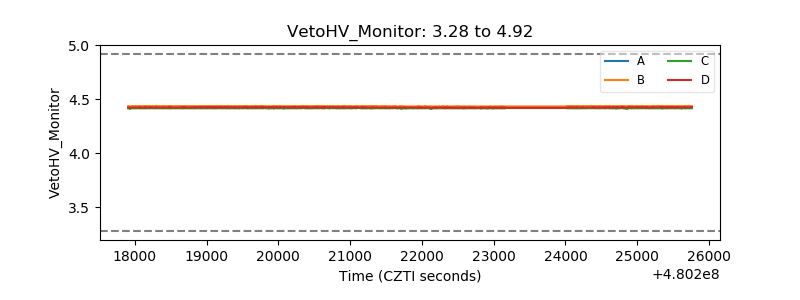 |
| Veto LLD | 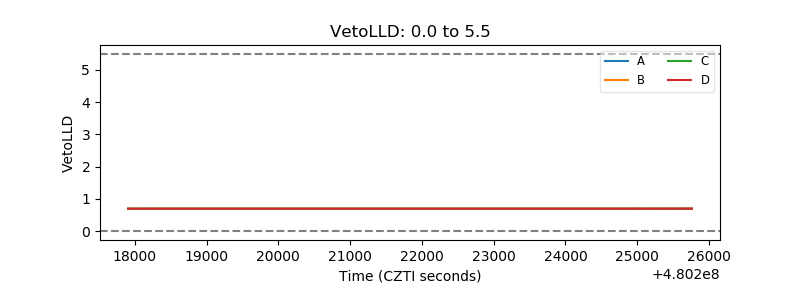 |
| Alpha Counter | 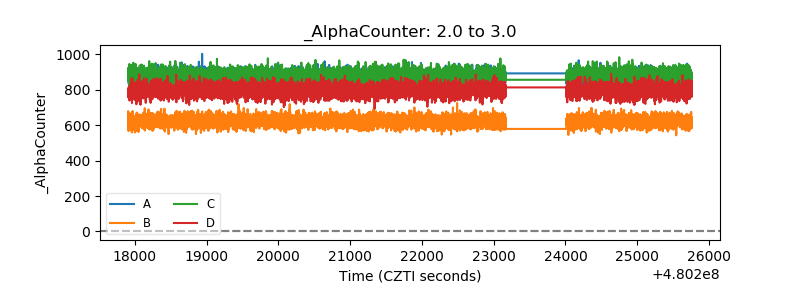 |
| _CPM_Rate | 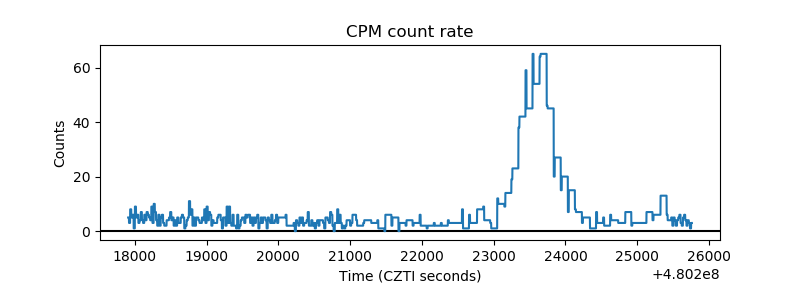 |
| CZT Counter | 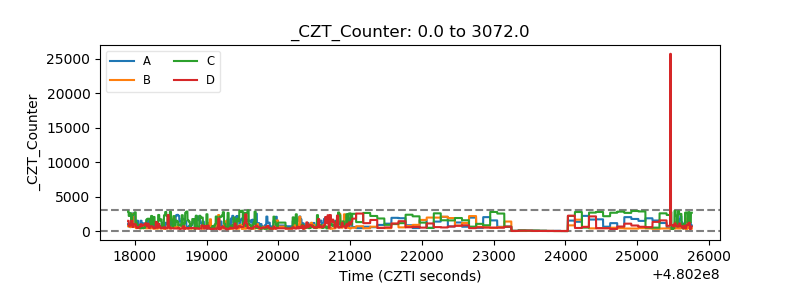 |
| +2.5 Volts monitor | 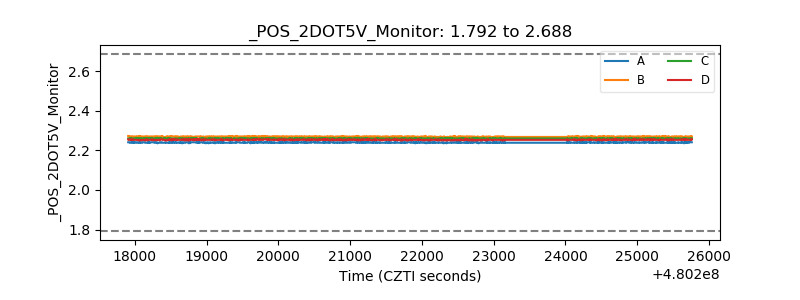 |
| +5 Volts monitor | 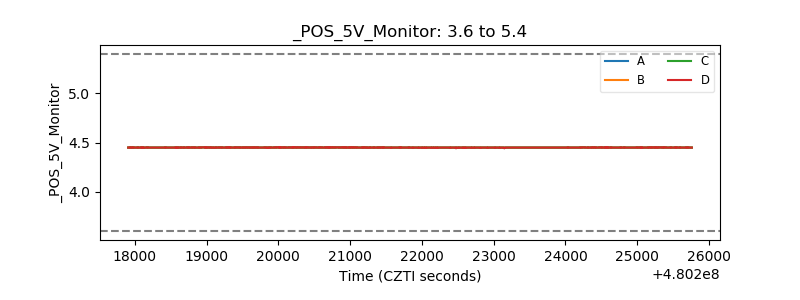 |
| _ROLL_ROT | 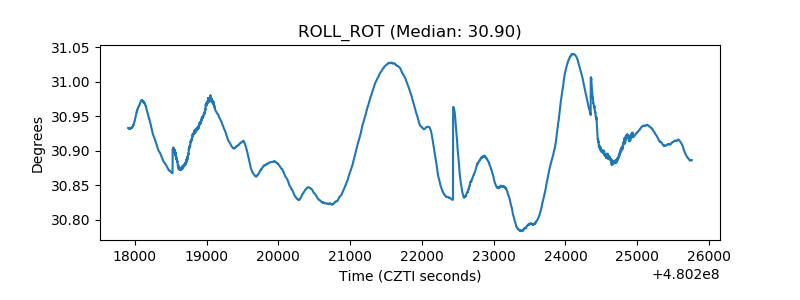 |
| _Roll_DEC | 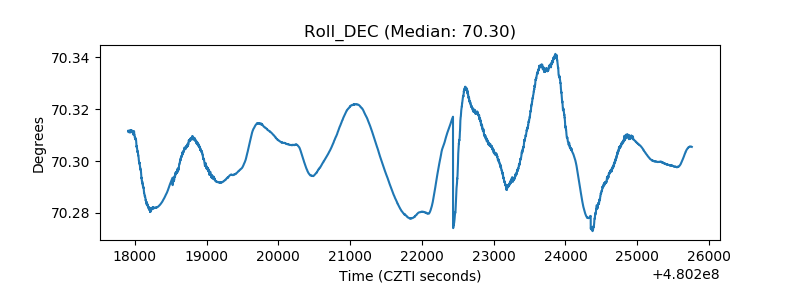 |
| _Roll_RA | 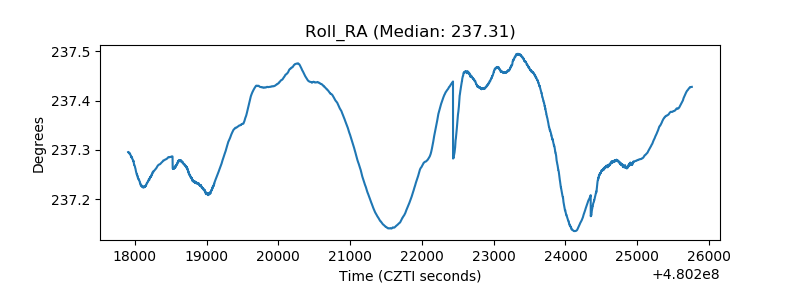 |
| Veto Counter | 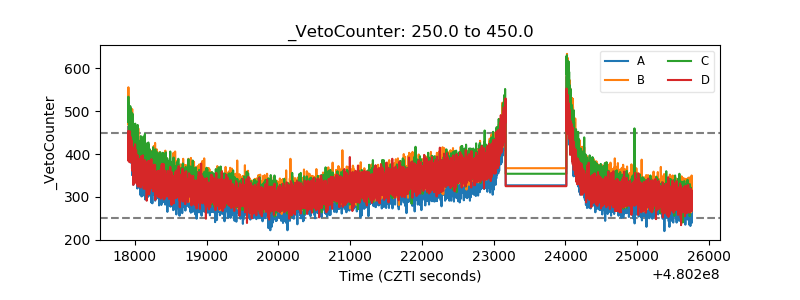 |