| Param | Original file | Final file |
|---|---|---|
| Filename | modeM0/AS1C07_001T01_9000006454_51266cztM0_level2.fits | modeM0/AS1C07_001T01_9000006454_51266cztM0_level2_quad_clean.evt |
| Size (bytes) | 925,594,560 | 93,830,400 |
| Size | 882.7 MB | 89.5 MB |
| Events in quadrant A | 7,440,141 | 676,850 |
| Events in quadrant B | 4,924,378 | 730,294 |
| Events in quadrant C | 15,533,866 | 280,612 |
| Events in quadrant D | 5,776,480 | 624,095 |
| Mode M0 | |||
|---|---|---|---|
| Quadrant | BADHDUFLAG | Total packets | Discarded packets |
| A | 0 | 27491 | 1 |
| B | 0 | 20117 | 1 |
| C | 0 | 51299 | 1 |
| D | 0 | 22629 | 1 |
| Mode SS | |||
|---|---|---|---|
| Quadrant | BADHDUFLAG | Total packets | Discarded packets |
| A | 0 | 154 | 0 |
| B | 0 | 154 | 0 |
| C | 0 | 154 | 0 |
| D | 0 | 154 | 0 |
| Mode M9 | |||
|---|---|---|---|
| Quadrant | BADHDUFLAG | Total packets | Discarded packets |
| A | 0 | 1 | 0 |
| B | 0 | 1 | 0 |
| C | 0 | 1 | 0 |
| D | 0 | 1 | 0 |
| Quadrant | Total seconds | Saturated seconds | Saturation percentage |
|---|---|---|---|
| A | 7603 | 419 | 5.510983% |
| B | 7603 | 551 | 7.247139% |
| C | 7604 | 4765 | 62.664387% |
| D | 7604 | 399 | 5.247238% |
Noise dominated data is calculated using 1-second bins in cleaned event files. If a bin has >2000 counts, and if more than 50% of those come from <1% of pixels, then it is considered to be noise-dominated and hence unusable.
| Quadrant | # 1 sec bins | Bins with >0 counts | Bins with >2000 counts | High rate bins dominated by noise | Noise dominated (total time) | Noise dominated (detector-on time) | Marked lightcurve |
|---|---|---|---|---|---|---|---|
| A | 7718 | 7605 | 287 | 287 | 3.72% | 3.77% | 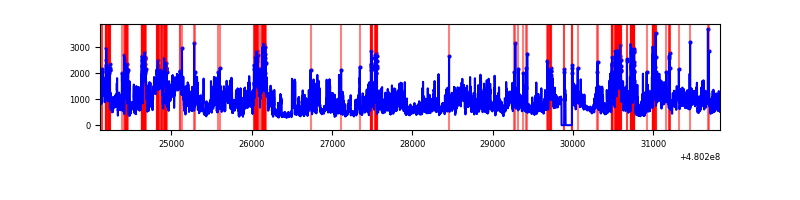 |
| B | 7718 | 7605 | 314 | 314 | 4.07% | 4.13% | 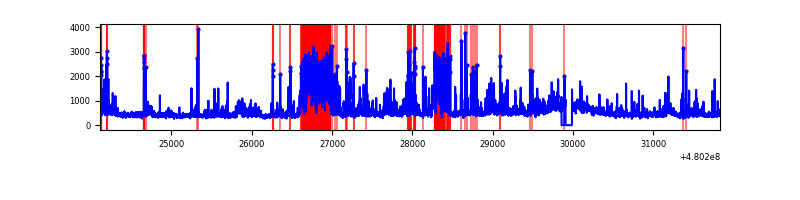 |
| C | 7719 | 7604 | 4648 | 4648 | 60.22% | 61.13% | 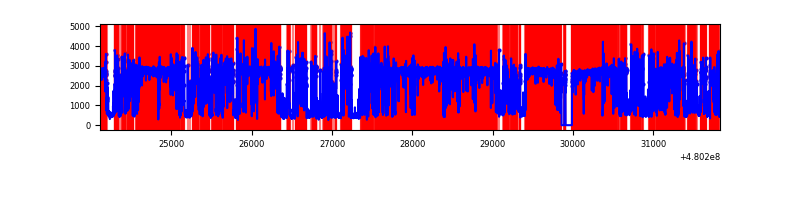 |
| D | 7719 | 7606 | 359 | 359 | 4.65% | 4.72% | 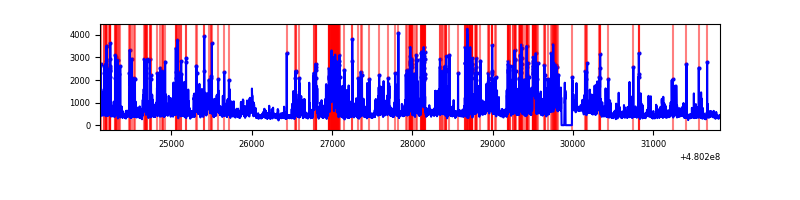 |
Top three noisy pixels from each quadrant. If the there are fewer than three noisy pixels in the level2.evt file, extra rows are filled as -1
| Pixel properties | Quadrant properties | ||||||
|---|---|---|---|---|---|---|---|
| Quadrant | DetID | PixID | Counts | Sigma | Mean | Median | Sigma |
| A | 12 | 3 | 2367964 | 12083.59 | 789 | 766 | 195.9 |
| A | 12 | 80 | 690383 | 3520.22 | 789 | 766 | 195.9 |
| A | 12 | 250 | 511081 | 2604.95 | 789 | 766 | 195.9 |
| B | 12 | 32 | 1049930 | 6255.86 | 783 | 754 | 167.7 |
| B | 8 | 128 | 225893 | 1342.42 | 783 | 754 | 167.7 |
| B | 7 | 252 | 95348 | 564.03 | 783 | 754 | 167.7 |
| C | 4 | 12 | 12260653 | 96721.47 | 451 | 446 | 126.8 |
| C | 1 | 243 | 453923 | 3577.51 | 451 | 446 | 126.8 |
| C | 10 | 171 | 388385 | 3060.47 | 451 | 446 | 126.8 |
| D | 2 | 216 | 916255 | 4325.47 | 757 | 729 | 211.7 |
| D | 3 | 12 | 813430 | 3839.66 | 757 | 729 | 211.7 |
| D | 8 | 176 | 545905 | 2575.72 | 757 | 729 | 211.7 |
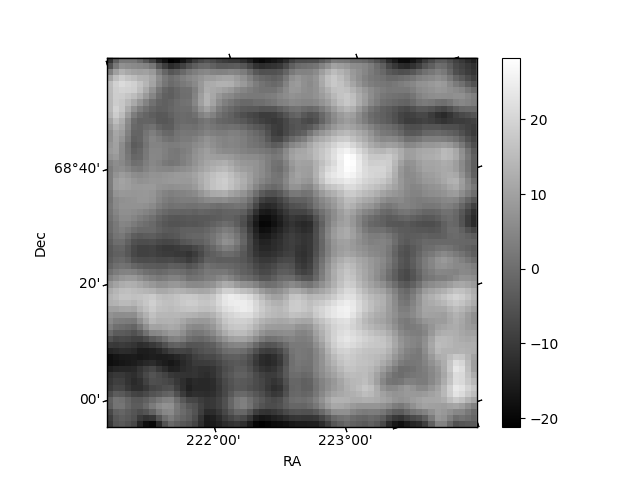
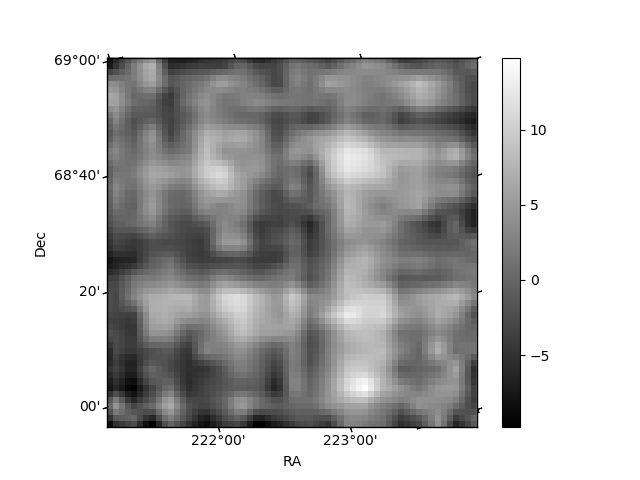
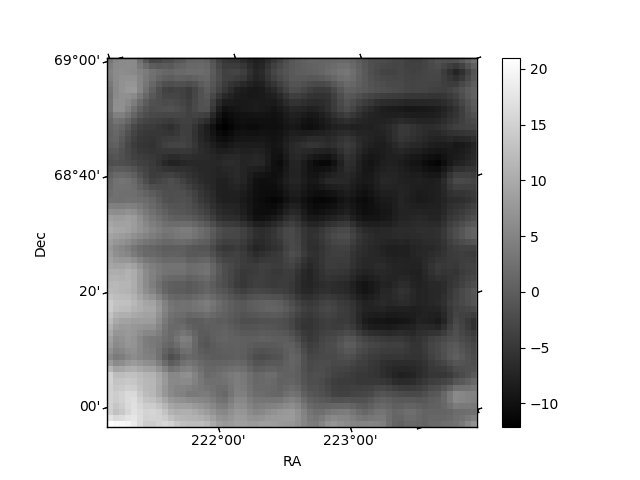
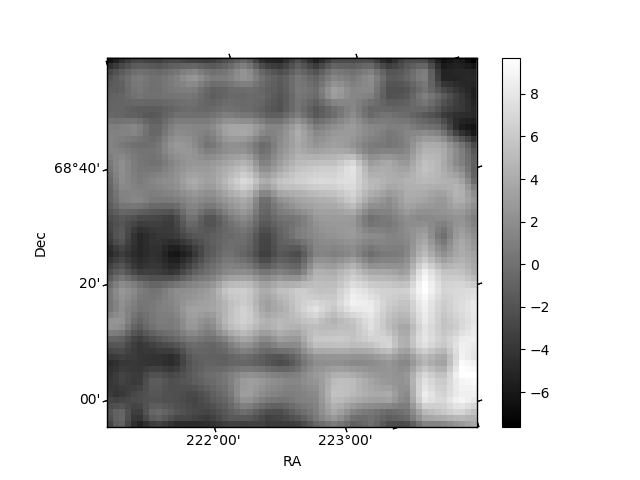
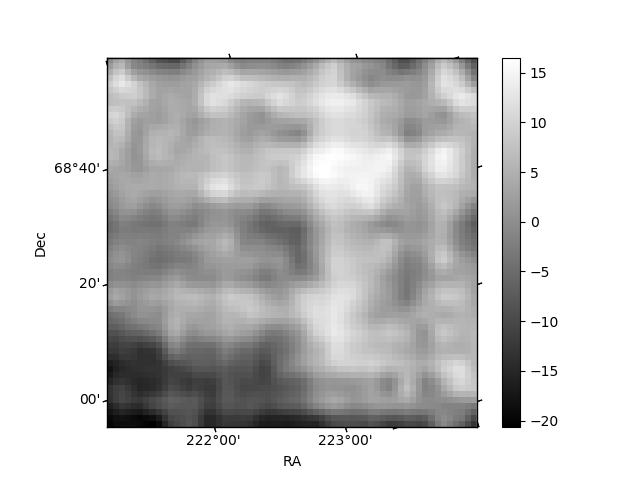
Histogram calculated using DETX and DETY for each event in the final _common_clean file
| Quadrant A | 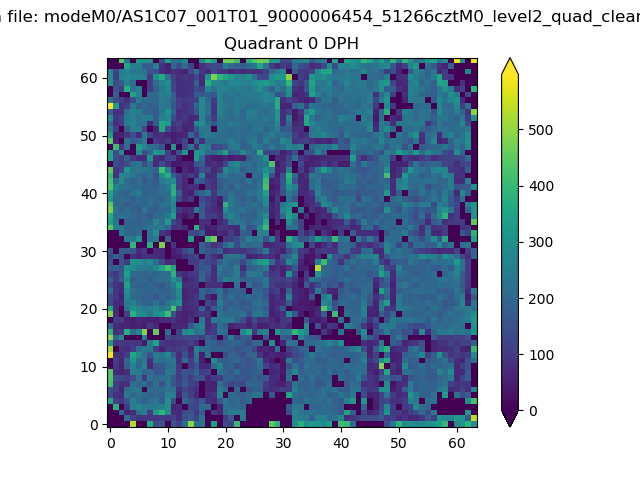 |
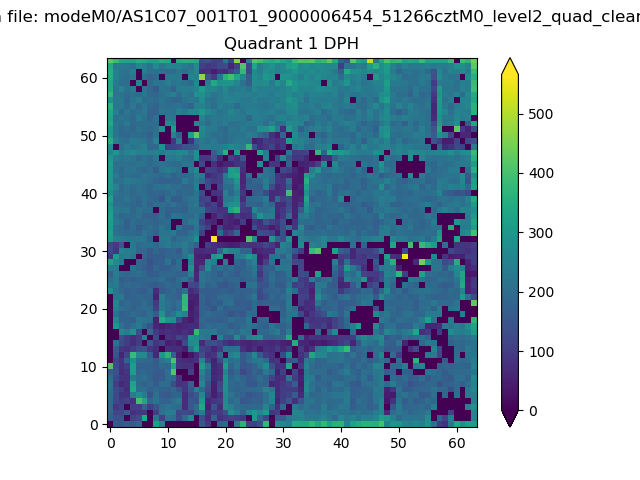 |
Quadrant B |
|---|---|---|---|
| Quadrant D | 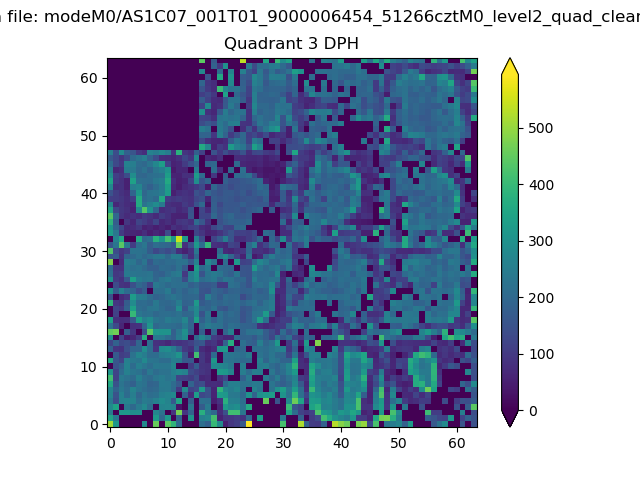 |
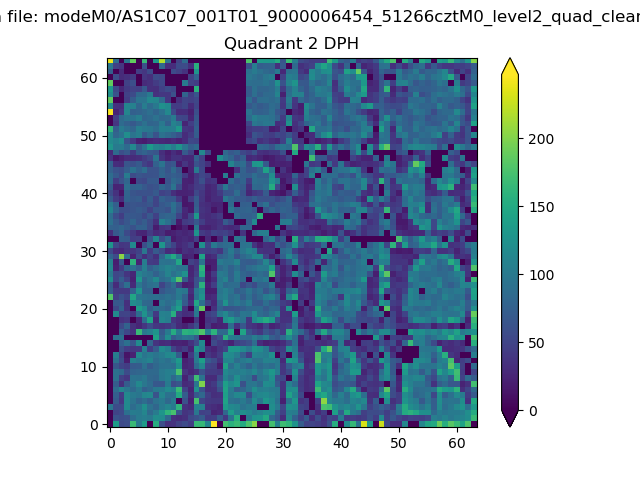 |
Quadrant C |
| Plot type | Count rate plots | Images |
|---|---|---|
| Comparison with Poisson distribution Blue bars denote a histogram of data divided into 1 sec bins. Red curve is a Poisson curve with rate = median count rate of data. |
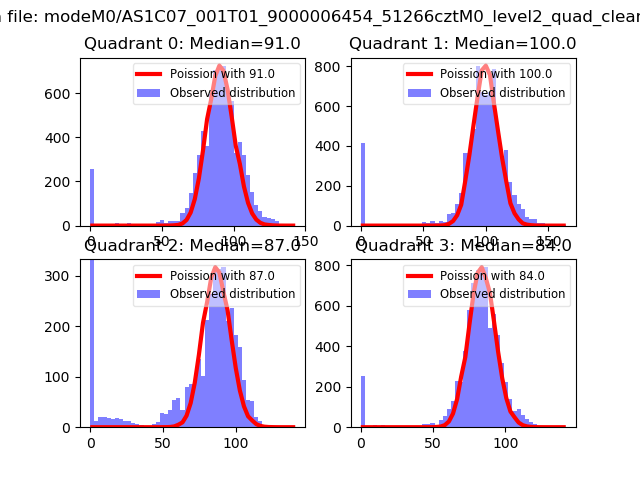 |
 |
| Quadrant-wise count rates Data is divided into 100 sec bins |
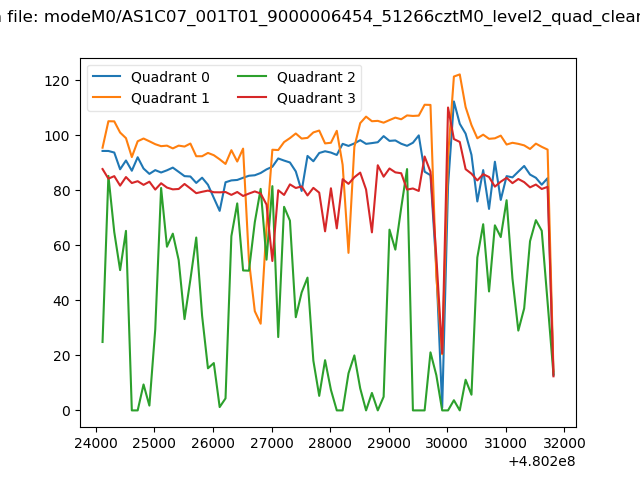 |
|
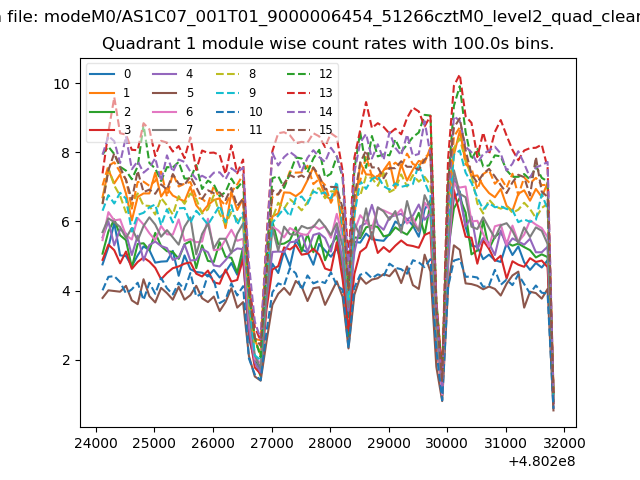
| Module-wise count rates for Quadrant A Data is divided into 100 sec bins |
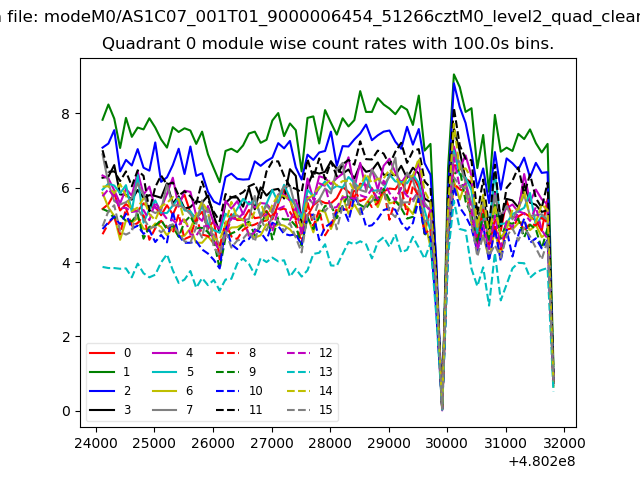 |
 |
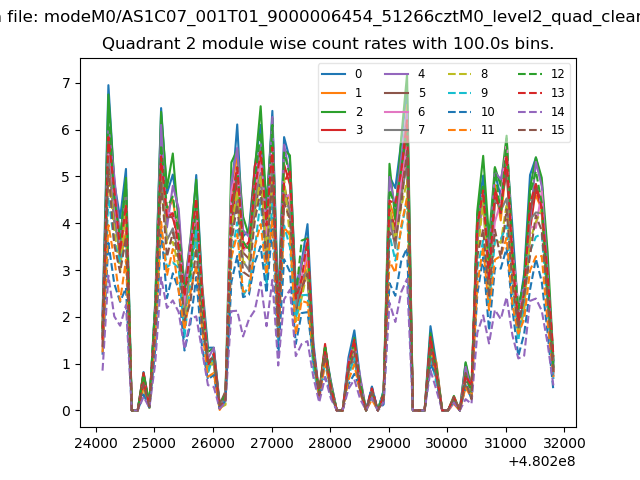
| Module-wise count rates for Quadrant B Data is divided into 100 sec bins |
 |
 |
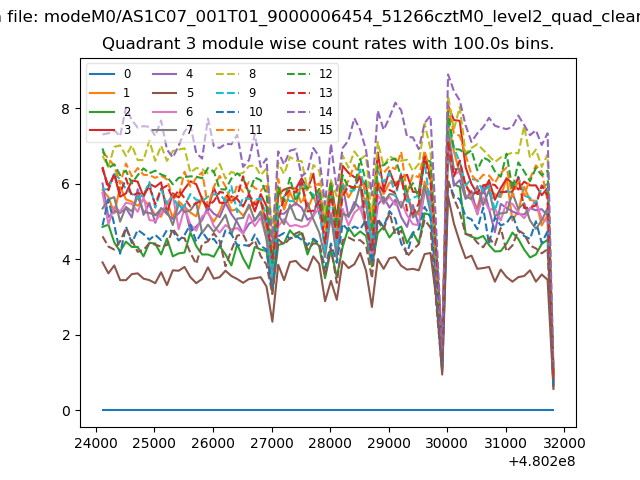
| Module-wise count rates for Quadrant C Data is divided into 100 sec bins |
 |
 |
| Module-wise count rates for Quadrant D Data is divided into 100 sec bins |
 |
 |
| Parameter | Plot |
|---|---|
| CZT HV Monitor | 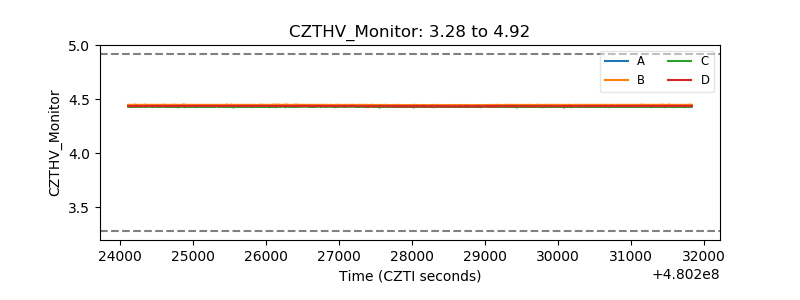 |
| D_VDD | 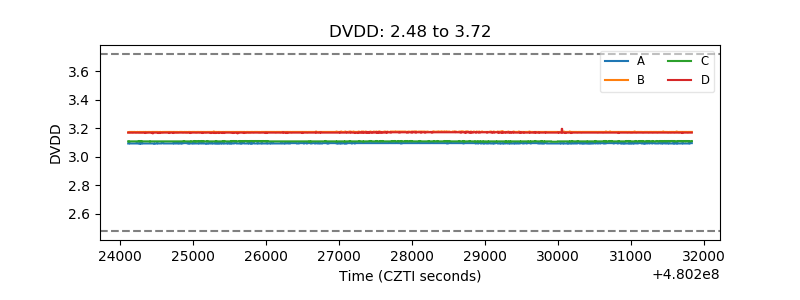 |
| Temperature 1 | 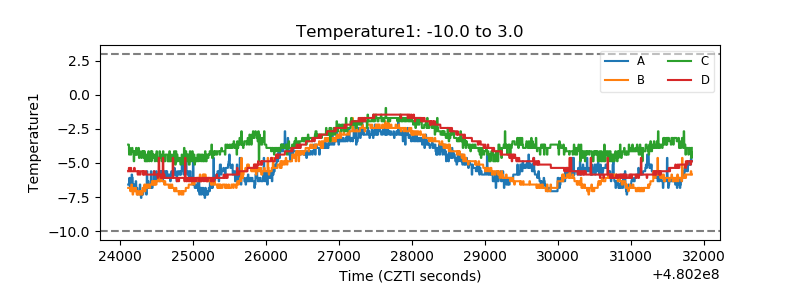 |
| Veto HV Monitor | 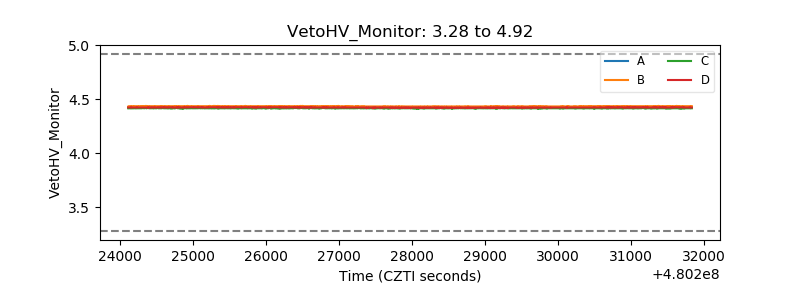 |
| Veto LLD | 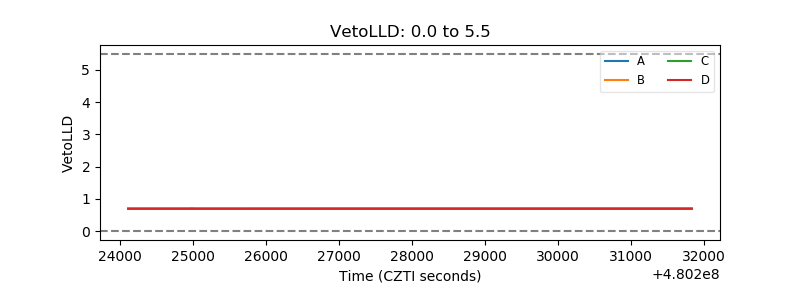 |
| Alpha Counter | 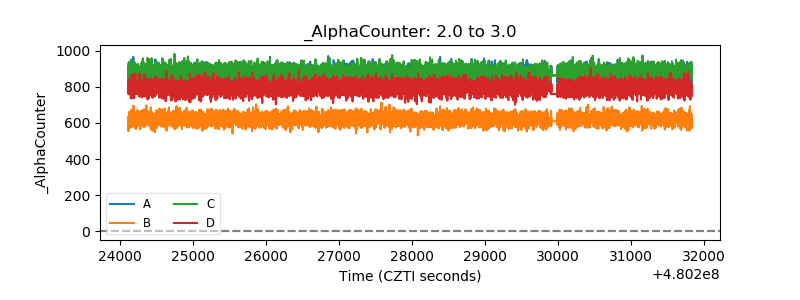 |
| _CPM_Rate | 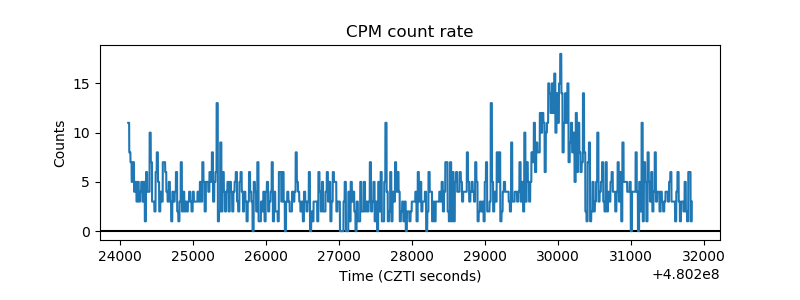 |
| CZT Counter | 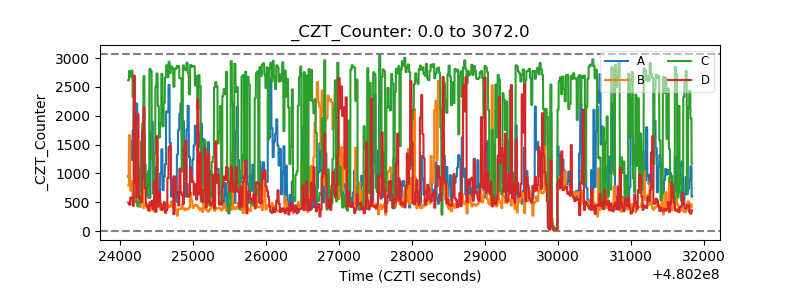 |
| +2.5 Volts monitor | 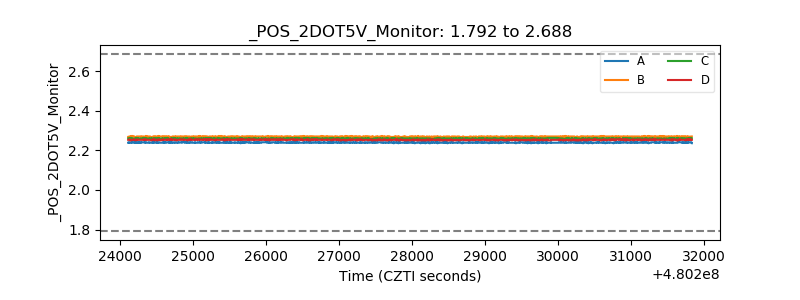 |
| +5 Volts monitor | 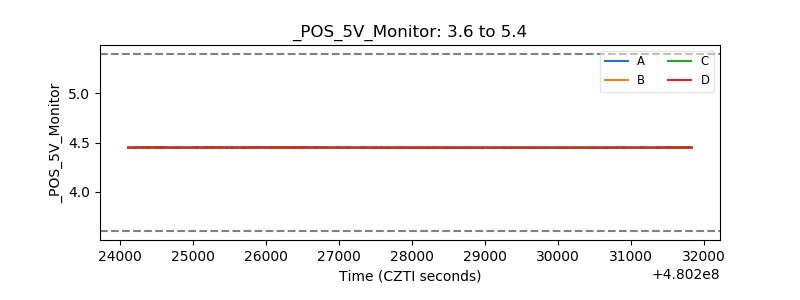 |
| _ROLL_ROT | 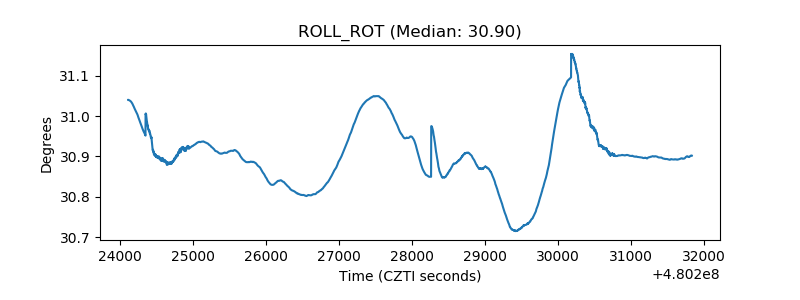 |
| _Roll_DEC | 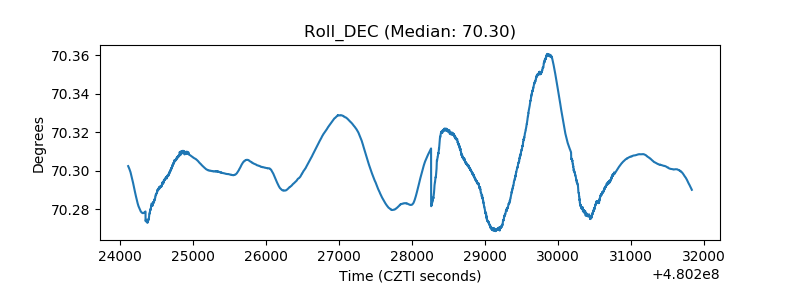 |
| _Roll_RA | 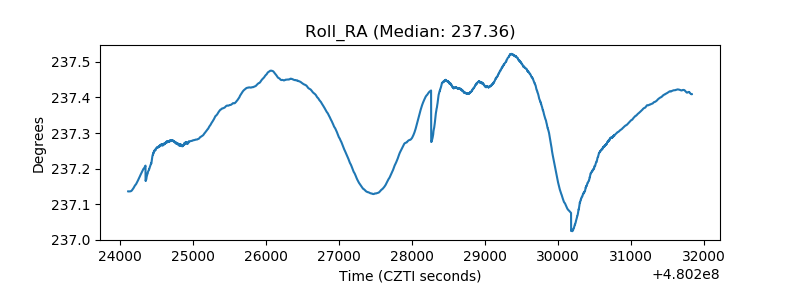 |
| Veto Counter | 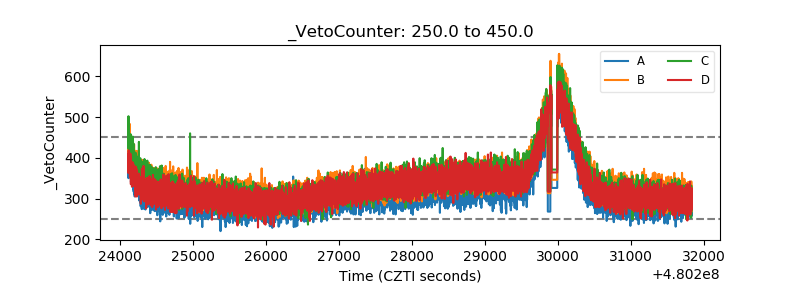 |