| Param | Original file | Final file |
|---|---|---|
| Filename | modeM0/AS1C07_001T01_9000006454_51267cztM0_level2.fits | modeM0/AS1C07_001T01_9000006454_51267cztM0_level2_quad_clean.evt |
| Size (bytes) | 693,993,600 | 97,464,960 |
| Size | 661.8 MB | 92.9 MB |
| Events in quadrant A | 6,413,513 | 649,615 |
| Events in quadrant B | 3,752,886 | 722,501 |
| Events in quadrant C | 10,303,989 | 487,587 |
| Events in quadrant D | 4,657,927 | 586,693 |
| Mode M0 | |||
|---|---|---|---|
| Quadrant | BADHDUFLAG | Total packets | Discarded packets |
| A | 0 | 24240 | 0 |
| B | 0 | 16352 | 0 |
| C | 0 | 35618 | 0 |
| D | 0 | 18982 | 0 |
| Mode SS | |||
|---|---|---|---|
| Quadrant | BADHDUFLAG | Total packets | Discarded packets |
| A | 0 | 144 | 0 |
| B | 0 | 144 | 0 |
| C | 0 | 144 | 0 |
| D | 0 | 144 | 0 |
| Quadrant | Total seconds | Saturated seconds | Saturation percentage |
|---|---|---|---|
| A | 7251 | 157 | 2.165219% |
| B | 7251 | 73 | 1.006758% |
| C | 7251 | 2158 | 29.761412% |
| D | 7251 | 281 | 3.875328% |
Noise dominated data is calculated using 1-second bins in cleaned event files. If a bin has >2000 counts, and if more than 50% of those come from <1% of pixels, then it is considered to be noise-dominated and hence unusable.
| Quadrant | # 1 sec bins | Bins with >0 counts | Bins with >2000 counts | High rate bins dominated by noise | Noise dominated (total time) | Noise dominated (detector-on time) | Marked lightcurve |
|---|---|---|---|---|---|---|---|
| A | 7251 | 7251 | 131 | 131 | 1.81% | 1.81% | 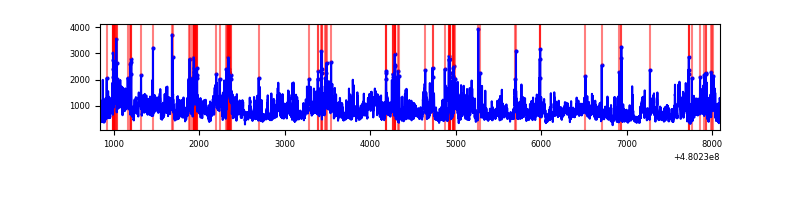 |
| B | 7251 | 7251 | 37 | 37 | 0.51% | 0.51% | 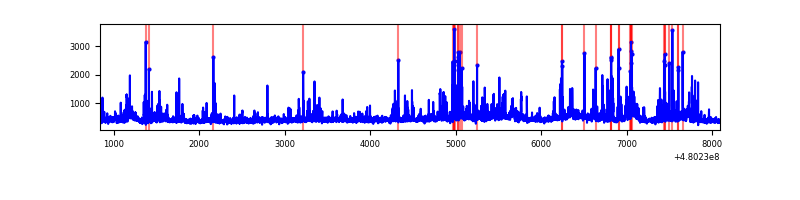 |
| C | 7251 | 7251 | 2139 | 2139 | 29.50% | 29.50% | 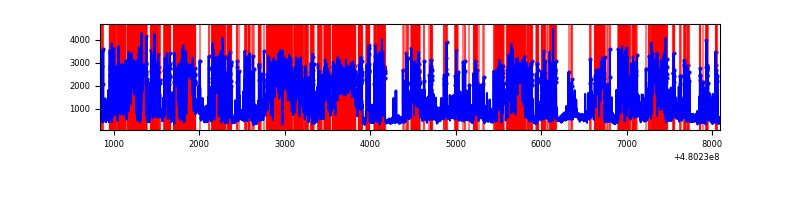 |
| D | 7251 | 7251 | 288 | 288 | 3.97% | 3.97% | 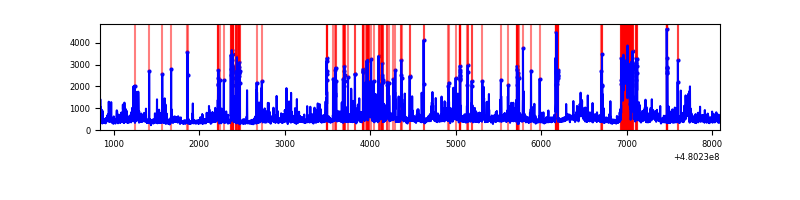 |
Top three noisy pixels from each quadrant. If the there are fewer than three noisy pixels in the level2.evt file, extra rows are filled as -1
| Pixel properties | Quadrant properties | ||||||
|---|---|---|---|---|---|---|---|
| Quadrant | DetID | PixID | Counts | Sigma | Mean | Median | Sigma |
| A | 12 | 3 | 2412148 | 13311.0 | 735 | 718 | 181.2 |
| A | 12 | 194 | 275468 | 1516.61 | 735 | 718 | 181.2 |
| A | 12 | 250 | 271160 | 1492.83 | 735 | 718 | 181.2 |
| B | 10 | 247 | 168047 | 1044.61 | 741 | 714 | 160.2 |
| B | 5 | 185 | 158690 | 986.2 | 741 | 714 | 160.2 |
| B | 8 | 128 | 142699 | 886.37 | 741 | 714 | 160.2 |
| C | 4 | 12 | 6257854 | 35187.52 | 647 | 641 | 177.8 |
| C | 13 | 3 | 376045 | 2111.09 | 647 | 641 | 177.8 |
| C | 3 | 233 | 326145 | 1830.47 | 647 | 641 | 177.8 |
| D | 8 | 176 | 337094 | 1703.5 | 705 | 678 | 197.5 |
| D | 12 | 218 | 275935 | 1393.81 | 705 | 678 | 197.5 |
| D | 7 | 96 | 270225 | 1364.9 | 705 | 678 | 197.5 |
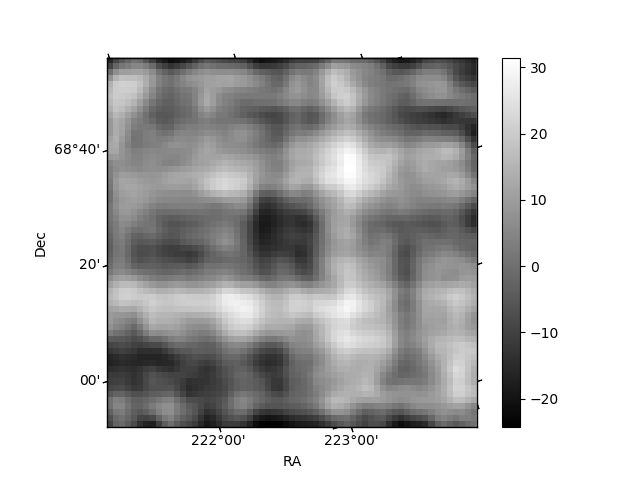
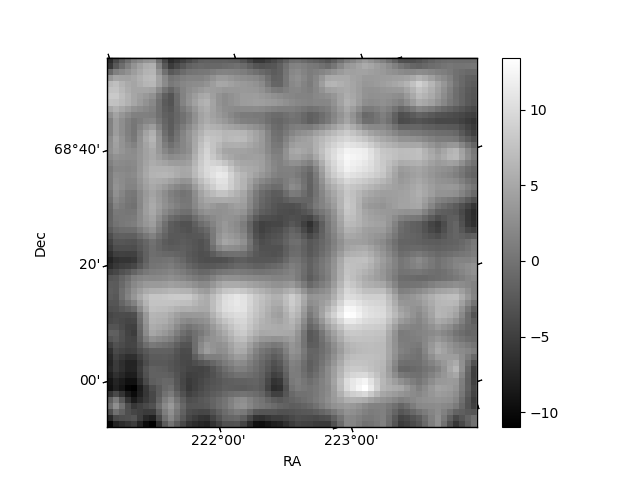
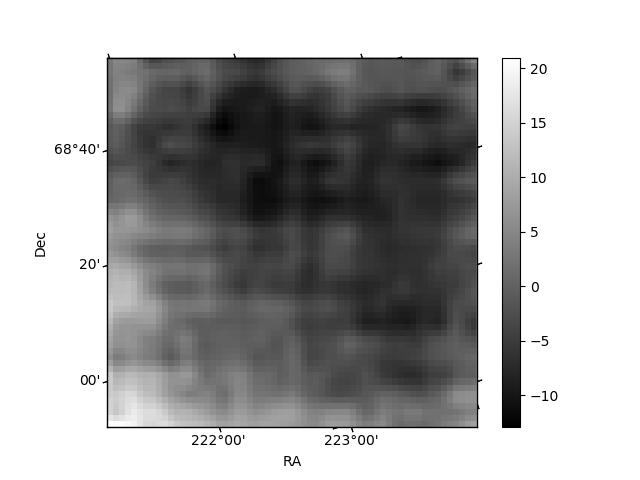
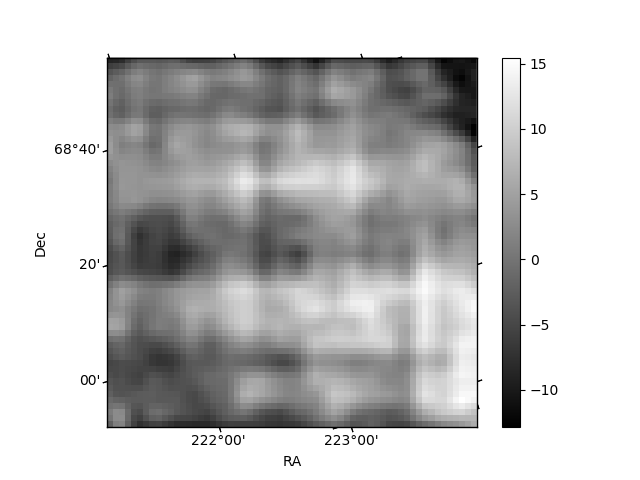
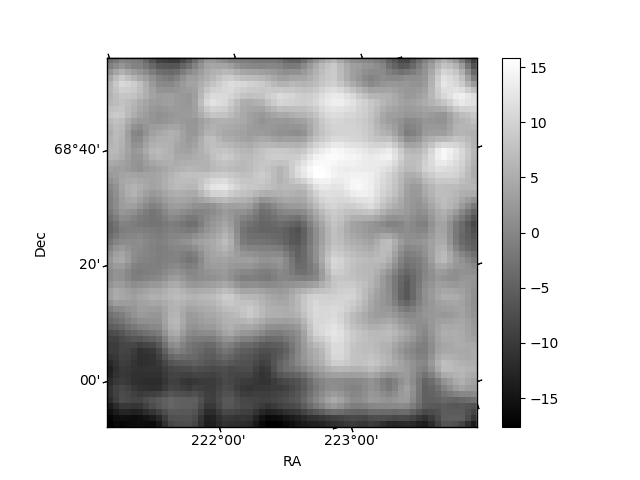
Histogram calculated using DETX and DETY for each event in the final _common_clean file
| Quadrant A | 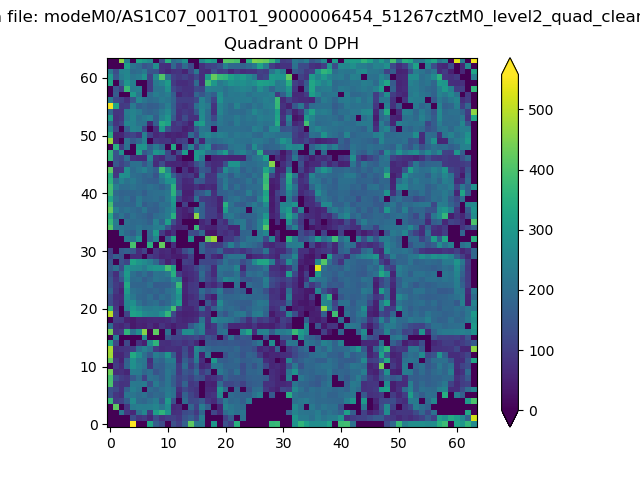 |
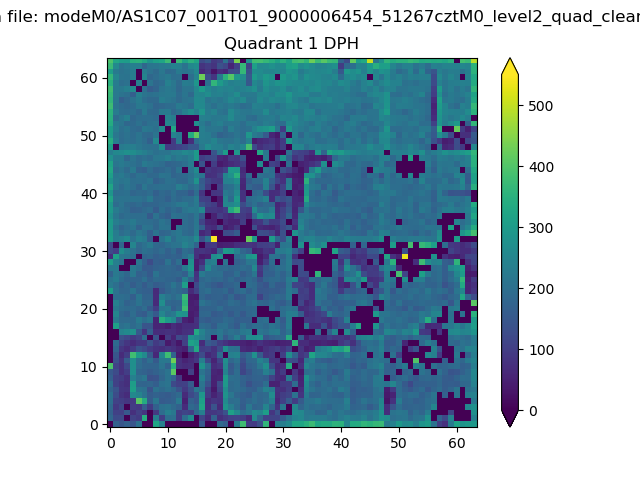 |
Quadrant B |
|---|---|---|---|
| Quadrant D | 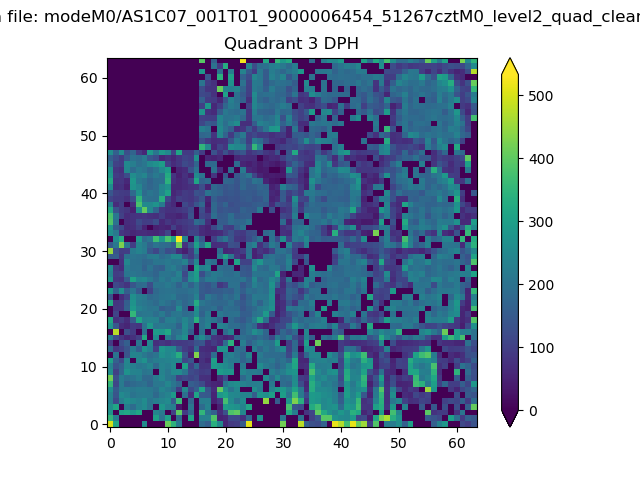 |
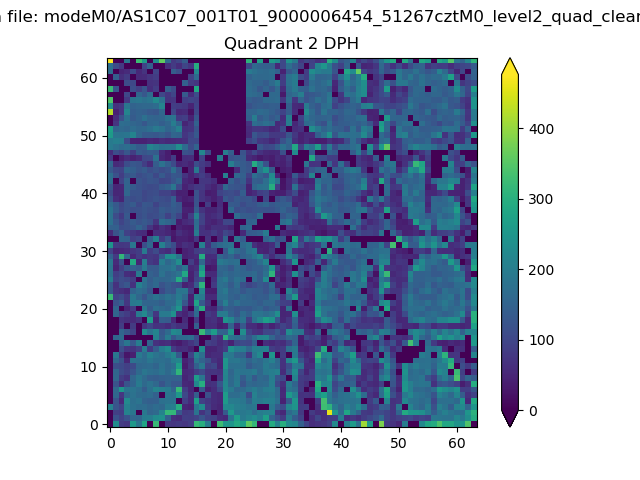 |
Quadrant C |
| Plot type | Count rate plots | Images |
|---|---|---|
| Comparison with Poisson distribution Blue bars denote a histogram of data divided into 1 sec bins. Red curve is a Poisson curve with rate = median count rate of data. |
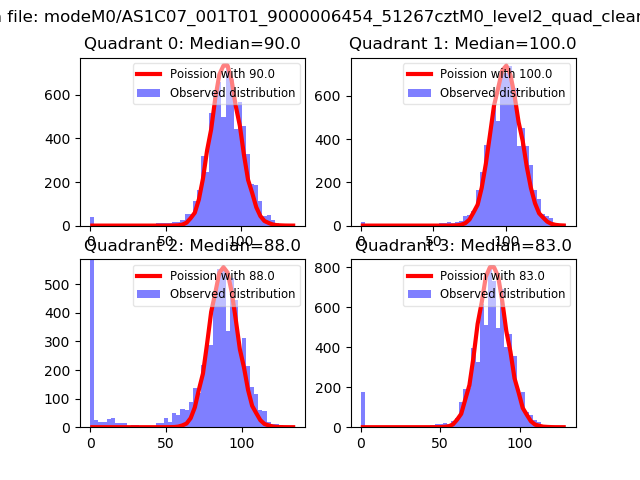 |
 |
| Quadrant-wise count rates Data is divided into 100 sec bins |
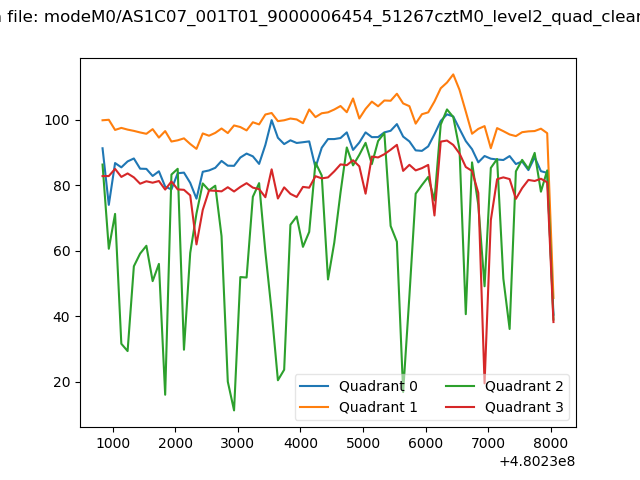 |
|
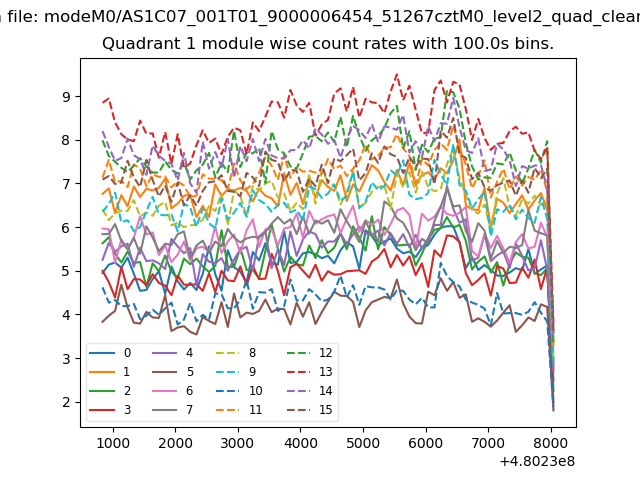
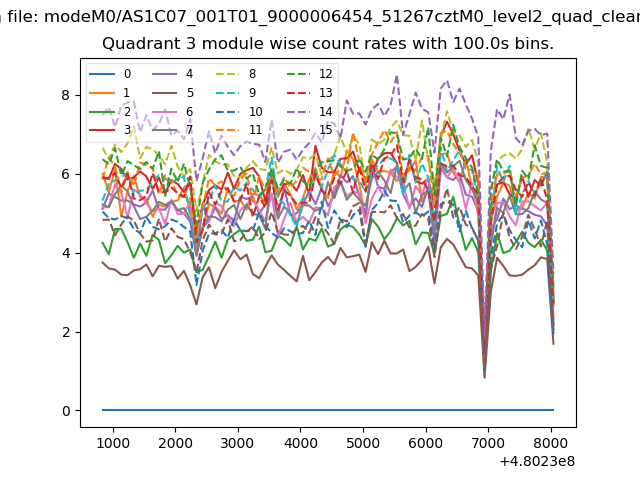
| Module-wise count rates for Quadrant A Data is divided into 100 sec bins |
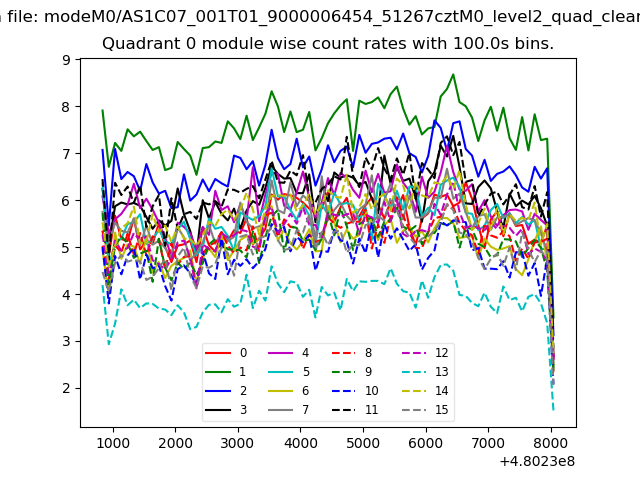 |
 |
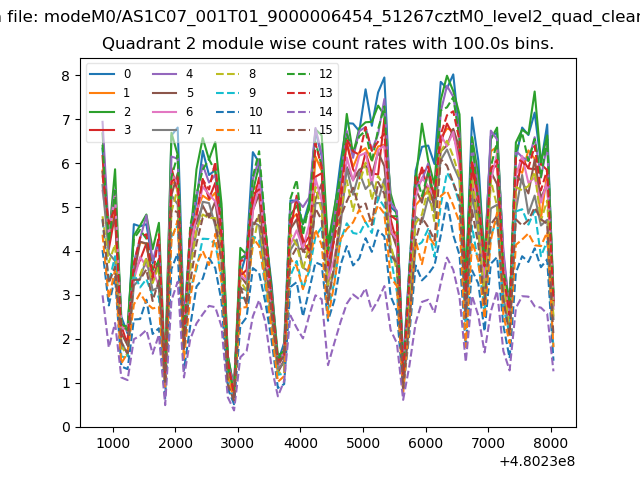
| Module-wise count rates for Quadrant B Data is divided into 100 sec bins |
 |
 |
| Module-wise count rates for Quadrant C Data is divided into 100 sec bins |
 |
 |
| Module-wise count rates for Quadrant D Data is divided into 100 sec bins |
 |
 |
| Parameter | Plot |
|---|---|
| CZT HV Monitor | 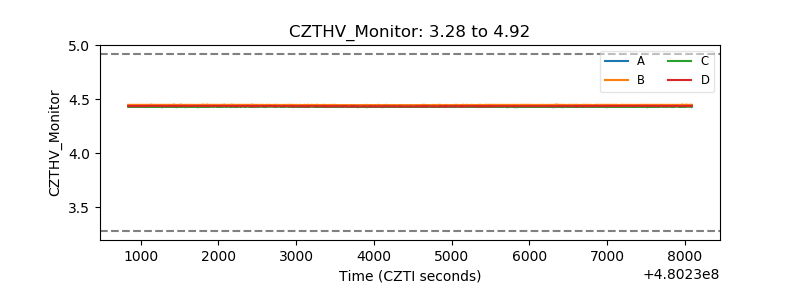 |
| D_VDD | 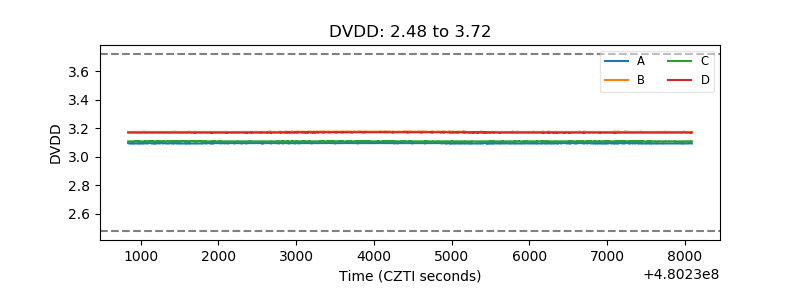 |
| Temperature 1 | 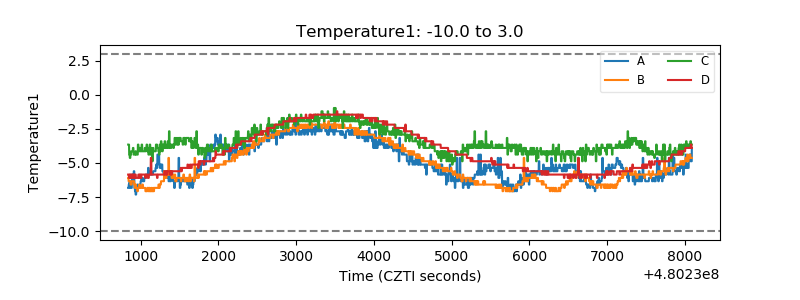 |
| Veto HV Monitor |  |
| Veto LLD | 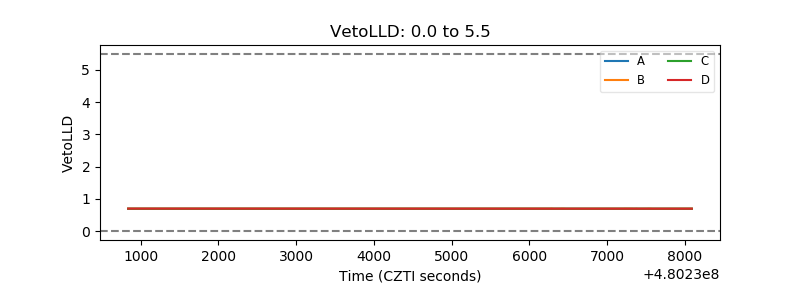 |
| Alpha Counter | 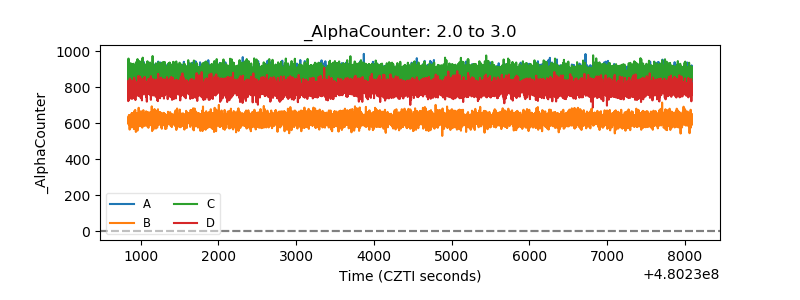 |
| _CPM_Rate | 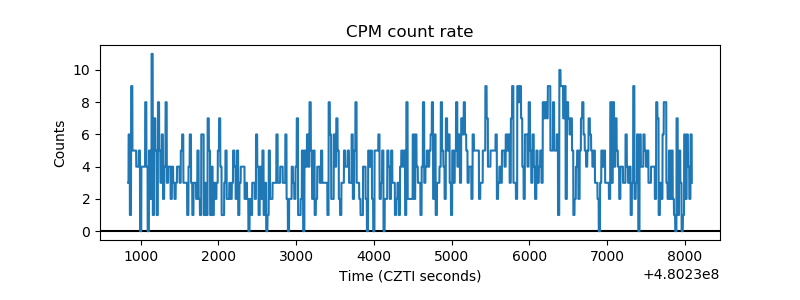 |
| CZT Counter | 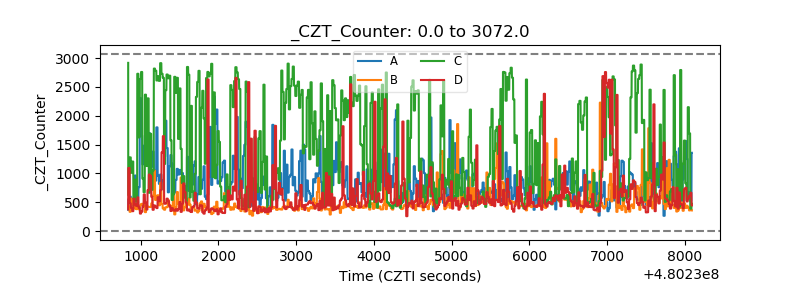 |
| +2.5 Volts monitor | 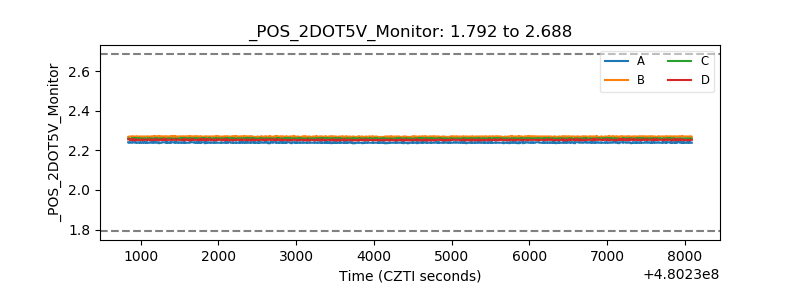 |
| +5 Volts monitor | 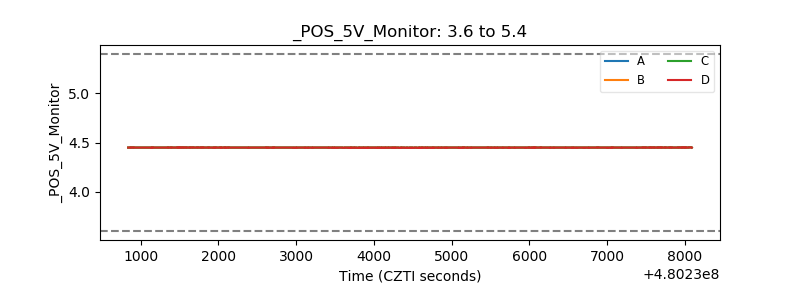 |
| _ROLL_ROT | 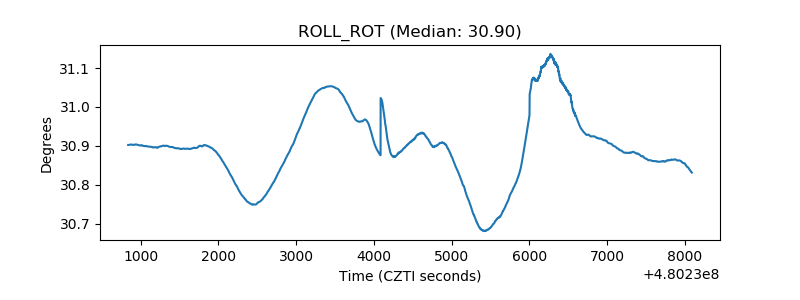 |
| _Roll_DEC | 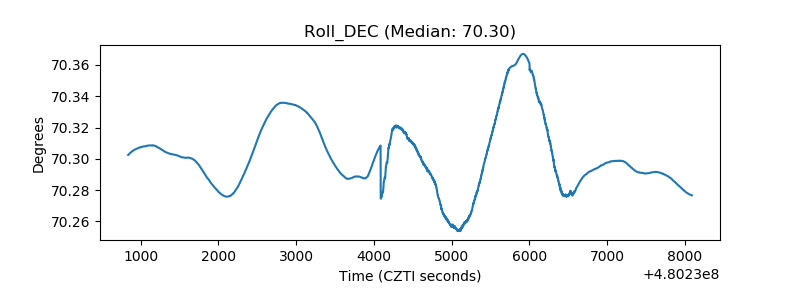 |
| _Roll_RA | 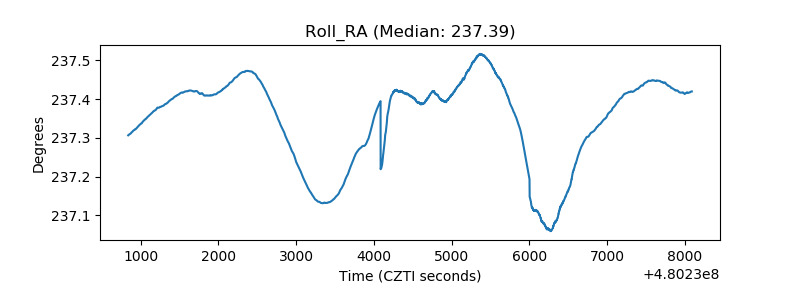 |
| Veto Counter | 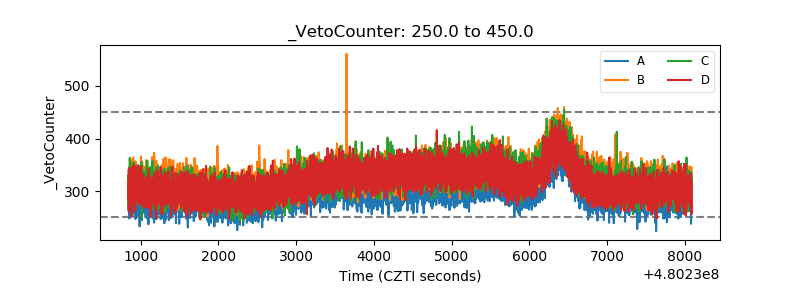 |