| Param | Original file | Final file |
|---|---|---|
| Filename | modeM0/AS1C07_001T01_9000006454_51268cztM0_level2.fits | modeM0/AS1C07_001T01_9000006454_51268cztM0_level2_quad_clean.evt |
| Size (bytes) | 761,987,520 | 98,475,840 |
| Size | 726.7 MB | 93.9 MB |
| Events in quadrant A | 6,304,188 | 668,829 |
| Events in quadrant B | 4,292,560 | 741,506 |
| Events in quadrant C | 11,269,597 | 449,029 |
| Events in quadrant D | 5,759,011 | 599,476 |
| Mode M0 | |||
|---|---|---|---|
| Quadrant | BADHDUFLAG | Total packets | Discarded packets |
| A | 0 | 24031 | 0 |
| B | 0 | 18210 | 0 |
| C | 0 | 38610 | 0 |
| D | 0 | 22364 | 1 |
| Mode SS | |||
|---|---|---|---|
| Quadrant | BADHDUFLAG | Total packets | Discarded packets |
| A | 0 | 150 | 0 |
| B | 0 | 150 | 0 |
| C | 0 | 150 | 0 |
| D | 0 | 150 | 0 |
| Quadrant | Total seconds | Saturated seconds | Saturation percentage |
|---|---|---|---|
| A | 7510 | 214 | 2.849534% |
| B | 7511 | 168 | 2.236719% |
| C | 7511 | 2740 | 36.479830% |
| D | 7510 | 401 | 5.339547% |
Noise dominated data is calculated using 1-second bins in cleaned event files. If a bin has >2000 counts, and if more than 50% of those come from <1% of pixels, then it is considered to be noise-dominated and hence unusable.
| Quadrant | # 1 sec bins | Bins with >0 counts | Bins with >2000 counts | High rate bins dominated by noise | Noise dominated (total time) | Noise dominated (detector-on time) | Marked lightcurve |
|---|---|---|---|---|---|---|---|
| A | 7510 | 7510 | 165 | 165 | 2.20% | 2.20% | 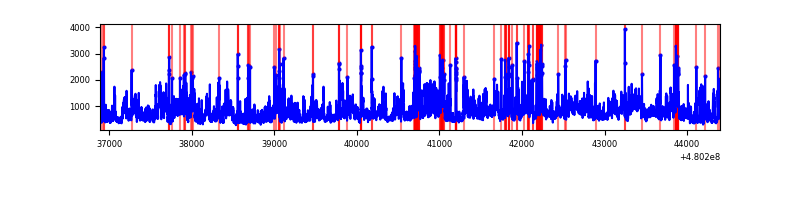 |
| B | 7511 | 7511 | 123 | 123 | 1.64% | 1.64% | 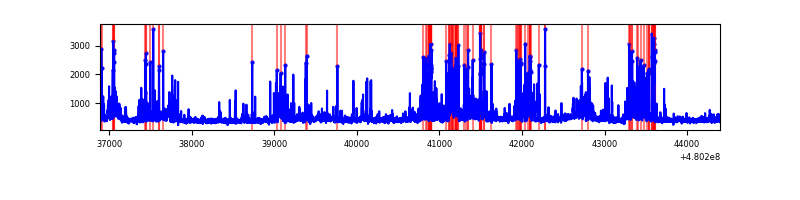 |
| C | 7511 | 7511 | 2633 | 2633 | 35.06% | 35.06% | 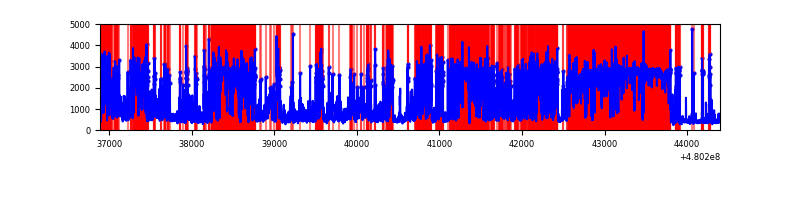 |
| D | 7510 | 7510 | 432 | 432 | 5.75% | 5.75% | 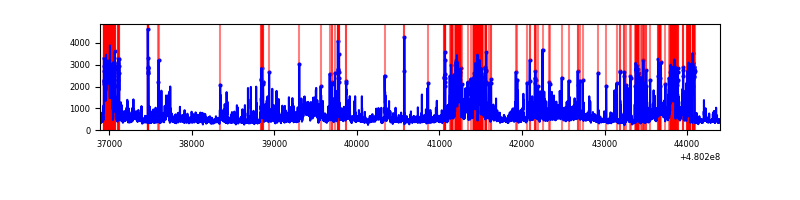 |
Top three noisy pixels from each quadrant. If the there are fewer than three noisy pixels in the level2.evt file, extra rows are filled as -1
| Pixel properties | Quadrant properties | ||||||
|---|---|---|---|---|---|---|---|
| Quadrant | DetID | PixID | Counts | Sigma | Mean | Median | Sigma |
| A | 12 | 3 | 1930006 | 10240.27 | 761 | 742 | 188.4 |
| A | 12 | 250 | 331289 | 1754.5 | 761 | 742 | 188.4 |
| A | 12 | 194 | 224669 | 1188.57 | 761 | 742 | 188.4 |
| B | 5 | 185 | 558695 | 3415.16 | 764 | 737 | 163.4 |
| B | 7 | 252 | 308664 | 1884.77 | 764 | 737 | 163.4 |
| B | 10 | 247 | 117257 | 713.2 | 764 | 737 | 163.4 |
| C | 4 | 12 | 7445193 | 44422.24 | 609 | 606 | 167.6 |
| C | 15 | 147 | 274886 | 1636.64 | 609 | 606 | 167.6 |
| C | 1 | 45 | 242947 | 1446.06 | 609 | 606 | 167.6 |
| D | 8 | 176 | 919236 | 4552.65 | 726 | 699 | 201.8 |
| D | 7 | 60 | 489621 | 2423.3 | 726 | 699 | 201.8 |
| D | 7 | 126 | 320871 | 1586.91 | 726 | 699 | 201.8 |
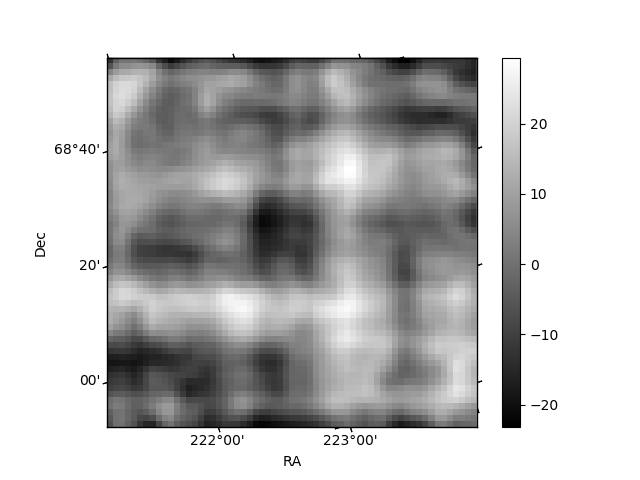
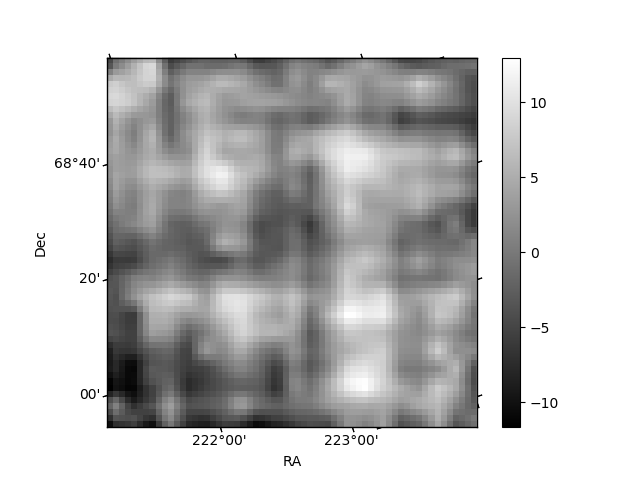
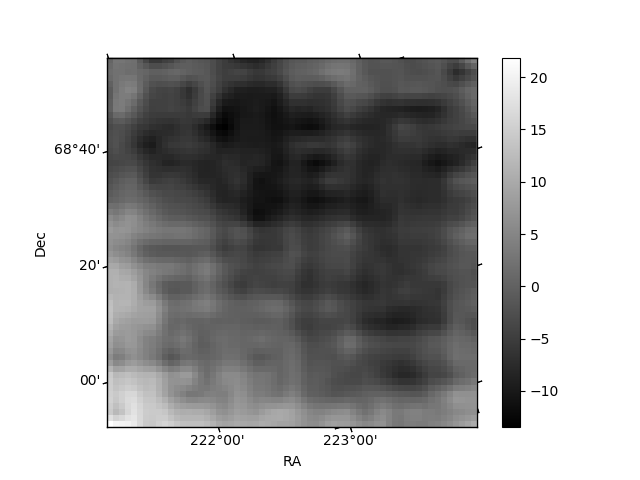
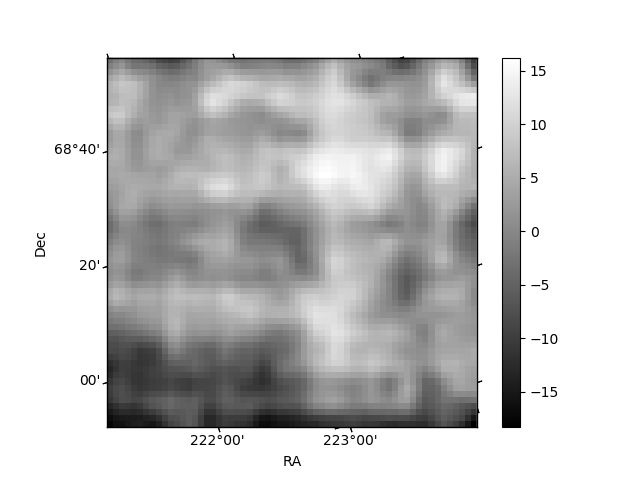
Histogram calculated using DETX and DETY for each event in the final _common_clean file
| Quadrant A | 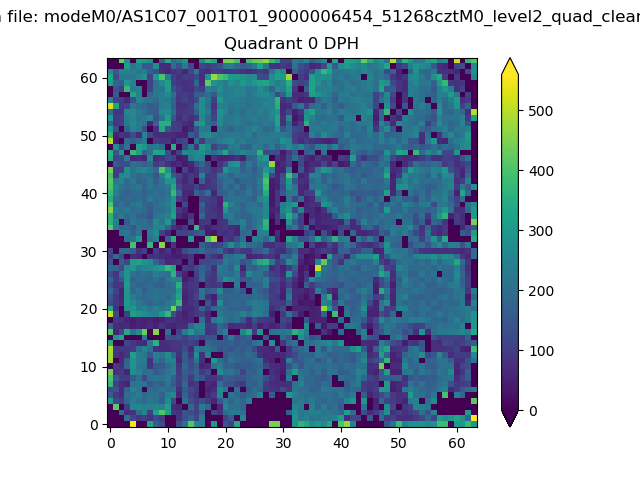 |
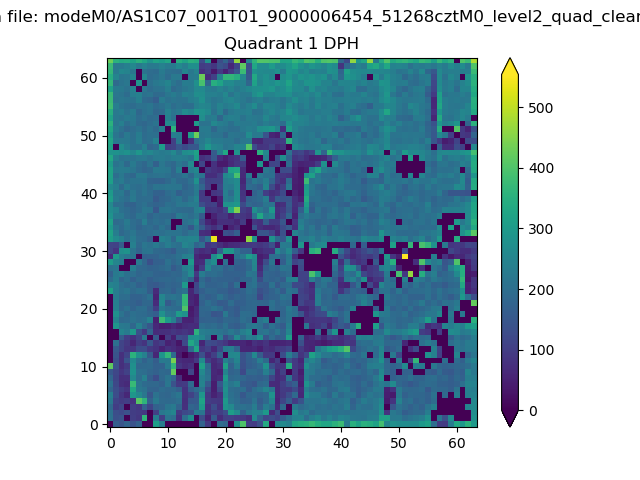 |
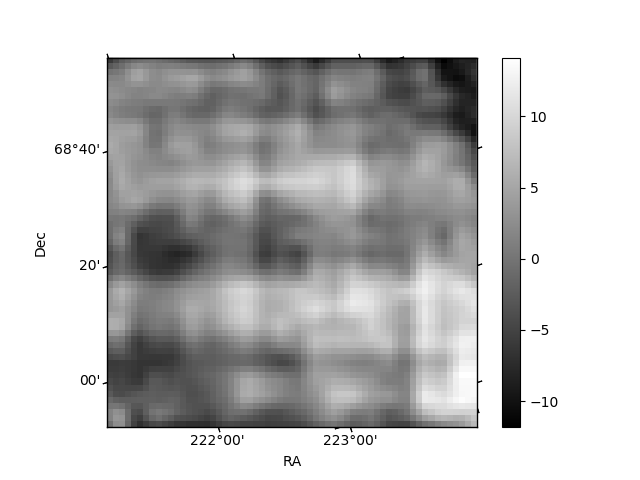
Quadrant B |
|---|---|---|---|
| Quadrant D | 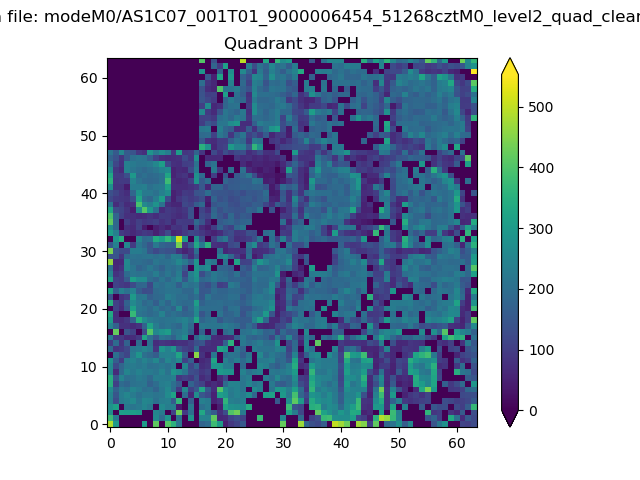 |
 |
Quadrant C |
| Plot type | Count rate plots | Images |
|---|---|---|
| Comparison with Poisson distribution Blue bars denote a histogram of data divided into 1 sec bins. Red curve is a Poisson curve with rate = median count rate of data. |
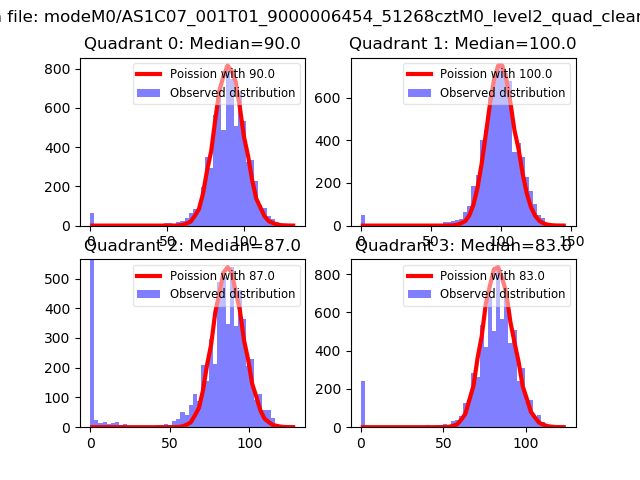 |
 |
| Quadrant-wise count rates Data is divided into 100 sec bins |
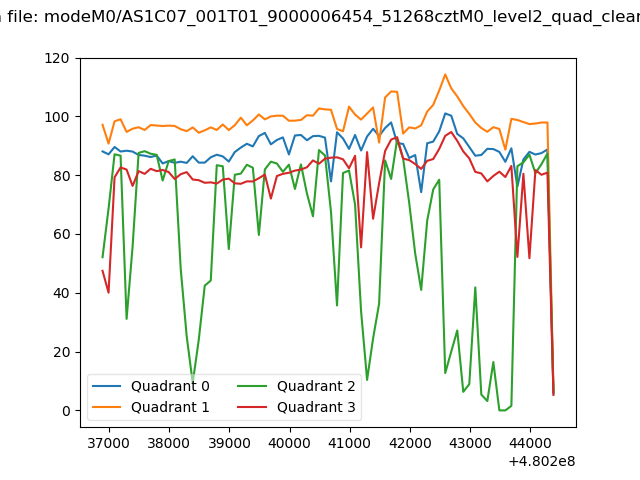 |
|
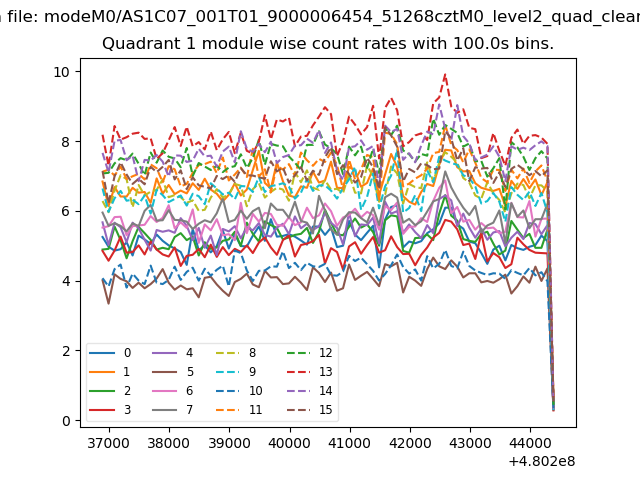
| Module-wise count rates for Quadrant A Data is divided into 100 sec bins |
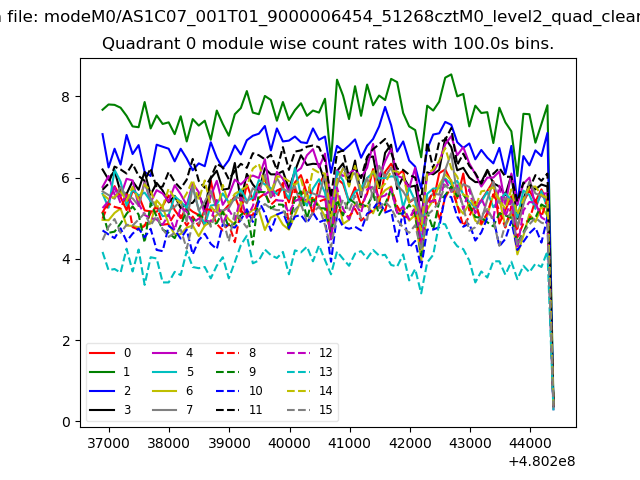 |
 |
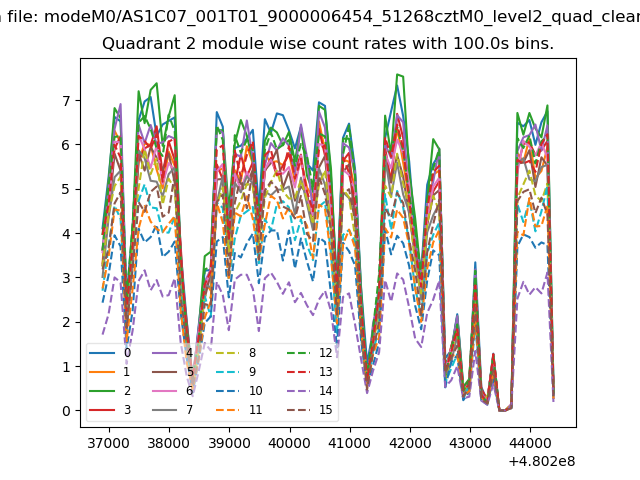
| Module-wise count rates for Quadrant B Data is divided into 100 sec bins |
 |
 |
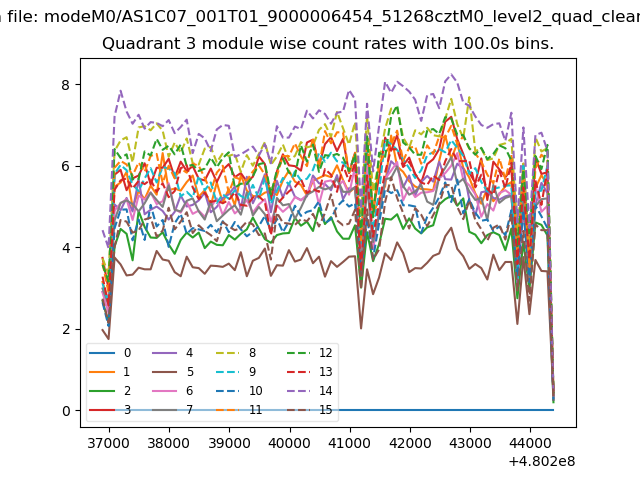
| Module-wise count rates for Quadrant C Data is divided into 100 sec bins |
 |
 |
| Module-wise count rates for Quadrant D Data is divided into 100 sec bins |
 |
 |
| Parameter | Plot |
|---|---|
| CZT HV Monitor | 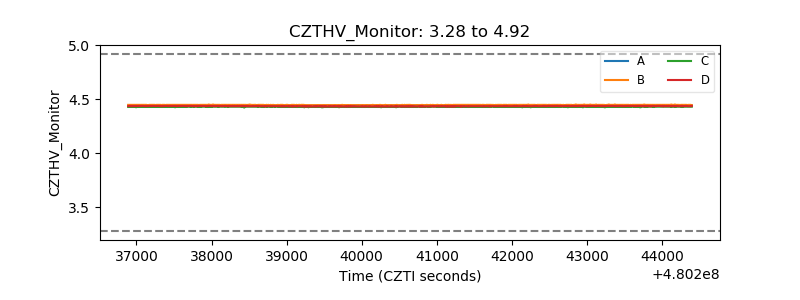 |
| D_VDD | 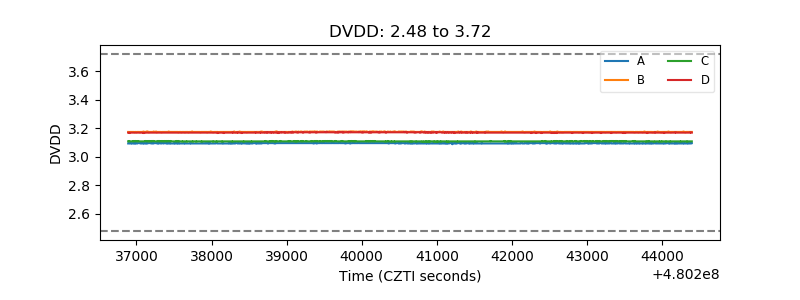 |
| Temperature 1 | 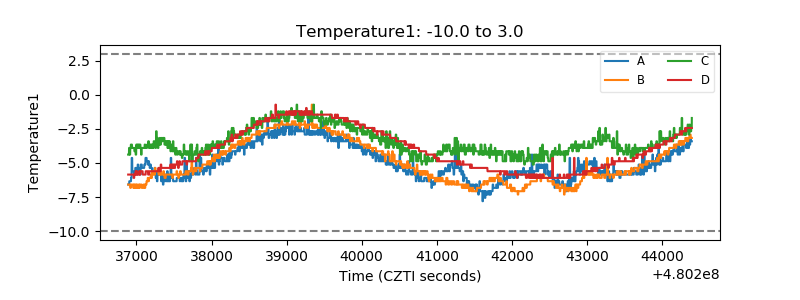 |
| Veto HV Monitor | 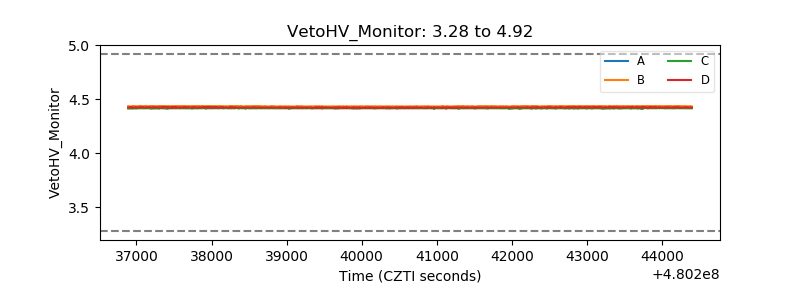 |
| Veto LLD | 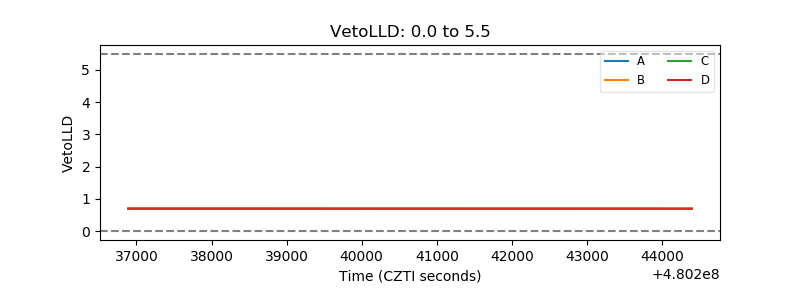 |
| Alpha Counter | 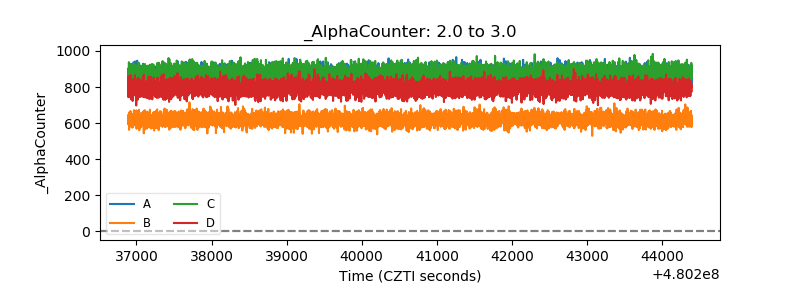 |
| _CPM_Rate | 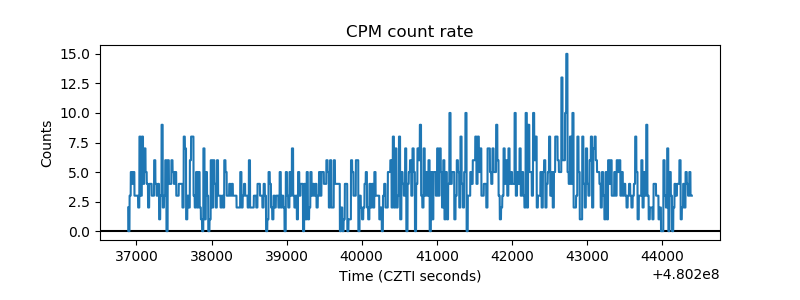 |
| CZT Counter | 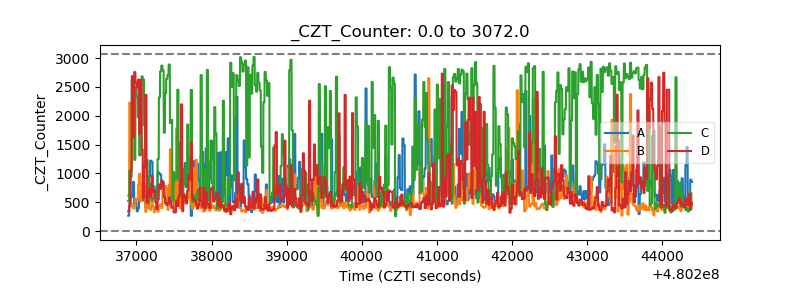 |
| +2.5 Volts monitor | 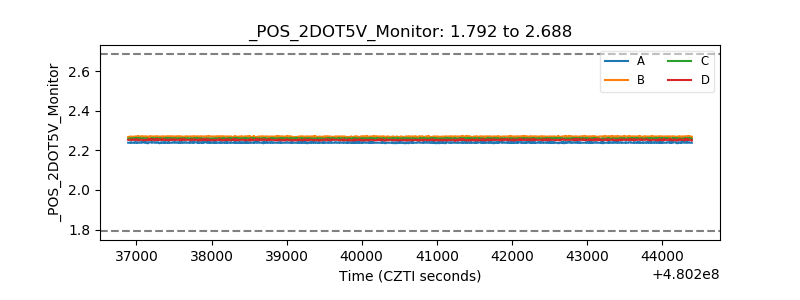 |
| +5 Volts monitor | 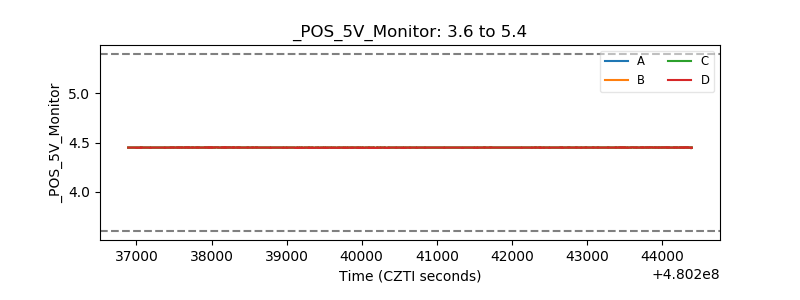 |
| _ROLL_ROT | 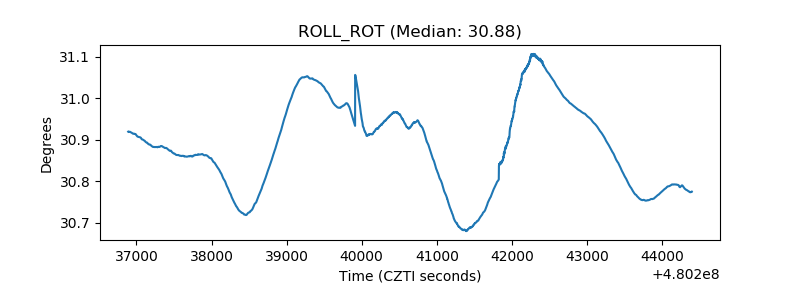 |
| _Roll_DEC | 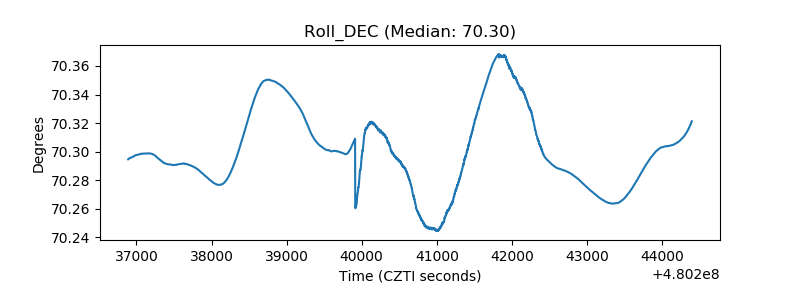 |
| _Roll_RA | 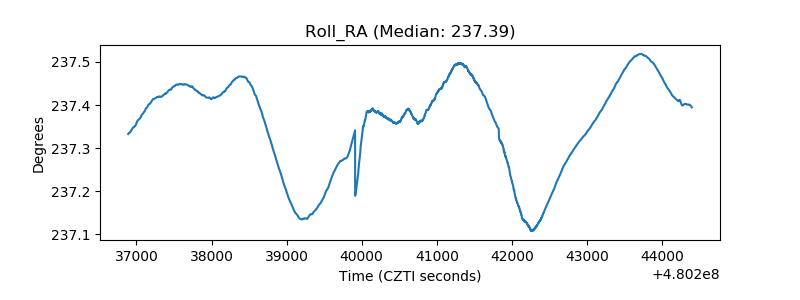 |
| Veto Counter | 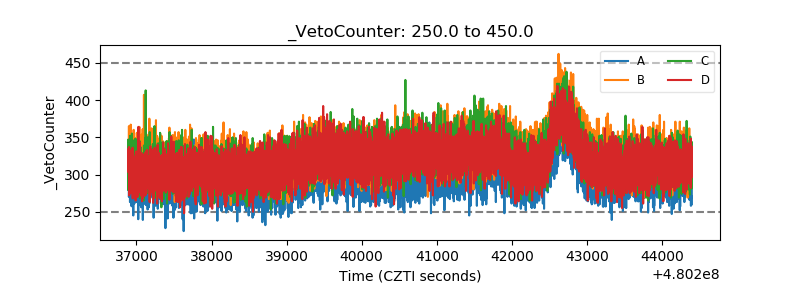 |