| Param | Original file | Final file |
|---|---|---|
| Filename | modeM0/AS1C07_001T01_9000006454_51271cztM0_level2.fits | modeM0/AS1C07_001T01_9000006454_51271cztM0_level2_quad_clean.evt |
| Size (bytes) | 2,130,442,560 | 227,482,560 |
| Size | 2.0 GB | 216.9 MB |
| Events in quadrant A | 16,573,489 | 1,550,608 |
| Events in quadrant B | 10,721,362 | 1,821,166 |
| Events in quadrant C | 30,039,814 | 971,183 |
| Events in quadrant D | 20,081,529 | 1,251,158 |
| Mode M0 | |||
|---|---|---|---|
| Quadrant | BADHDUFLAG | Total packets | Discarded packets |
| A | 0 | 62323 | 2 |
| B | 0 | 45231 | 2 |
| C | 0 | 102198 | 6 |
| D | 0 | 72647 | 2 |
| Mode SS | |||
|---|---|---|---|
| Quadrant | BADHDUFLAG | Total packets | Discarded packets |
| A | 0 | 378 | 0 |
| B | 0 | 378 | 0 |
| C | 0 | 378 | 0 |
| D | 0 | 378 | 0 |
| Mode M9 | |||
|---|---|---|---|
| Quadrant | BADHDUFLAG | Total packets | Discarded packets |
| A | 0 | 10 | 0 |
| B | 0 | 10 | 0 |
| C | 0 | 10 | 0 |
| D | 0 | 10 | 0 |
| Quadrant | Total seconds | Saturated seconds | Saturation percentage |
|---|---|---|---|
| A | 18758 | 1600 | 8.529694% |
| B | 18758 | 685 | 3.651775% |
| C | 18757 | 7930 | 42.277550% |
| D | 18758 | 3640 | 19.405054% |
Noise dominated data is calculated using 1-second bins in cleaned event files. If a bin has >2000 counts, and if more than 50% of those come from <1% of pixels, then it is considered to be noise-dominated and hence unusable.
| Quadrant | # 1 sec bins | Bins with >0 counts | Bins with >2000 counts | High rate bins dominated by noise | Noise dominated (total time) | Noise dominated (detector-on time) | Marked lightcurve |
|---|---|---|---|---|---|---|---|
| A | 19733 | 18760 | 1093 | 1093 | 5.54% | 5.83% | 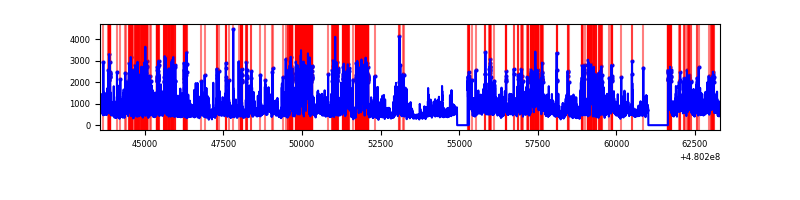 |
| B | 19733 | 18759 | 325 | 325 | 1.65% | 1.73% | 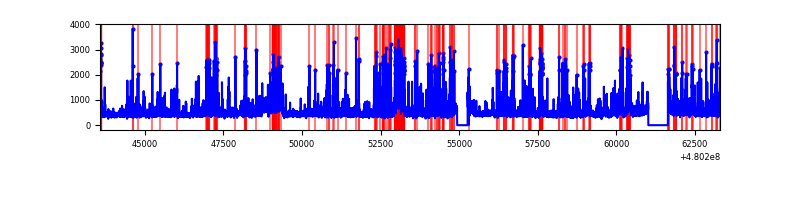 |
| C | 19732 | 18757 | 7694 | 7694 | 38.99% | 41.02% | 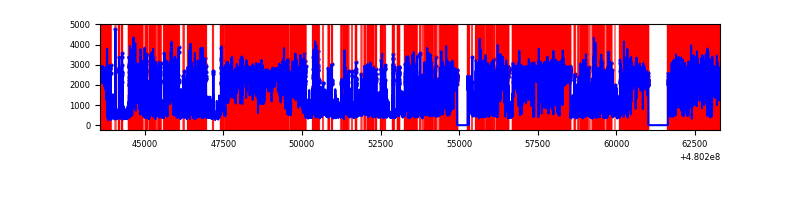 |
| D | 19733 | 18760 | 3442 | 3442 | 17.44% | 18.35% | 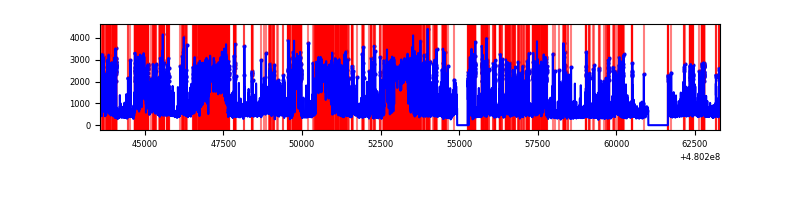 |
Top three noisy pixels from each quadrant. If the there are fewer than three noisy pixels in the level2.evt file, extra rows are filled as -1
| Pixel properties | Quadrant properties | ||||||
|---|---|---|---|---|---|---|---|
| Quadrant | DetID | PixID | Counts | Sigma | Mean | Median | Sigma |
| A | 12 | 3 | 3478099 | 7331.1 | 1920 | 1870 | 474.2 |
| A | 12 | 250 | 3087221 | 6506.77 | 1920 | 1870 | 474.2 |
| A | 4 | 249 | 473384 | 994.39 | 1920 | 1870 | 474.2 |
| B | 5 | 185 | 1355994 | 3241.23 | 1951 | 1880 | 417.8 |
| B | 10 | 247 | 320397 | 762.41 | 1951 | 1880 | 417.8 |
| B | 8 | 234 | 279615 | 664.79 | 1951 | 1880 | 417.8 |
| C | 4 | 12 | 14477212 | 34867.09 | 1477 | 1463 | 415.2 |
| C | 10 | 171 | 7582999 | 18261.31 | 1477 | 1463 | 415.2 |
| C | 4 | 13 | 665687 | 1599.89 | 1477 | 1463 | 415.2 |
| D | 7 | 60 | 4702665 | 9692.66 | 1753 | 1693 | 485.0 |
| D | 11 | 245 | 1764097 | 3633.8 | 1753 | 1693 | 485.0 |
| D | 7 | 126 | 1247912 | 2569.51 | 1753 | 1693 | 485.0 |
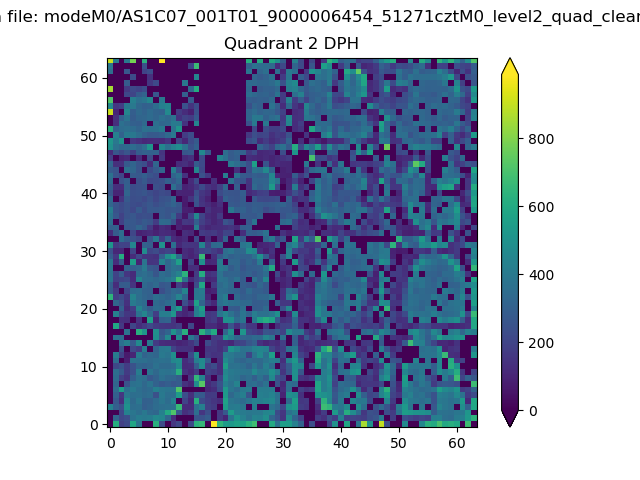
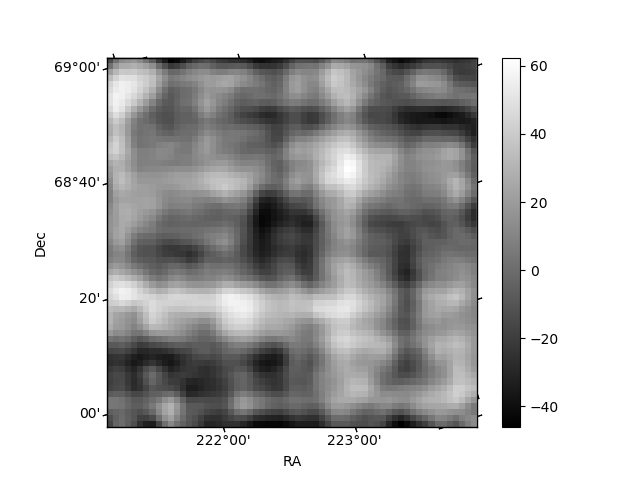
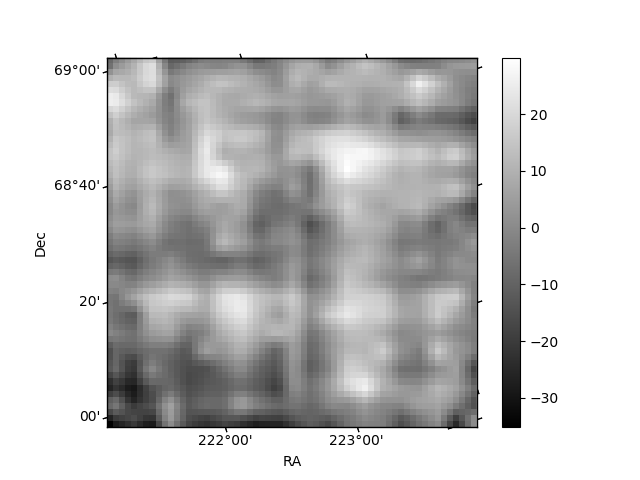
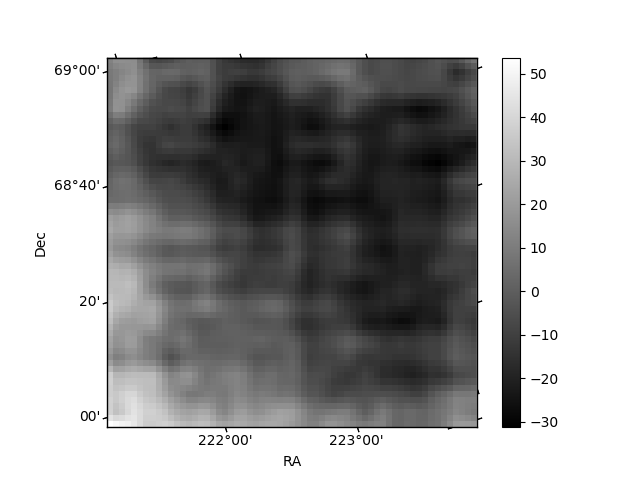
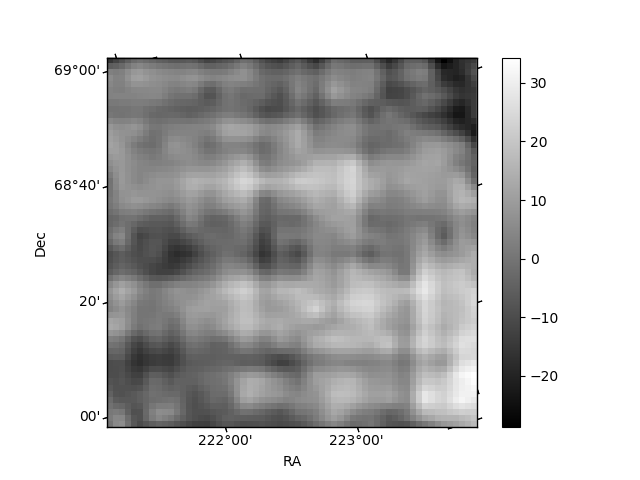
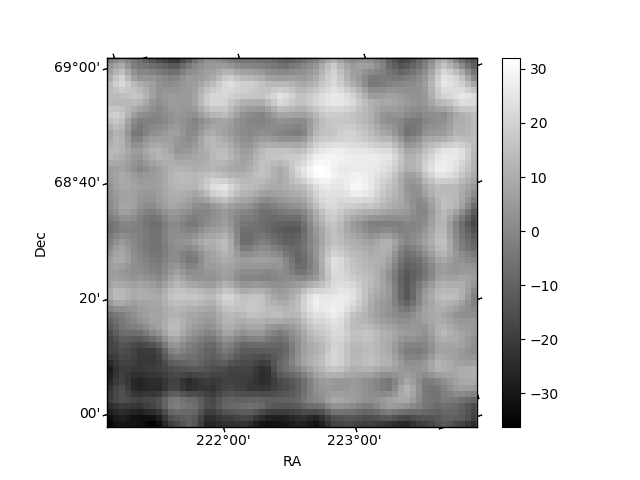
Histogram calculated using DETX and DETY for each event in the final _common_clean file
| Quadrant A | 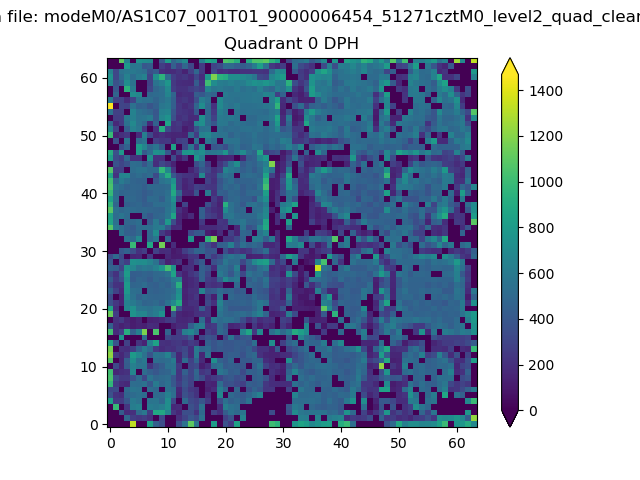 |
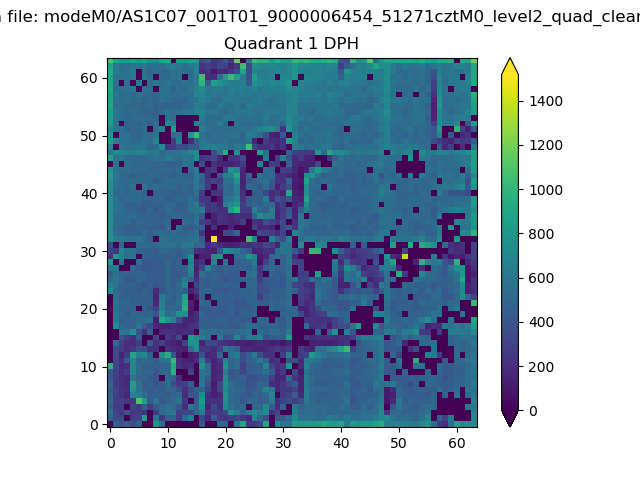 |
Quadrant B |
|---|---|---|---|
| Quadrant D | 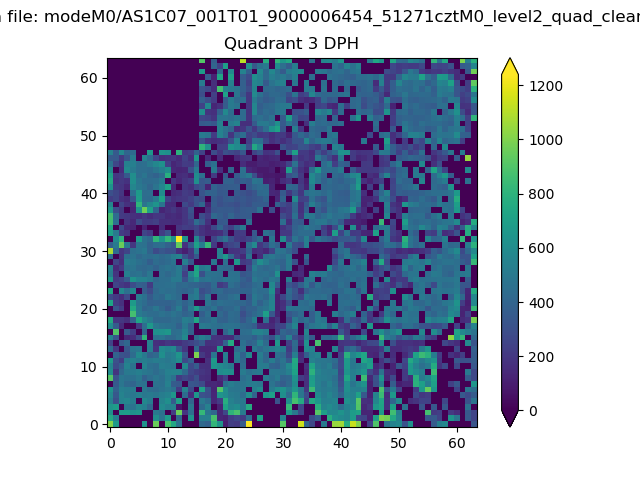 |
 |
Quadrant C |
| Plot type | Count rate plots | Images |
|---|---|---|
| Comparison with Poisson distribution Blue bars denote a histogram of data divided into 1 sec bins. Red curve is a Poisson curve with rate = median count rate of data. |
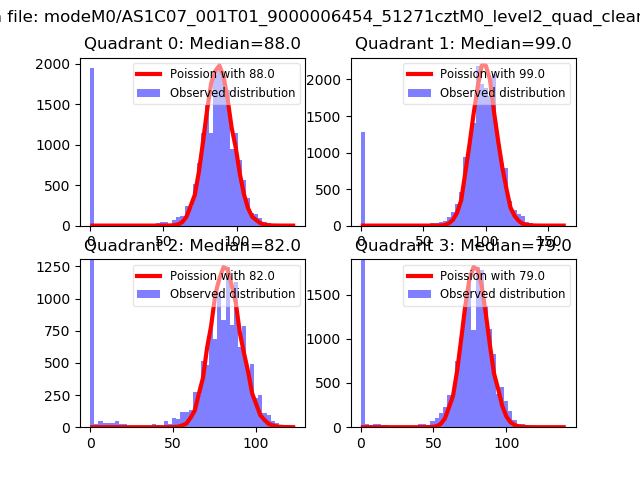 |
 |
| Quadrant-wise count rates Data is divided into 100 sec bins |
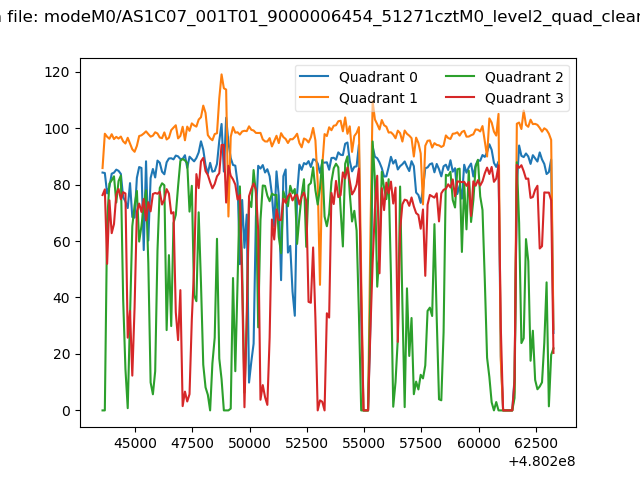 |
|
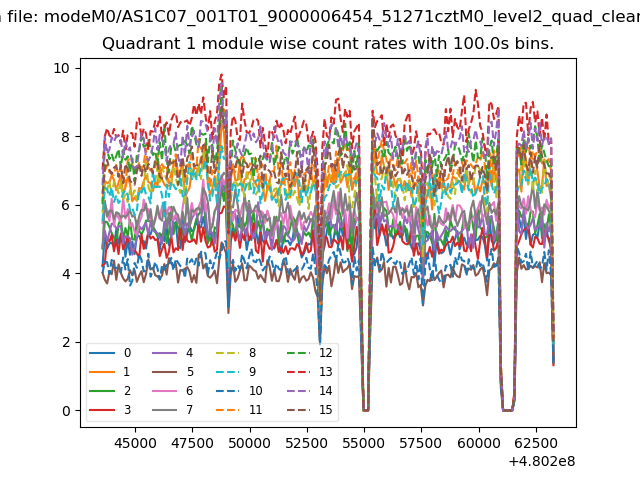
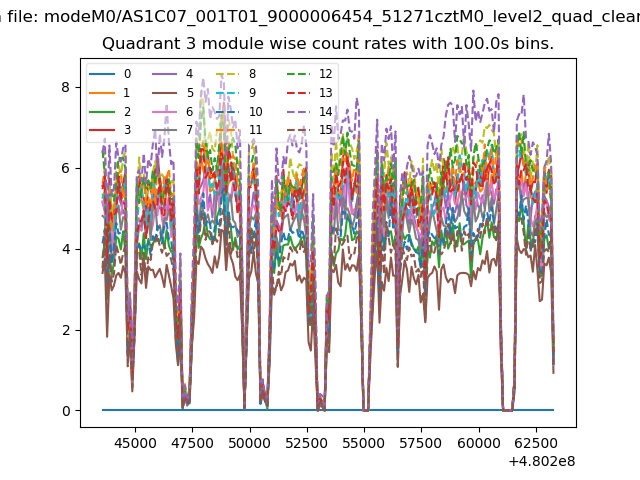
| Module-wise count rates for Quadrant A Data is divided into 100 sec bins |
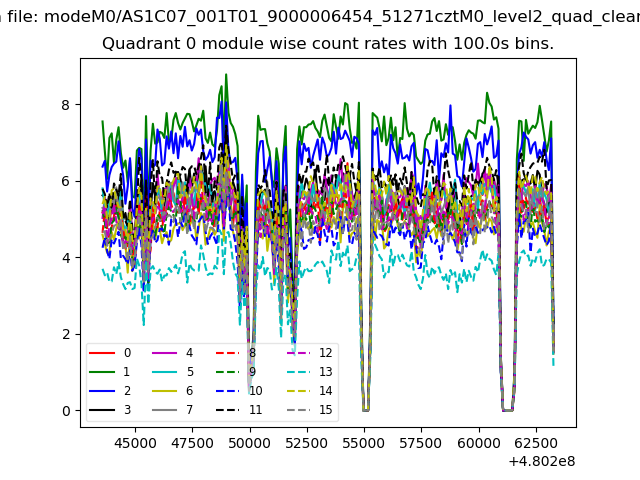 |
 |
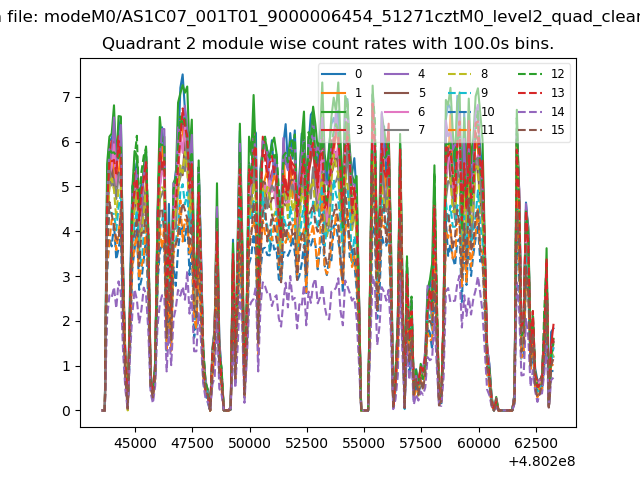
| Module-wise count rates for Quadrant B Data is divided into 100 sec bins |
 |
 |
| Module-wise count rates for Quadrant C Data is divided into 100 sec bins |
 |
 |
| Module-wise count rates for Quadrant D Data is divided into 100 sec bins |
 |
 |
| Parameter | Plot |
|---|---|
| CZT HV Monitor | 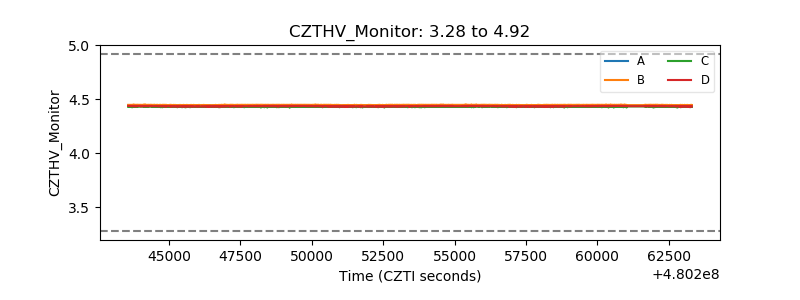 |
| D_VDD | 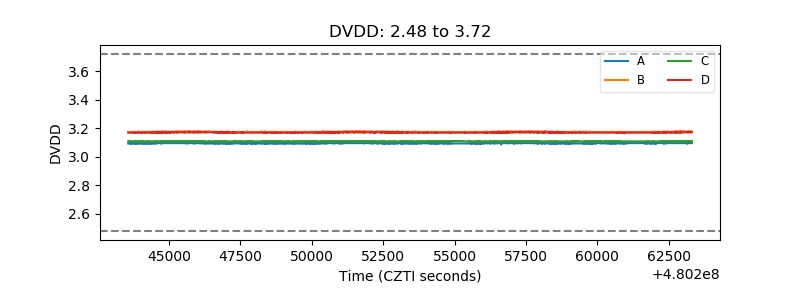 |
| Temperature 1 | 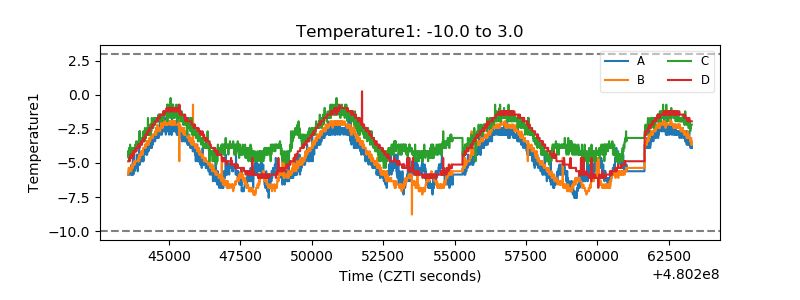 |
| Veto HV Monitor | 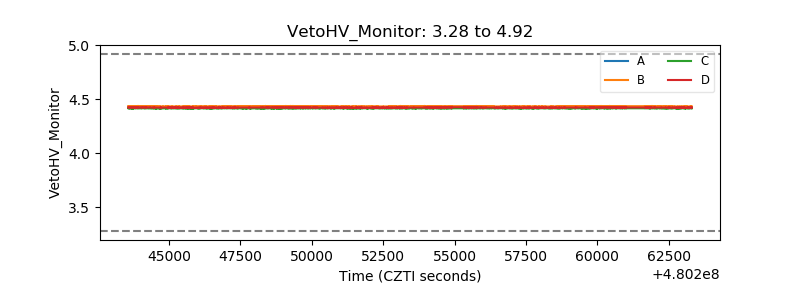 |
| Veto LLD | 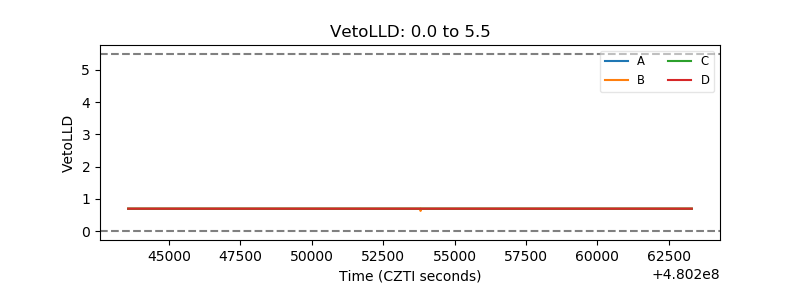 |
| Alpha Counter | 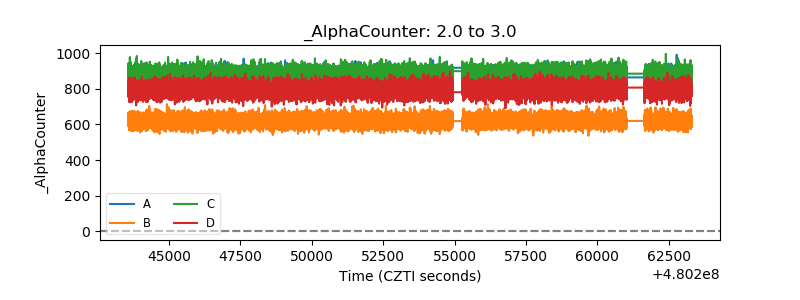 |
| _CPM_Rate | 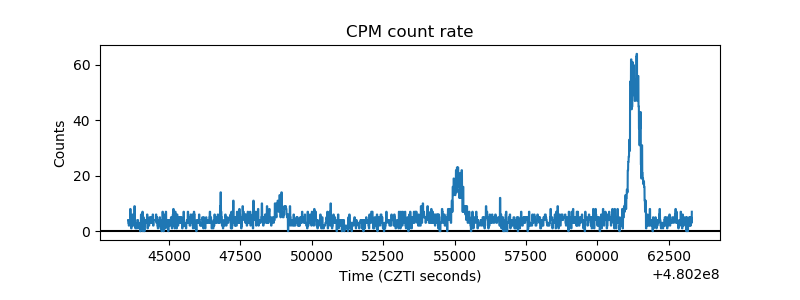 |
| CZT Counter | 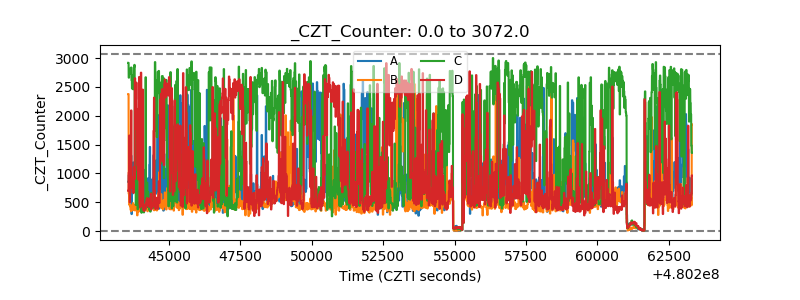 |
| +2.5 Volts monitor | 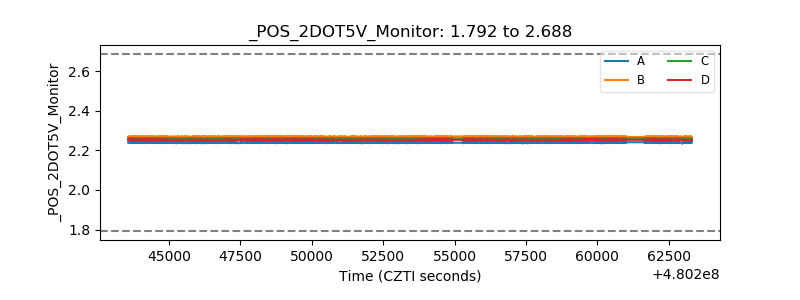 |
| +5 Volts monitor | 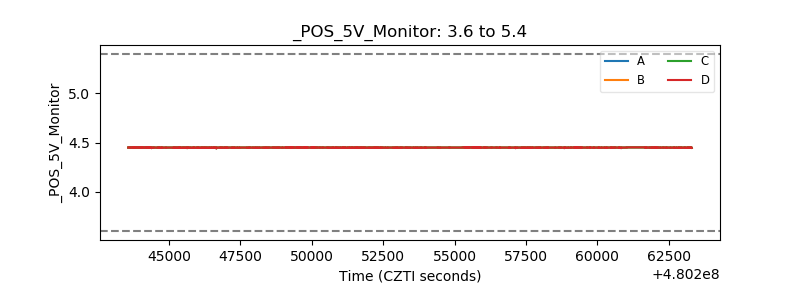 |
| _ROLL_ROT | 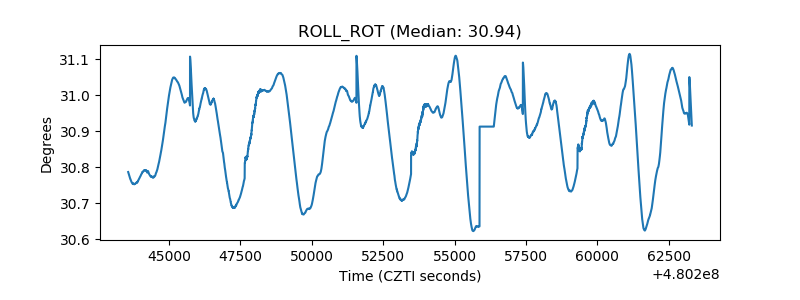 |
| _Roll_DEC | 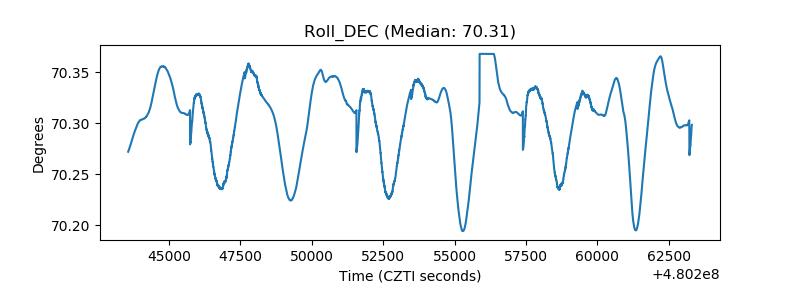 |
| _Roll_RA | 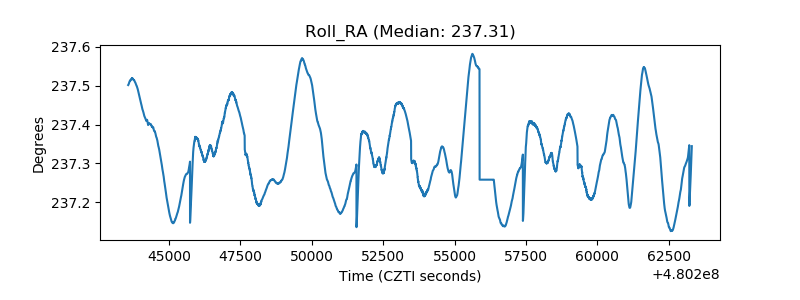 |
| Veto Counter | 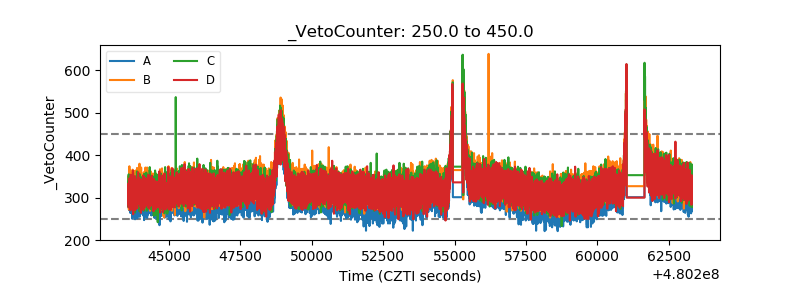 |