| Param | Original file | Final file |
|---|---|---|
| Filename | modeM0/AS1C07_001T01_9000006454_51272cztM0_level2.fits | modeM0/AS1C07_001T01_9000006454_51272cztM0_level2_quad_clean.evt |
| Size (bytes) | 855,743,040 | 82,039,680 |
| Size | 816.1 MB | 78.2 MB |
| Events in quadrant A | 7,014,357 | 568,957 |
| Events in quadrant B | 3,903,028 | 659,368 |
| Events in quadrant C | 12,973,551 | 303,768 |
| Events in quadrant D | 7,271,502 | 487,443 |
| Mode M0 | |||
|---|---|---|---|
| Quadrant | BADHDUFLAG | Total packets | Discarded packets |
| A | 0 | 25520 | 5 |
| B | 0 | 16316 | 1 |
| C | 0 | 43141 | 1 |
| D | 0 | 26144 | 1 |
| Mode SS | |||
|---|---|---|---|
| Quadrant | BADHDUFLAG | Total packets | Discarded packets |
| A | 0 | 134 | 0 |
| B | 0 | 134 | 0 |
| C | 0 | 134 | 0 |
| D | 0 | 134 | 0 |
| Mode M9 | |||
|---|---|---|---|
| Quadrant | BADHDUFLAG | Total packets | Discarded packets |
| A | 0 | 9 | 0 |
| B | 0 | 9 | 0 |
| C | 0 | 9 | 0 |
| D | 0 | 9 | 0 |
| Quadrant | Total seconds | Saturated seconds | Saturation percentage |
|---|---|---|---|
| A | 6659 | 582 | 8.740051% |
| B | 6660 | 181 | 2.717718% |
| C | 6660 | 3679 | 55.240240% |
| D | 6660 | 1051 | 15.780781% |
Noise dominated data is calculated using 1-second bins in cleaned event files. If a bin has >2000 counts, and if more than 50% of those come from <1% of pixels, then it is considered to be noise-dominated and hence unusable.
| Quadrant | # 1 sec bins | Bins with >0 counts | Bins with >2000 counts | High rate bins dominated by noise | Noise dominated (total time) | Noise dominated (detector-on time) | Marked lightcurve |
|---|---|---|---|---|---|---|---|
| A | 7504 | 6659 | 365 | 365 | 4.86% | 5.48% | 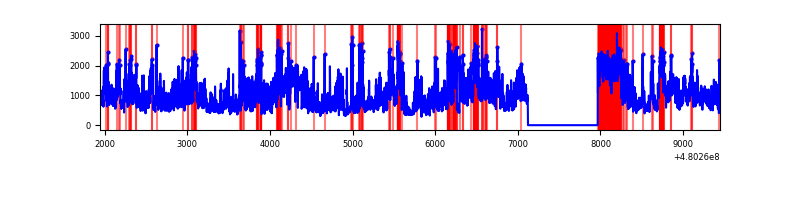 |
| B | 7505 | 6660 | 96 | 96 | 1.28% | 1.44% | 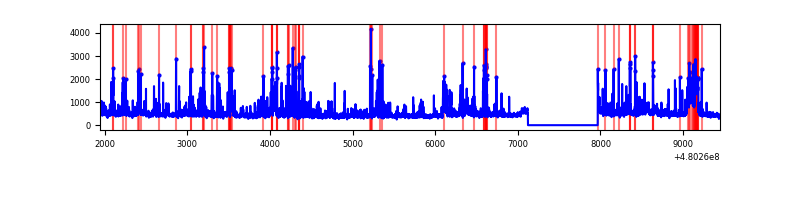 |
| C | 7504 | 6659 | 3544 | 3544 | 47.23% | 53.22% | 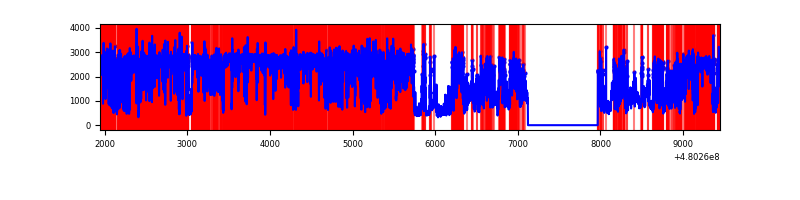 |
| D | 7505 | 6660 | 1051 | 1051 | 14.00% | 15.78% | 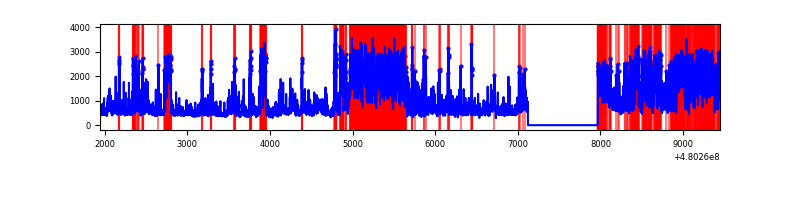 |
Top three noisy pixels from each quadrant. If the there are fewer than three noisy pixels in the level2.evt file, extra rows are filled as -1
| Pixel properties | Quadrant properties | ||||||
|---|---|---|---|---|---|---|---|
| Quadrant | DetID | PixID | Counts | Sigma | Mean | Median | Sigma |
| A | 12 | 3 | 2098849 | 12442.96 | 684 | 666 | 168.6 |
| A | 12 | 80 | 750700 | 4447.96 | 684 | 666 | 168.6 |
| A | 12 | 250 | 617393 | 3657.41 | 684 | 666 | 168.6 |
| B | 0 | 172 | 346653 | 2361.86 | 690 | 667 | 146.5 |
| B | 5 | 185 | 183790 | 1250.08 | 690 | 667 | 146.5 |
| B | 10 | 247 | 145626 | 989.56 | 690 | 667 | 146.5 |
| C | 4 | 12 | 7907104 | 57132.72 | 503 | 499 | 138.4 |
| C | 10 | 171 | 2788759 | 20147.82 | 503 | 499 | 138.4 |
| C | 13 | 3 | 75099 | 539.06 | 503 | 499 | 138.4 |
| D | 8 | 176 | 3179484 | 17898.88 | 643 | 620 | 177.6 |
| D | 2 | 216 | 431581 | 2426.56 | 643 | 620 | 177.6 |
| D | 6 | 42 | 312586 | 1756.55 | 643 | 620 | 177.6 |
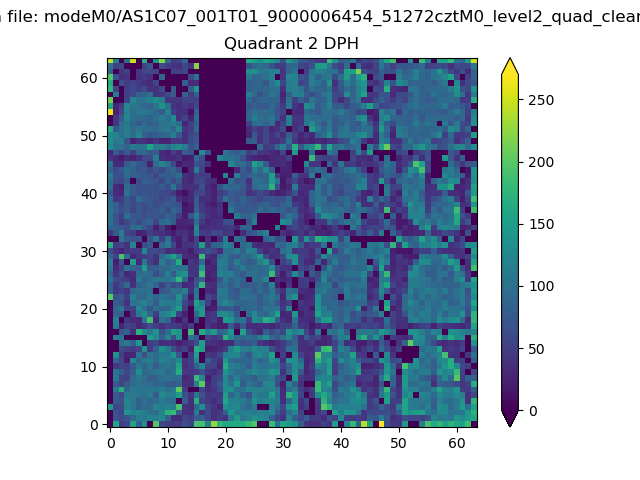
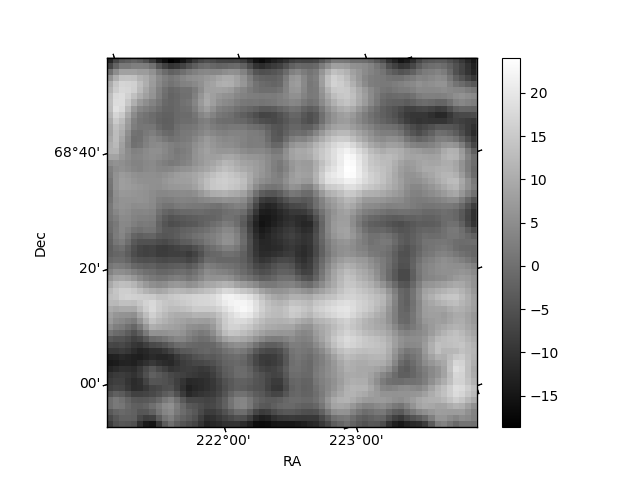
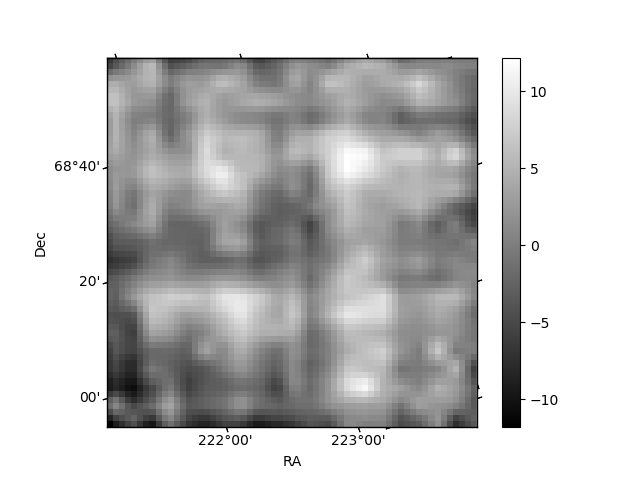
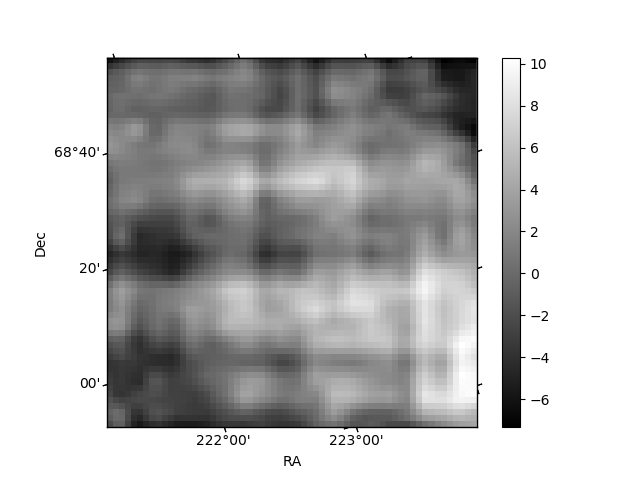
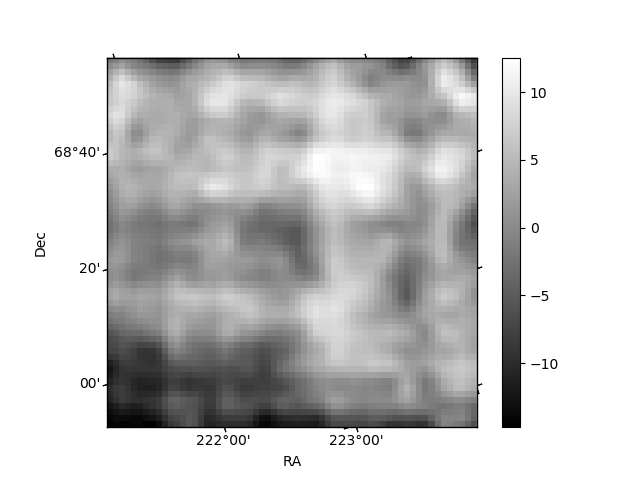
Histogram calculated using DETX and DETY for each event in the final _common_clean file
| Quadrant A | 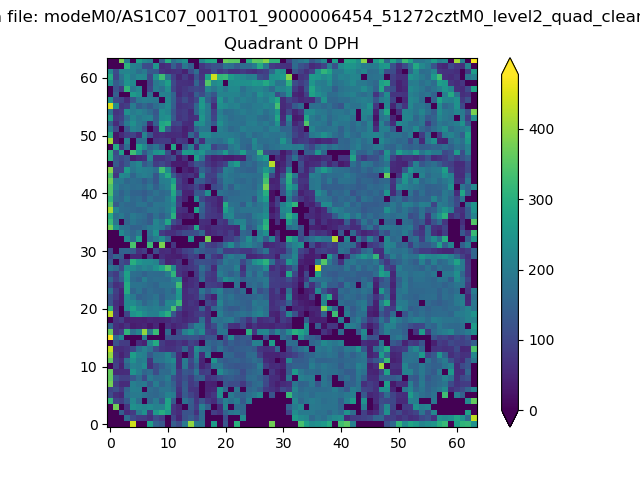 |
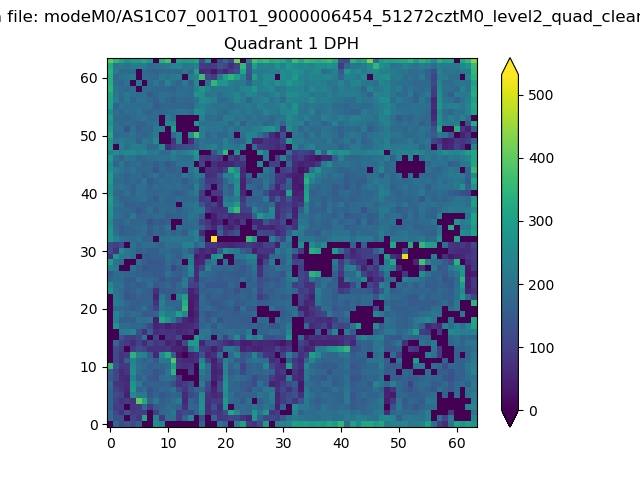 |
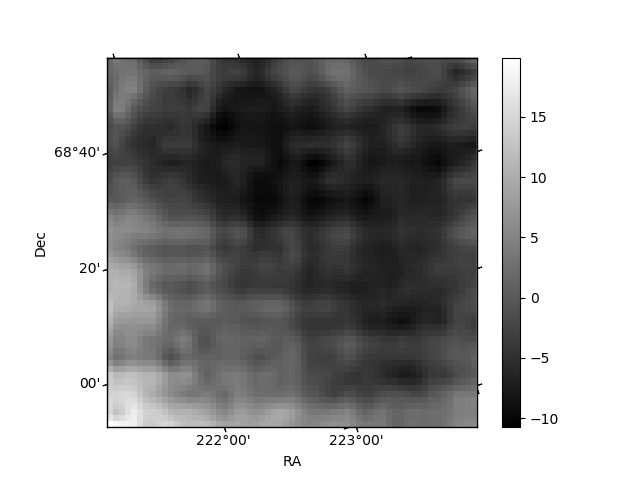
Quadrant B |
|---|---|---|---|
| Quadrant D | 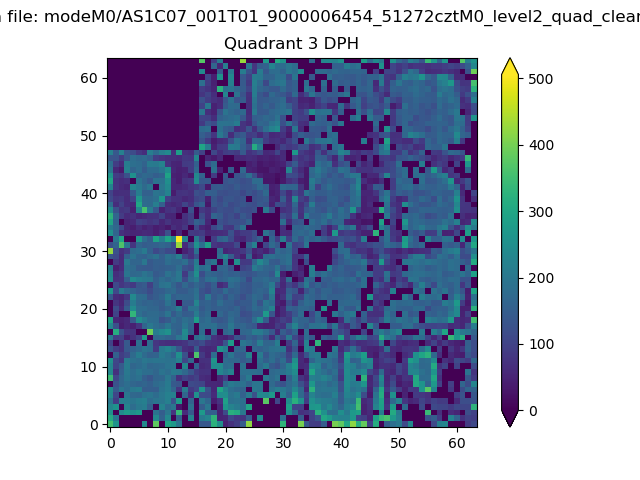 |
 |
Quadrant C |
| Plot type | Count rate plots | Images |
|---|---|---|
| Comparison with Poisson distribution Blue bars denote a histogram of data divided into 1 sec bins. Red curve is a Poisson curve with rate = median count rate of data. |
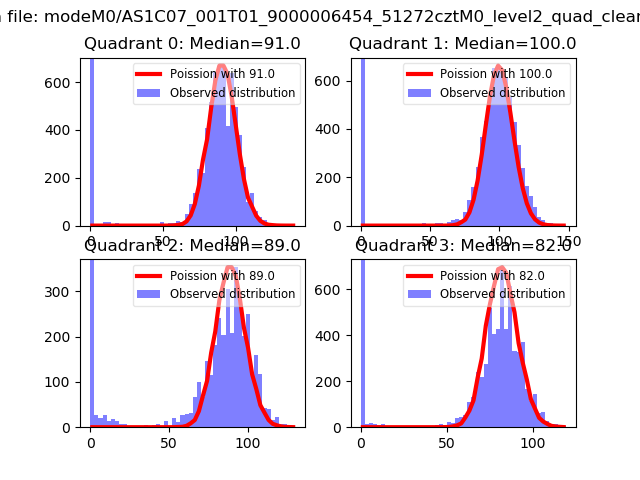 |
 |
| Quadrant-wise count rates Data is divided into 100 sec bins |
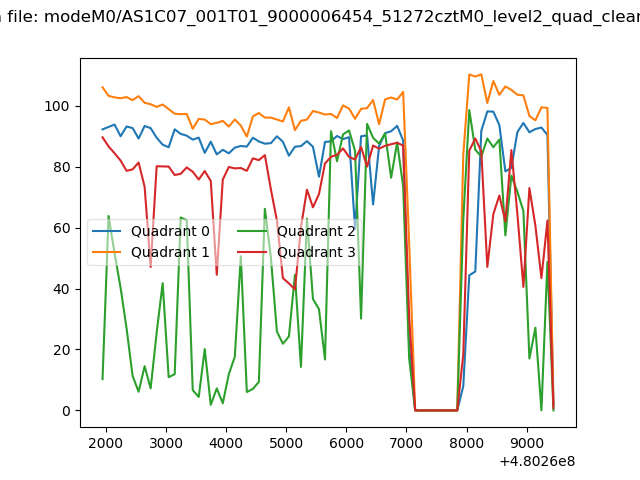 |
|
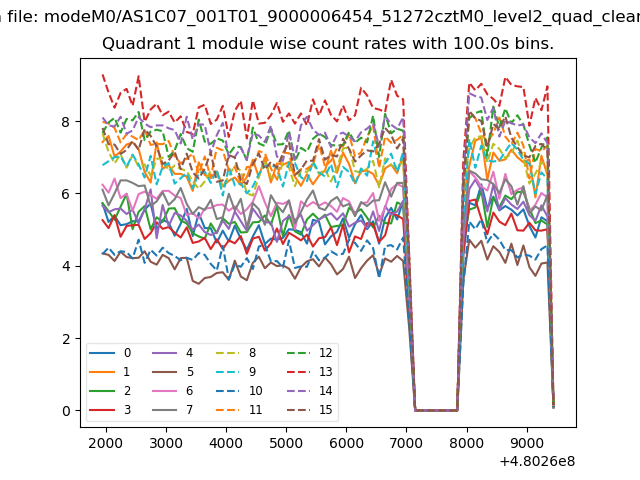
| Module-wise count rates for Quadrant A Data is divided into 100 sec bins |
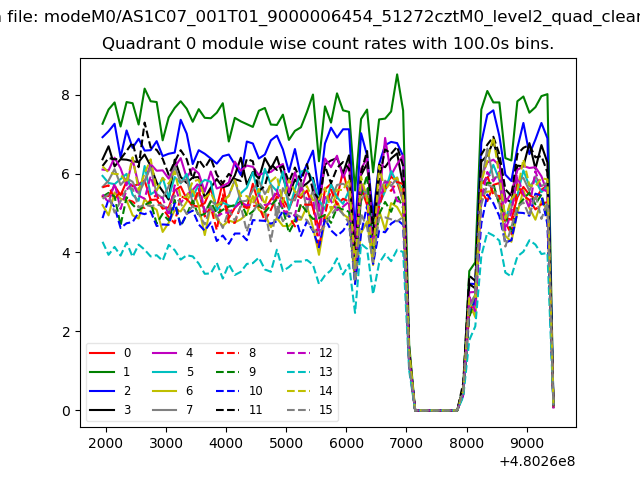 |
 |
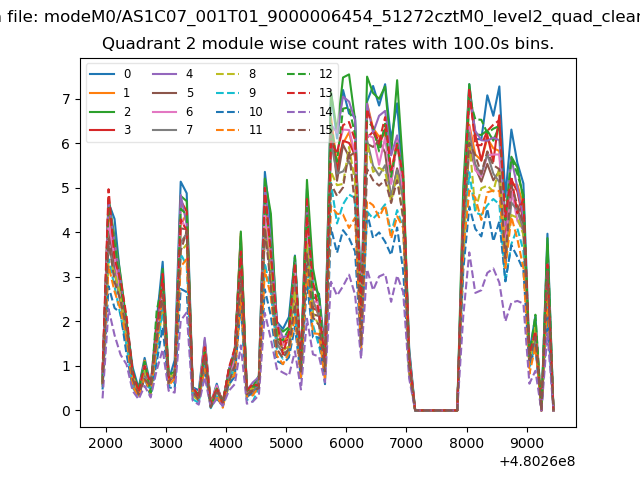
| Module-wise count rates for Quadrant B Data is divided into 100 sec bins |
 |
 |
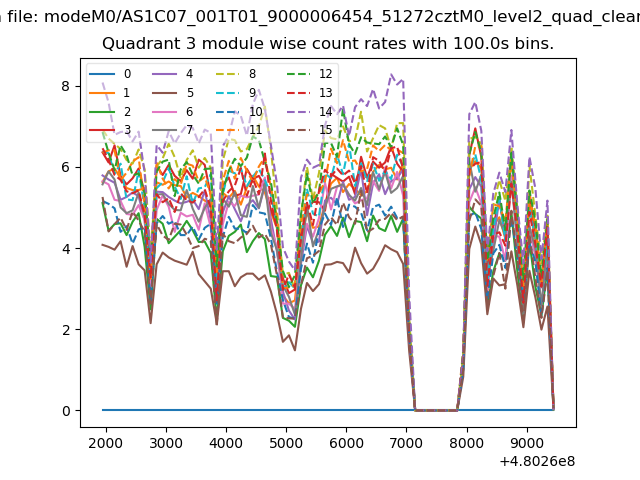
| Module-wise count rates for Quadrant C Data is divided into 100 sec bins |
 |
 |
| Module-wise count rates for Quadrant D Data is divided into 100 sec bins |
 |
 |
| Parameter | Plot |
|---|---|
| CZT HV Monitor | 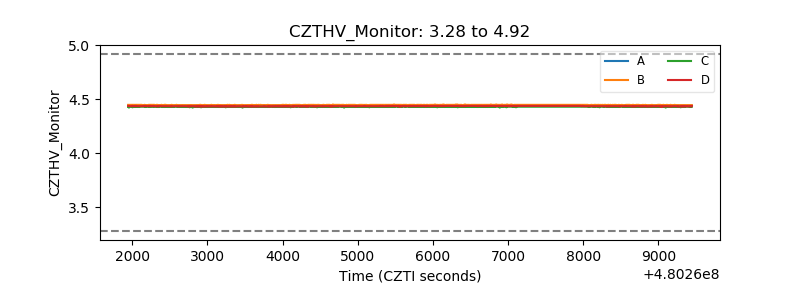 |
| D_VDD | 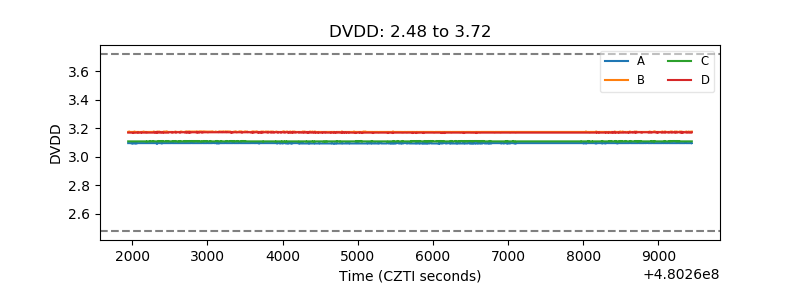 |
| Temperature 1 | 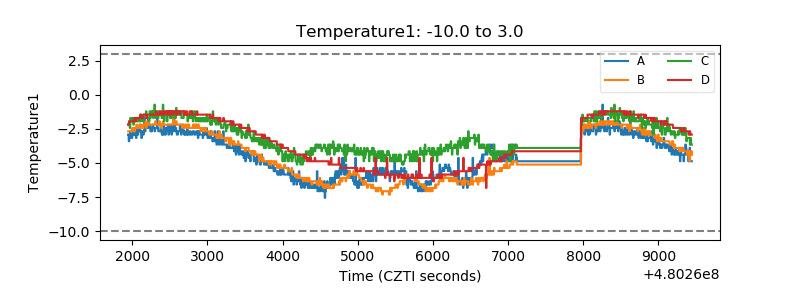 |
| Veto HV Monitor | 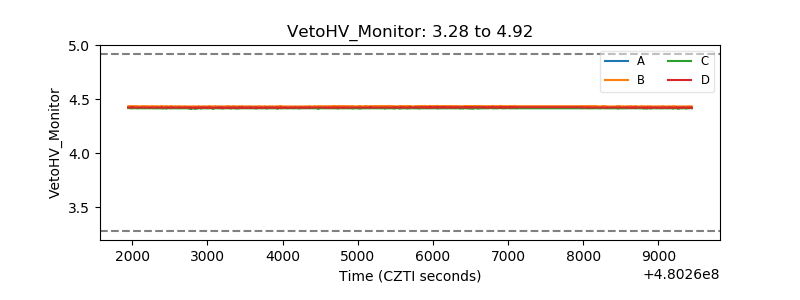 |
| Veto LLD | 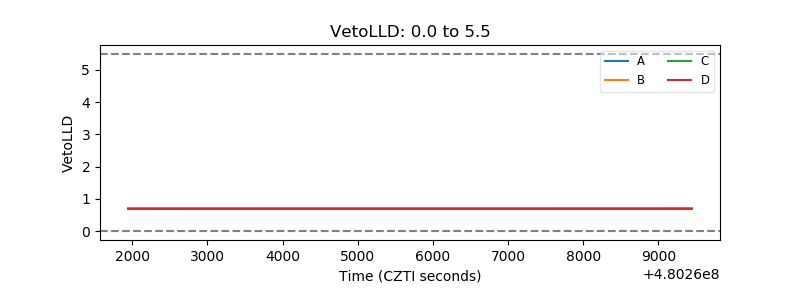 |
| Alpha Counter | 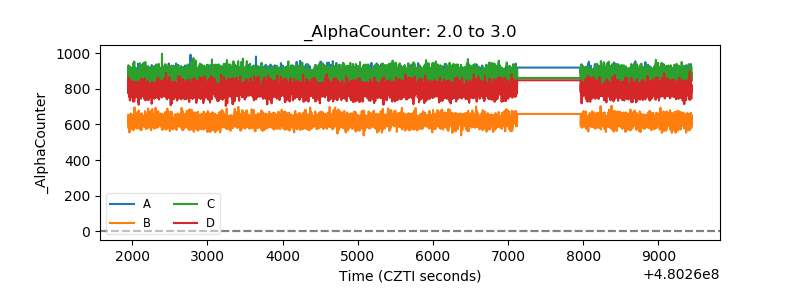 |
| _CPM_Rate | 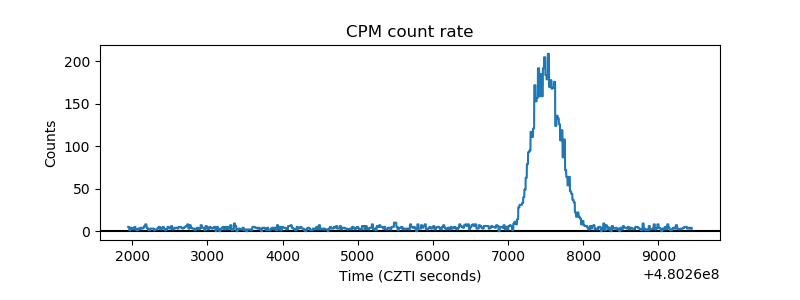 |
| CZT Counter | 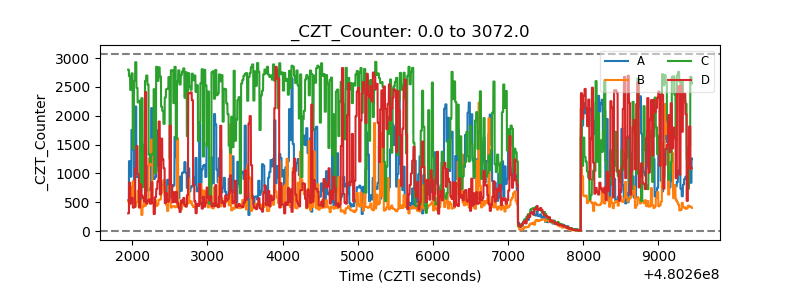 |
| +2.5 Volts monitor | 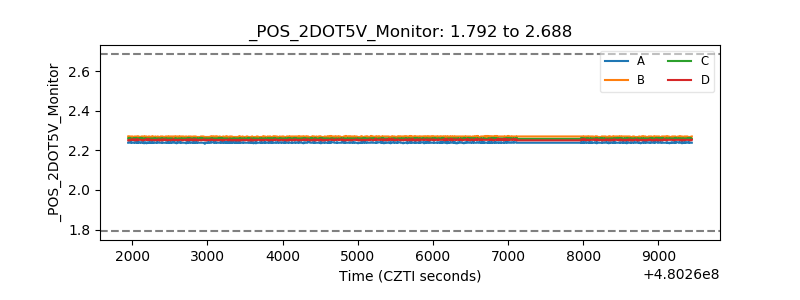 |
| +5 Volts monitor | 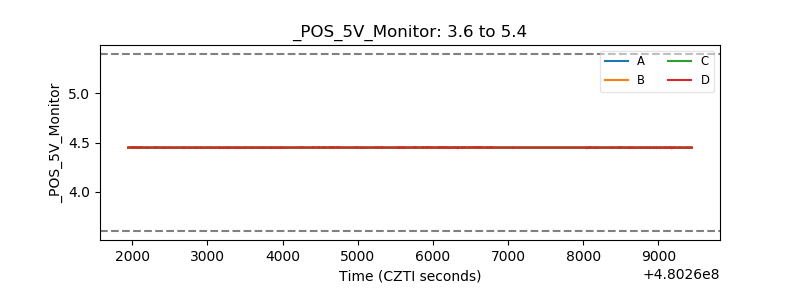 |
| _ROLL_ROT | 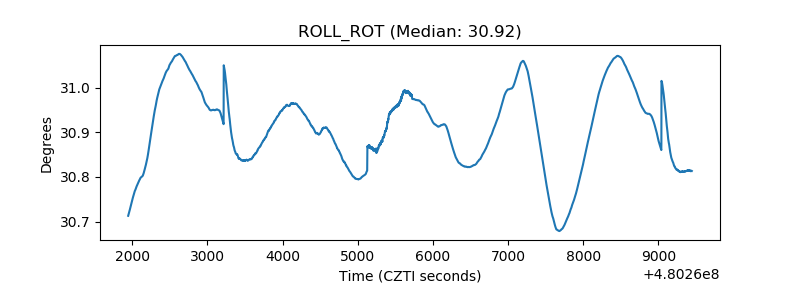 |
| _Roll_DEC | 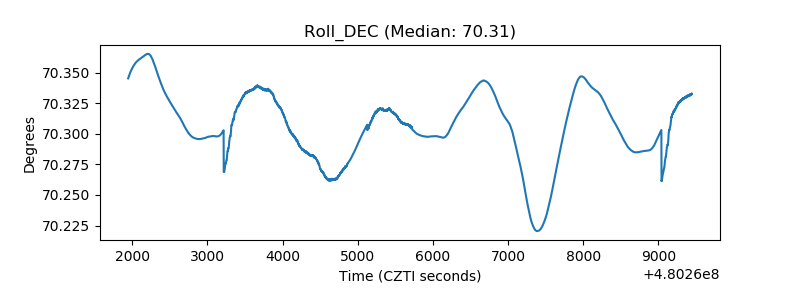 |
| _Roll_RA | 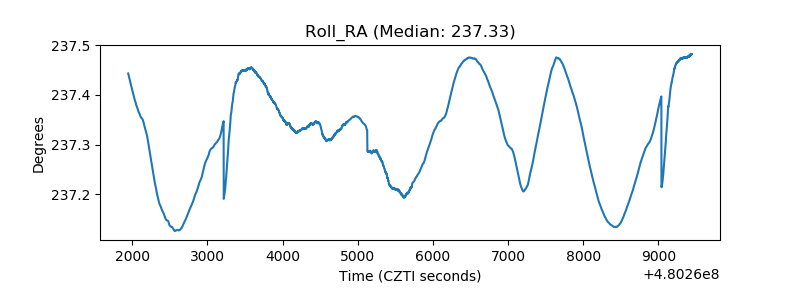 |
| Veto Counter | 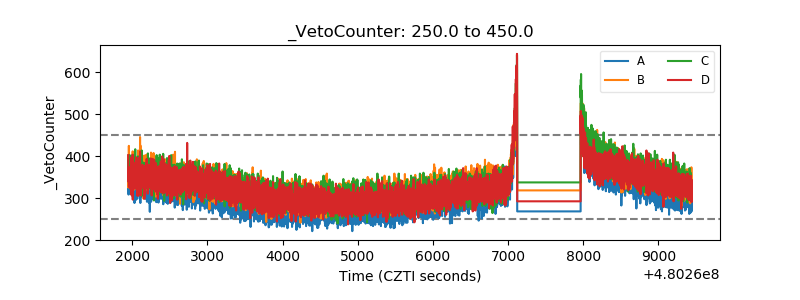 |