| Param | Original file | Final file |
|---|---|---|
| Filename | modeM0/AS1C07_001T01_9000006454_51273cztM0_level2.fits | modeM0/AS1C07_001T01_9000006454_51273cztM0_level2_quad_clean.evt |
| Size (bytes) | 800,386,560 | 82,635,840 |
| Size | 763.3 MB | 78.8 MB |
| Events in quadrant A | 5,691,661 | 583,831 |
| Events in quadrant B | 4,362,187 | 642,384 |
| Events in quadrant C | 13,032,351 | 303,744 |
| Events in quadrant D | 6,030,098 | 510,870 |
| Mode M0 | |||
|---|---|---|---|
| Quadrant | BADHDUFLAG | Total packets | Discarded packets |
| A | 0 | 21509 | 2 |
| B | 0 | 17618 | 2 |
| C | 0 | 43242 | 2 |
| D | 0 | 22693 | 2 |
| Mode SS | |||
|---|---|---|---|
| Quadrant | BADHDUFLAG | Total packets | Discarded packets |
| A | 0 | 134 | 0 |
| B | 0 | 134 | 0 |
| C | 0 | 134 | 0 |
| D | 0 | 134 | 0 |
| Mode M9 | |||
|---|---|---|---|
| Quadrant | BADHDUFLAG | Total packets | Discarded packets |
| A | 0 | 11 | 0 |
| B | 0 | 12 | 0 |
| C | 0 | 12 | 0 |
| D | 0 | 12 | 0 |
| Quadrant | Total seconds | Saturated seconds | Saturation percentage |
|---|---|---|---|
| A | 6610 | 457 | 6.913767% |
| B | 6610 | 422 | 6.384266% |
| C | 6610 | 3654 | 55.279879% |
| D | 6610 | 821 | 12.420575% |
Noise dominated data is calculated using 1-second bins in cleaned event files. If a bin has >2000 counts, and if more than 50% of those come from <1% of pixels, then it is considered to be noise-dominated and hence unusable.
| Quadrant | # 1 sec bins | Bins with >0 counts | Bins with >2000 counts | High rate bins dominated by noise | Noise dominated (total time) | Noise dominated (detector-on time) | Marked lightcurve |
|---|---|---|---|---|---|---|---|
| A | 7610 | 6610 | 243 | 243 | 3.19% | 3.68% | 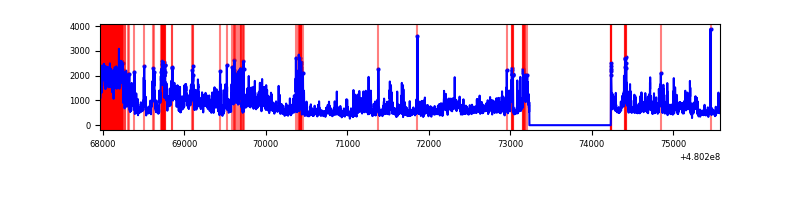 |
| B | 7610 | 6610 | 239 | 239 | 3.14% | 3.62% | 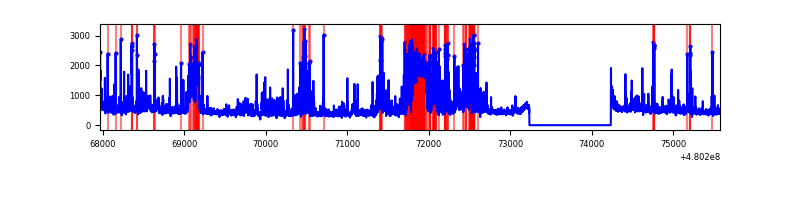 |
| C | 7610 | 6610 | 3500 | 3500 | 45.99% | 52.95% | 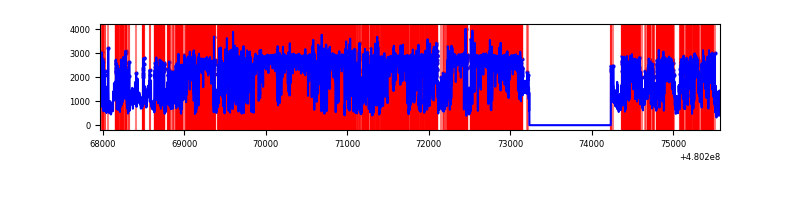 |
| D | 7610 | 6610 | 772 | 772 | 10.14% | 11.68% | 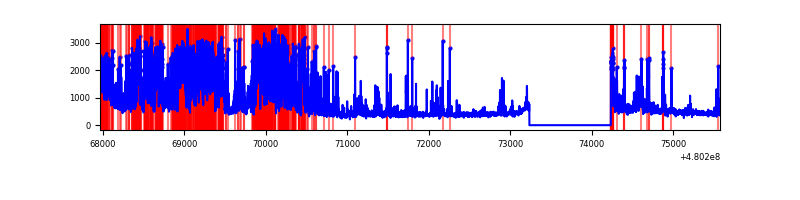 |
Top three noisy pixels from each quadrant. If the there are fewer than three noisy pixels in the level2.evt file, extra rows are filled as -1
| Pixel properties | Quadrant properties | ||||||
|---|---|---|---|---|---|---|---|
| Quadrant | DetID | PixID | Counts | Sigma | Mean | Median | Sigma |
| A | 12 | 3 | 1552614 | 9181.6 | 682 | 665 | 169.0 |
| A | 12 | 80 | 350155 | 2067.64 | 682 | 665 | 169.0 |
| A | 12 | 250 | 248600 | 1466.83 | 682 | 665 | 169.0 |
| B | 12 | 18 | 662490 | 4578.12 | 680 | 659 | 144.6 |
| B | 0 | 172 | 224948 | 1551.49 | 680 | 659 | 144.6 |
| B | 5 | 185 | 220043 | 1517.56 | 680 | 659 | 144.6 |
| C | 4 | 12 | 7415806 | 52606.12 | 507 | 503 | 141.0 |
| C | 10 | 171 | 3253868 | 23080.23 | 507 | 503 | 141.0 |
| C | 3 | 233 | 64775 | 455.96 | 507 | 503 | 141.0 |
| D | 8 | 176 | 1487154 | 8148.35 | 653 | 630 | 182.4 |
| D | 6 | 42 | 593506 | 3249.84 | 653 | 630 | 182.4 |
| D | 6 | 228 | 366879 | 2007.59 | 653 | 630 | 182.4 |
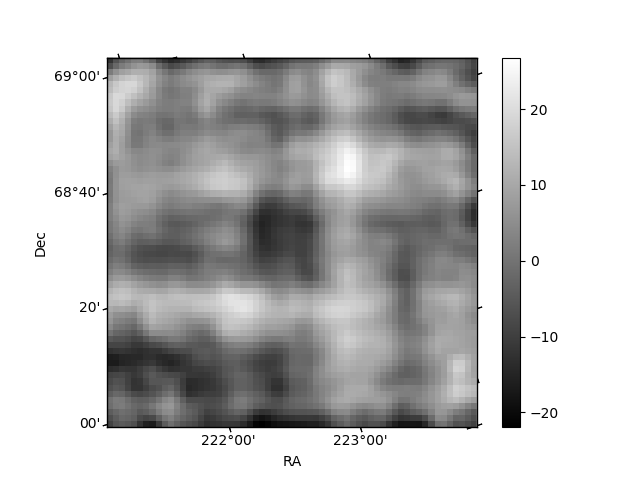
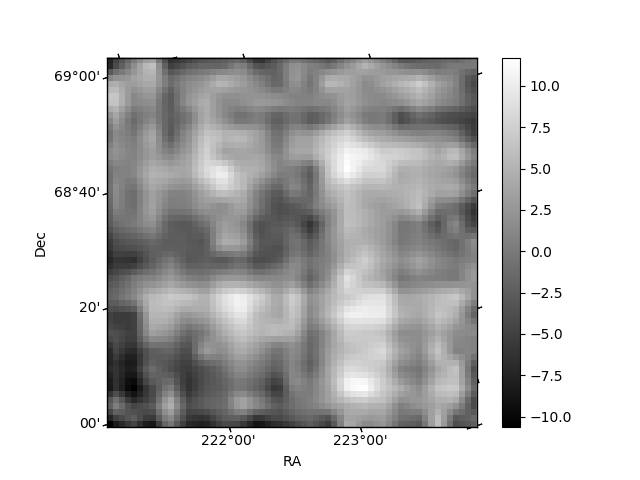
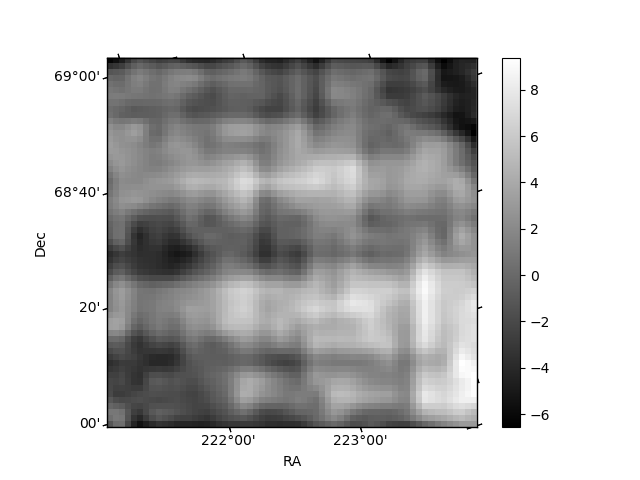
Histogram calculated using DETX and DETY for each event in the final _common_clean file
| Quadrant A | 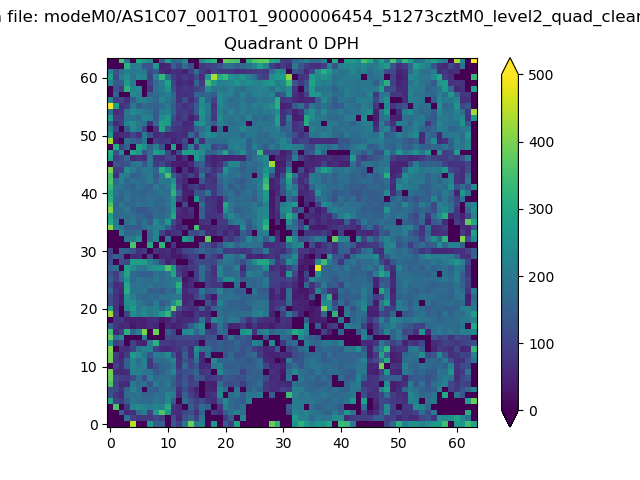 |
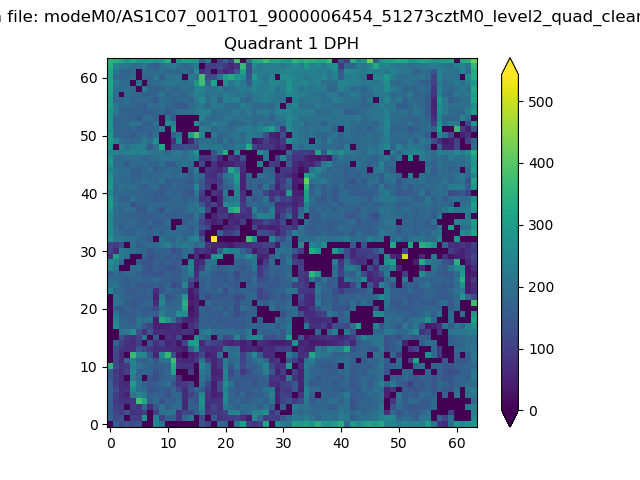 |
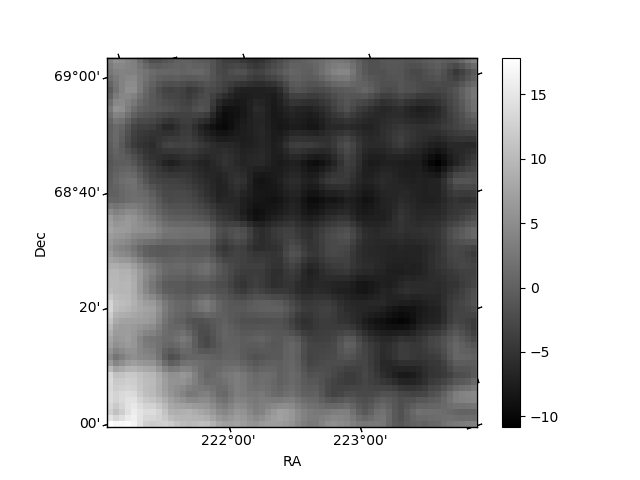
Quadrant B |
|---|---|---|---|
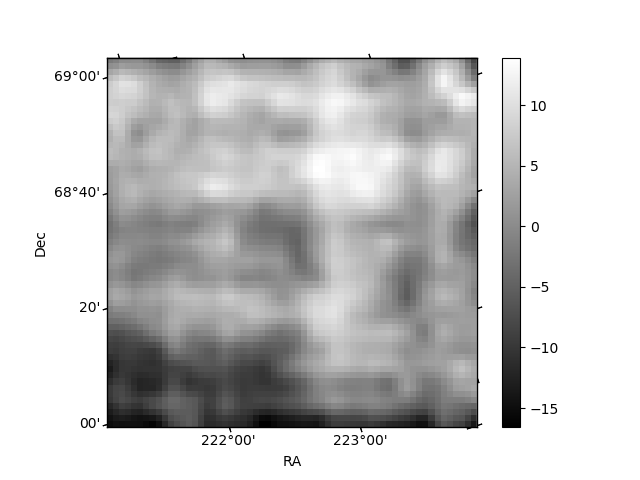
| Quadrant D | 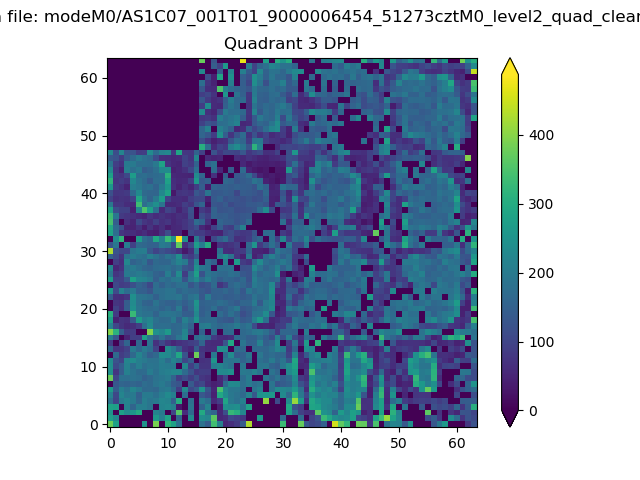 |
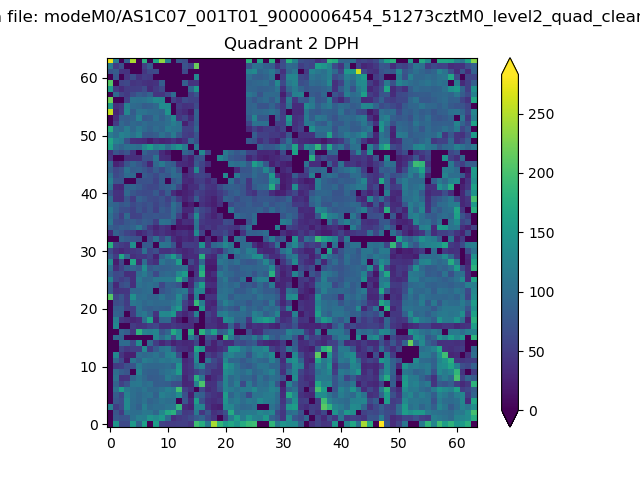 |
Quadrant C |
| Plot type | Count rate plots | Images |
|---|---|---|
| Comparison with Poisson distribution Blue bars denote a histogram of data divided into 1 sec bins. Red curve is a Poisson curve with rate = median count rate of data. |
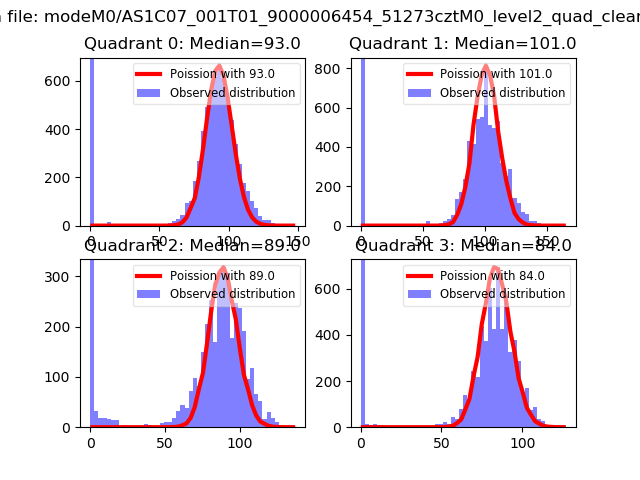 |
 |
| Quadrant-wise count rates Data is divided into 100 sec bins |
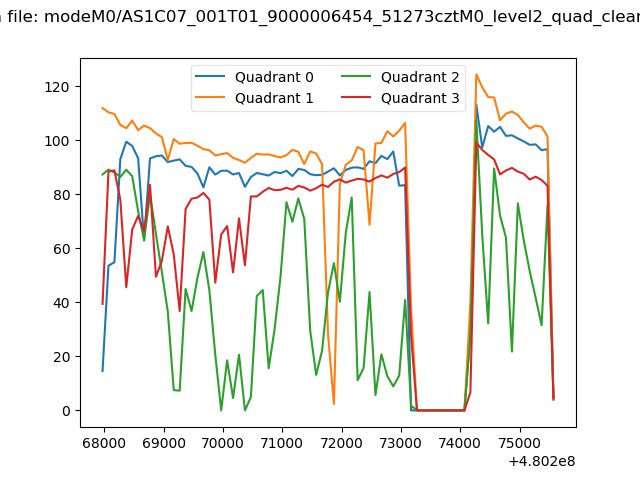 |
|
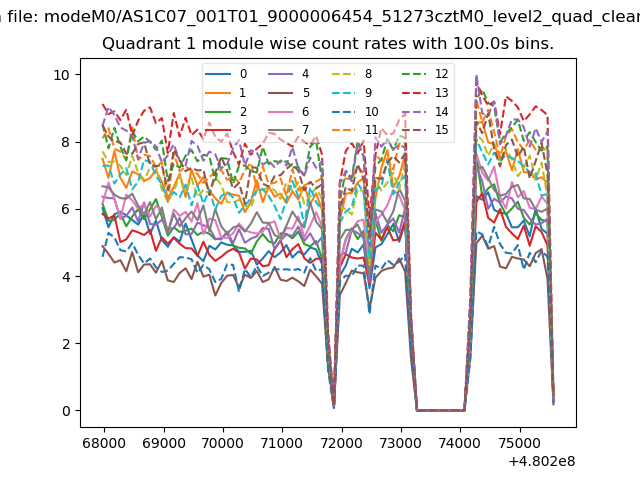
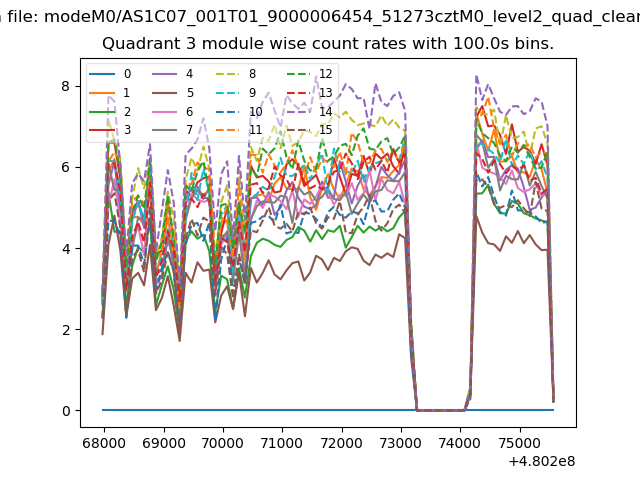
| Module-wise count rates for Quadrant A Data is divided into 100 sec bins |
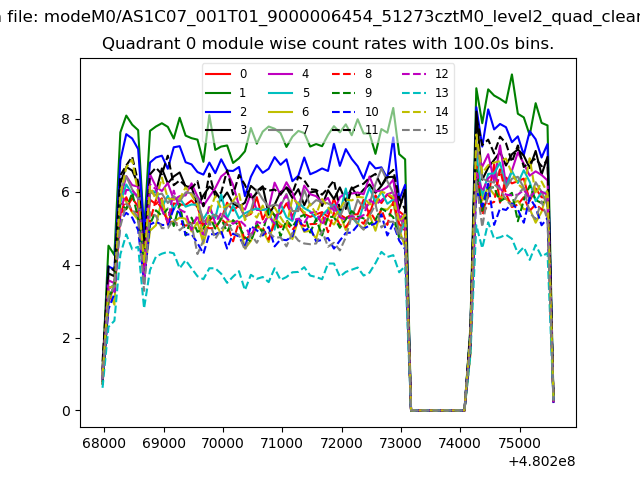 |
 |
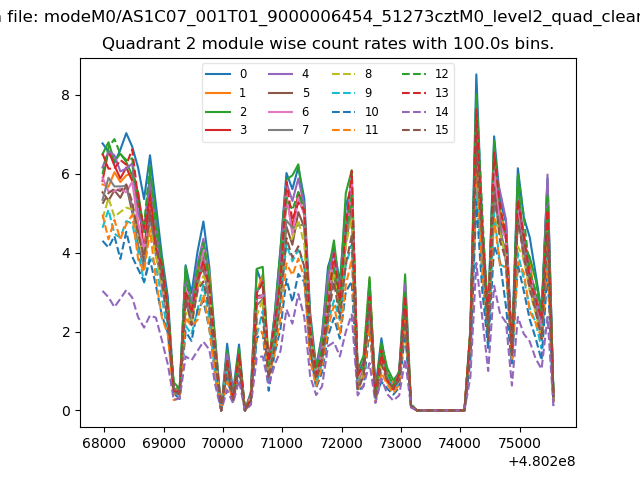
| Module-wise count rates for Quadrant B Data is divided into 100 sec bins |
 |
 |
| Module-wise count rates for Quadrant C Data is divided into 100 sec bins |
 |
 |
| Module-wise count rates for Quadrant D Data is divided into 100 sec bins |
 |
 |
| Parameter | Plot |
|---|---|
| CZT HV Monitor | 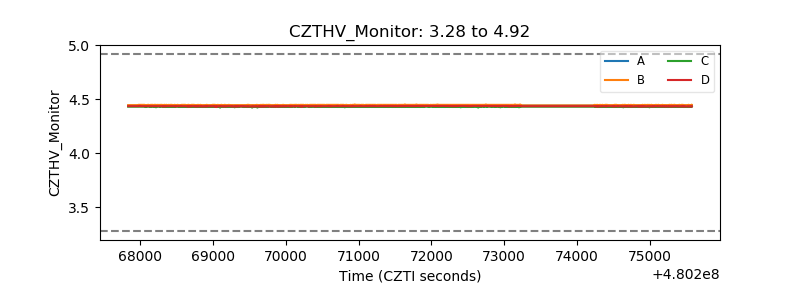 |
| D_VDD | 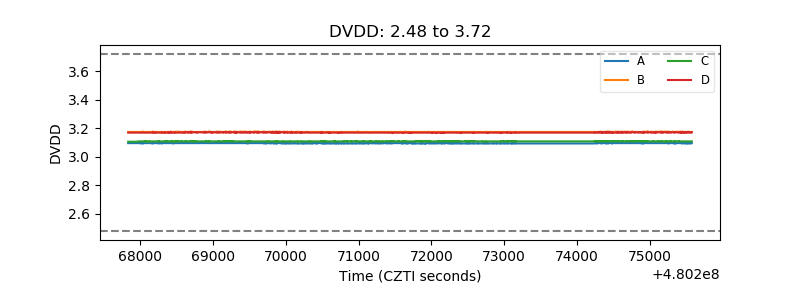 |
| Temperature 1 | 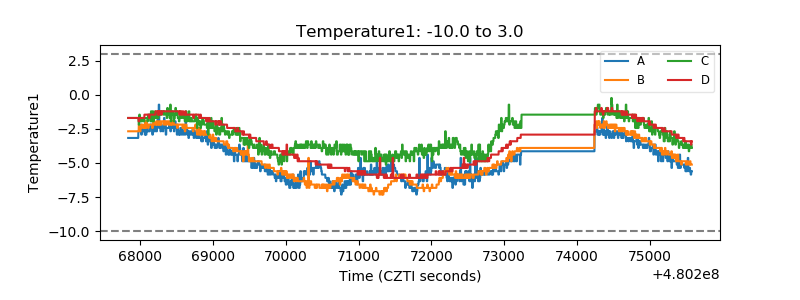 |
| Veto HV Monitor |  |
| Veto LLD | 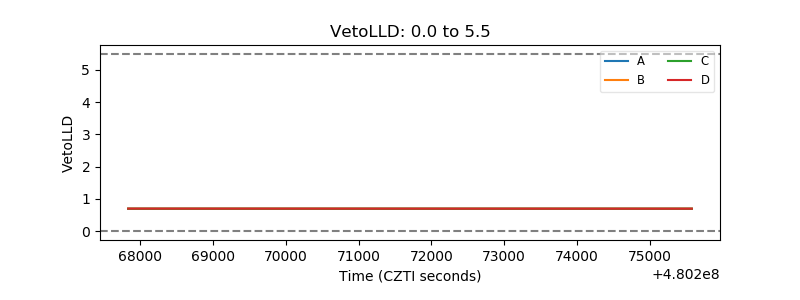 |
| Alpha Counter | 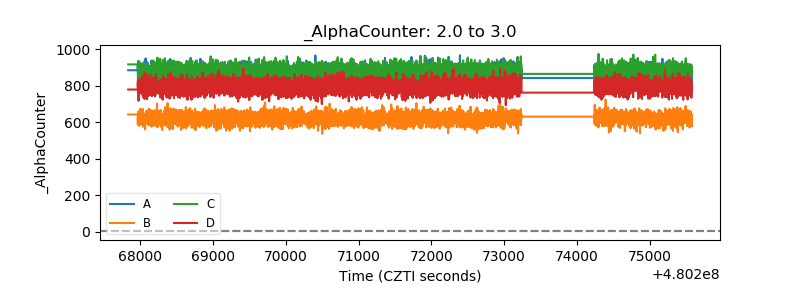 |
| _CPM_Rate | 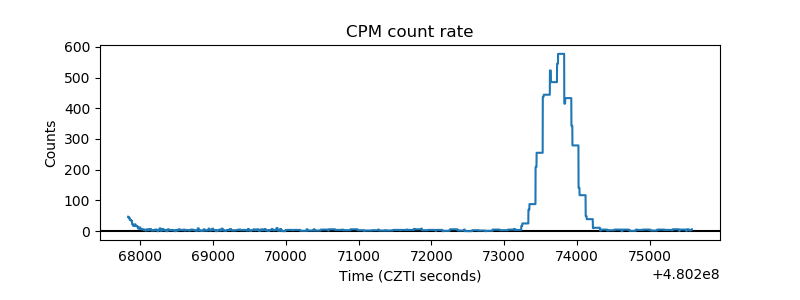 |
| CZT Counter | 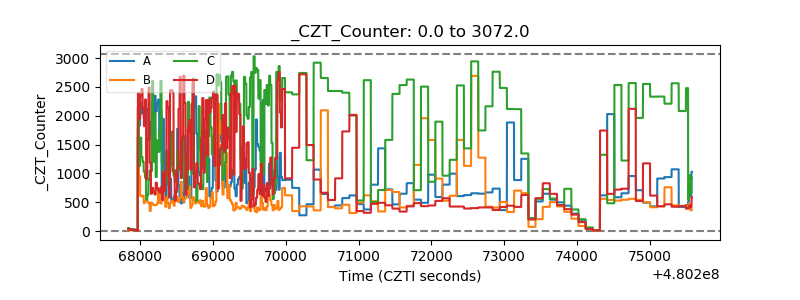 |
| +2.5 Volts monitor | 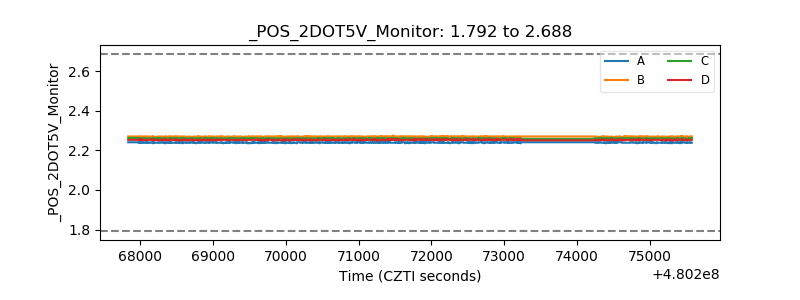 |
| +5 Volts monitor | 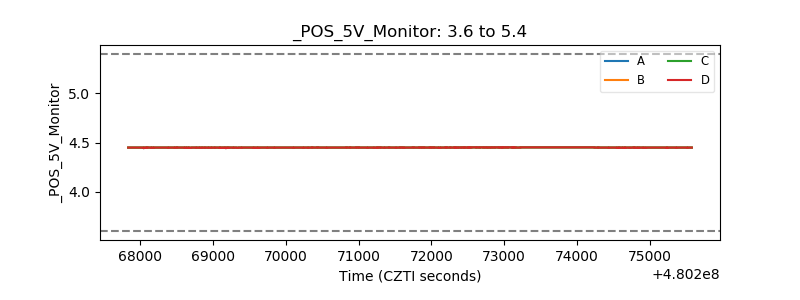 |
| _ROLL_ROT | 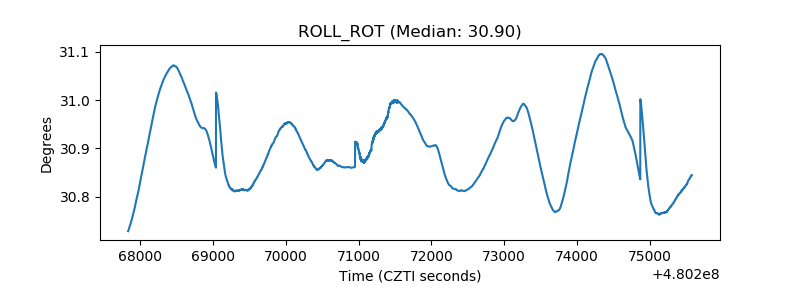 |
| _Roll_DEC | 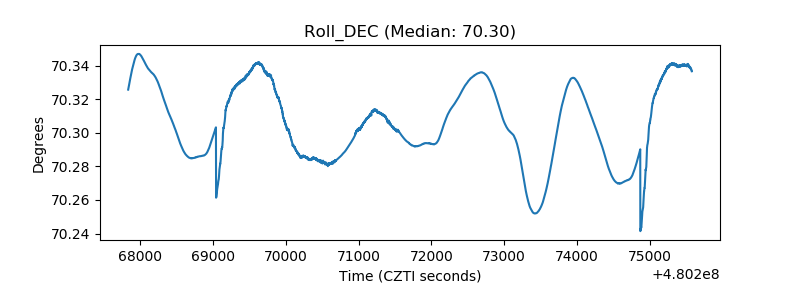 |
| _Roll_RA | 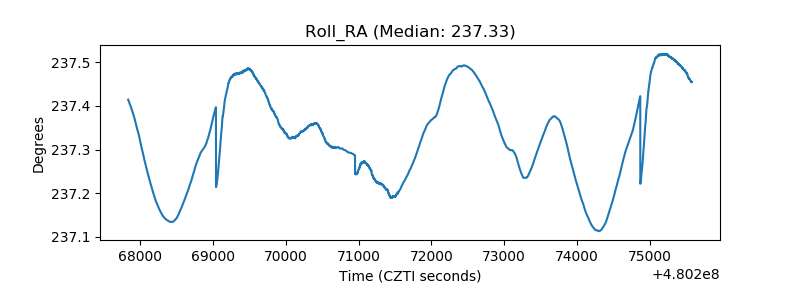 |
| Veto Counter | 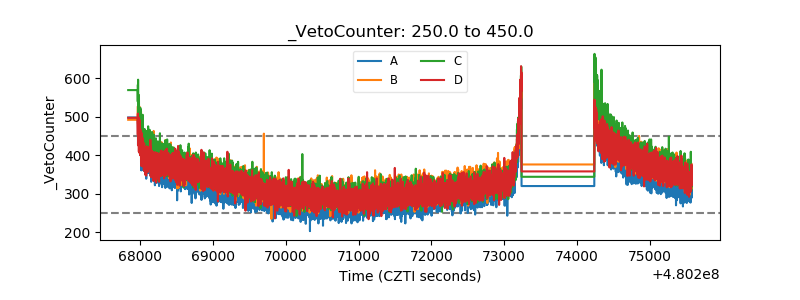 |