| Param | Original file | Final file |
|---|---|---|
| Filename | modeM0/AS1C07_001T01_9000006454_51275cztM0_level2.fits | modeM0/AS1C07_001T01_9000006454_51275cztM0_level2_quad_clean.evt |
| Size (bytes) | 664,110,720 | 90,383,040 |
| Size | 633.3 MB | 86.2 MB |
| Events in quadrant A | 5,407,816 | 614,017 |
| Events in quadrant B | 3,845,153 | 676,894 |
| Events in quadrant C | 10,060,204 | 446,243 |
| Events in quadrant D | 4,768,052 | 547,156 |
| Mode M0 | |||
|---|---|---|---|
| Quadrant | BADHDUFLAG | Total packets | Discarded packets |
| A | 0 | 20701 | 2 |
| B | 0 | 15876 | 2 |
| C | 0 | 34360 | 5 |
| D | 0 | 18918 | 2 |
| Mode SS | |||
|---|---|---|---|
| Quadrant | BADHDUFLAG | Total packets | Discarded packets |
| A | 0 | 130 | 0 |
| B | 0 | 130 | 0 |
| C | 0 | 130 | 0 |
| D | 0 | 130 | 0 |
| Mode M9 | |||
|---|---|---|---|
| Quadrant | BADHDUFLAG | Total packets | Discarded packets |
| A | 0 | 18 | 0 |
| B | 0 | 19 | 0 |
| C | 0 | 19 | 0 |
| D | 0 | 19 | 0 |
| Quadrant | Total seconds | Saturated seconds | Saturation percentage |
|---|---|---|---|
| A | 6487 | 189 | 2.913519% |
| B | 6487 | 164 | 2.528133% |
| C | 6486 | 2086 | 32.161579% |
| D | 6486 | 425 | 6.552575% |
Noise dominated data is calculated using 1-second bins in cleaned event files. If a bin has >2000 counts, and if more than 50% of those come from <1% of pixels, then it is considered to be noise-dominated and hence unusable.
| Quadrant | # 1 sec bins | Bins with >0 counts | Bins with >2000 counts | High rate bins dominated by noise | Noise dominated (total time) | Noise dominated (detector-on time) | Marked lightcurve |
|---|---|---|---|---|---|---|---|
| A | 7567 | 6487 | 91 | 91 | 1.20% | 1.40% | 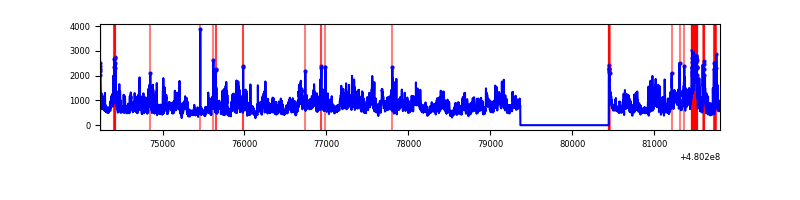 |
| B | 7567 | 6487 | 73 | 73 | 0.96% | 1.13% | 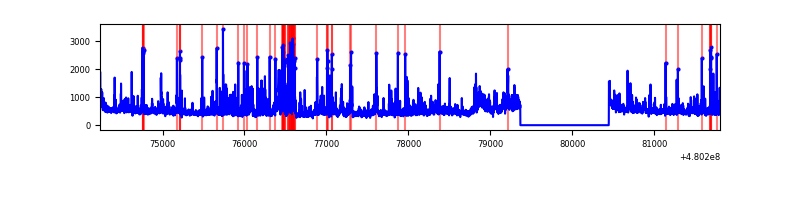 |
| C | 7566 | 6486 | 2064 | 2064 | 27.28% | 31.82% | 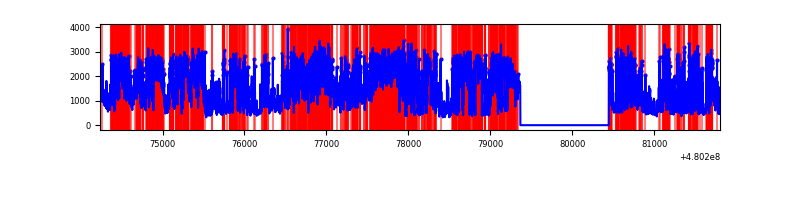 |
| D | 7566 | 6487 | 327 | 327 | 4.32% | 5.04% | 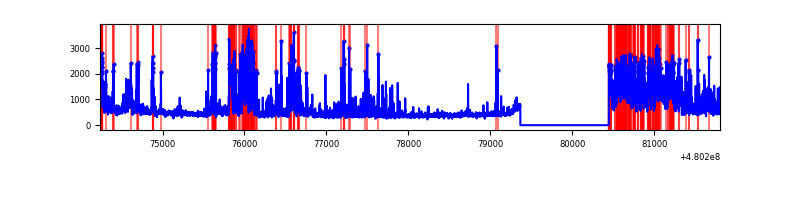 |
Top three noisy pixels from each quadrant. If the there are fewer than three noisy pixels in the level2.evt file, extra rows are filled as -1
| Pixel properties | Quadrant properties | ||||||
|---|---|---|---|---|---|---|---|
| Quadrant | DetID | PixID | Counts | Sigma | Mean | Median | Sigma |
| A | 12 | 3 | 1654914 | 9774.4 | 682 | 665 | 169.2 |
| A | 9 | 160 | 306432 | 1806.67 | 682 | 665 | 169.2 |
| A | 12 | 194 | 193820 | 1141.29 | 682 | 665 | 169.2 |
| B | 10 | 254 | 289156 | 1981.52 | 688 | 664 | 145.6 |
| B | 5 | 185 | 260123 | 1782.11 | 688 | 664 | 145.6 |
| B | 10 | 247 | 156107 | 1067.67 | 688 | 664 | 145.6 |
| C | 4 | 12 | 3997724 | 23753.84 | 606 | 600 | 168.3 |
| C | 10 | 171 | 3266732 | 19409.75 | 606 | 600 | 168.3 |
| C | 5 | 10 | 94176 | 556.1 | 606 | 600 | 168.3 |
| D | 8 | 176 | 1158239 | 6230.81 | 658 | 633 | 185.8 |
| D | 2 | 216 | 302483 | 1624.71 | 658 | 633 | 185.8 |
| D | 2 | 249 | 241339 | 1295.6 | 658 | 633 | 185.8 |
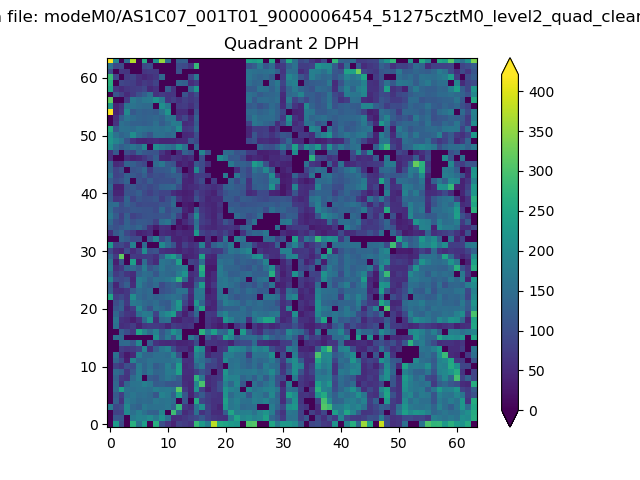
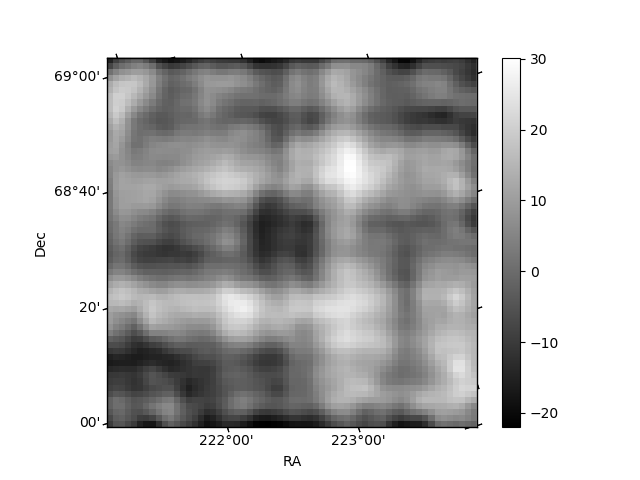
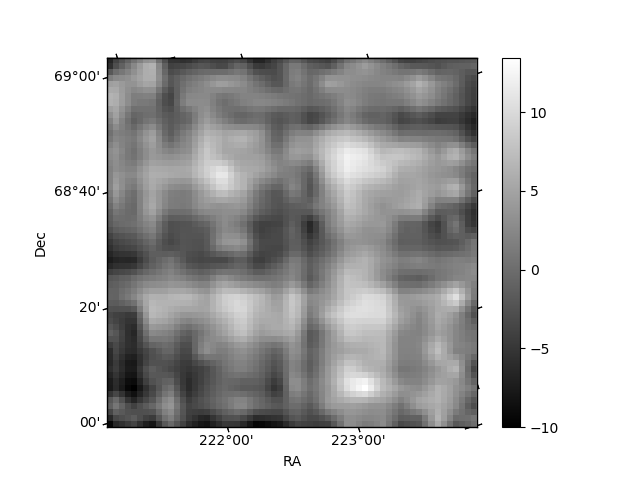
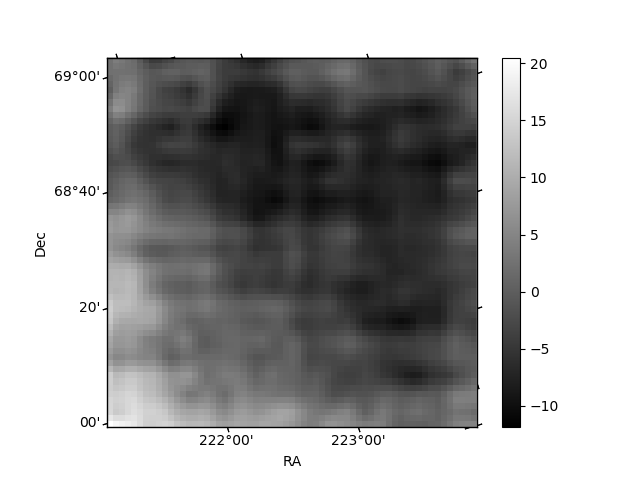
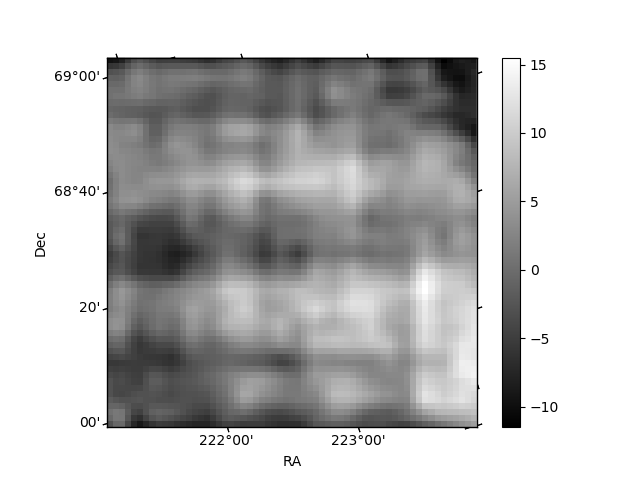
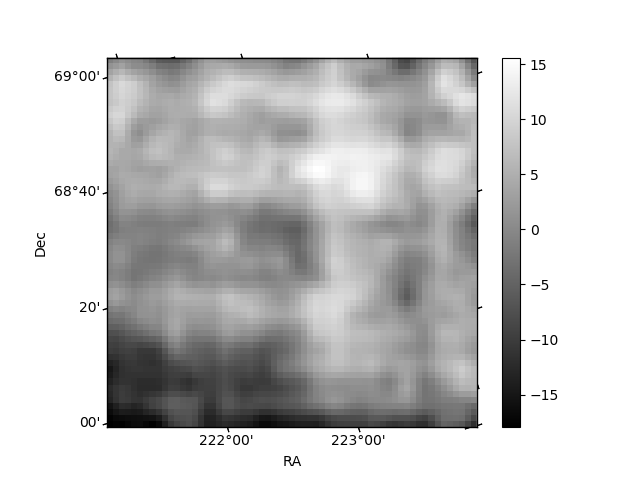
Histogram calculated using DETX and DETY for each event in the final _common_clean file
| Quadrant A | 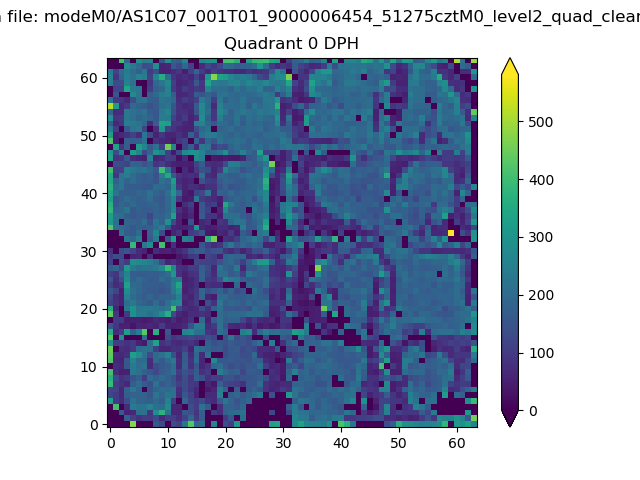 |
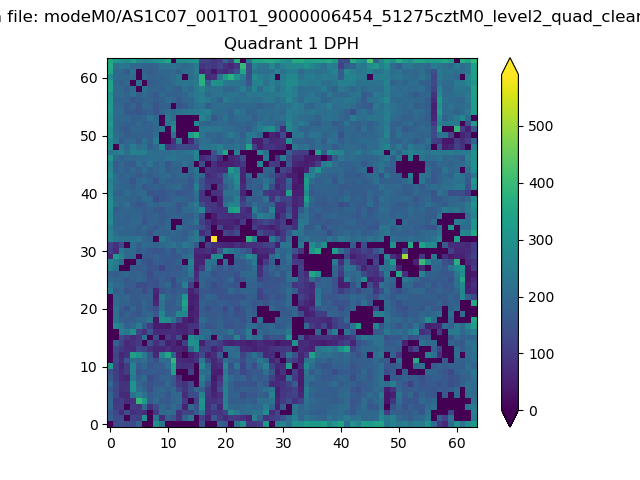 |
Quadrant B |
|---|---|---|---|
| Quadrant D | 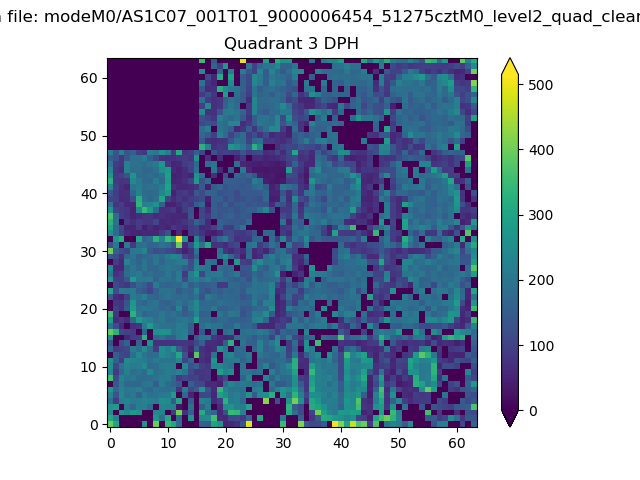 |
 |
Quadrant C |
| Plot type | Count rate plots | Images |
|---|---|---|
| Comparison with Poisson distribution Blue bars denote a histogram of data divided into 1 sec bins. Red curve is a Poisson curve with rate = median count rate of data. |
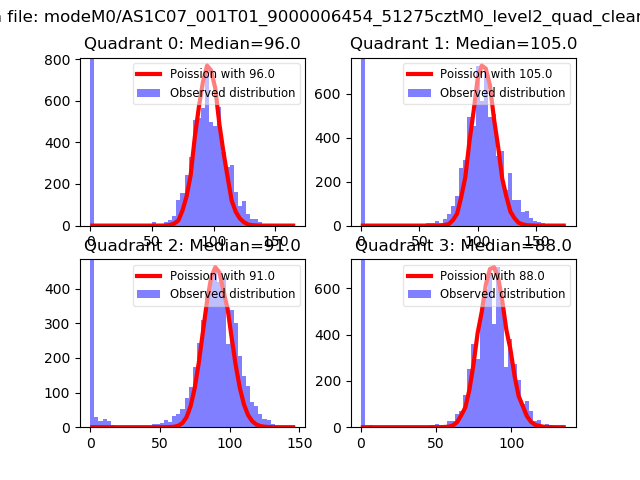 |
 |
| Quadrant-wise count rates Data is divided into 100 sec bins |
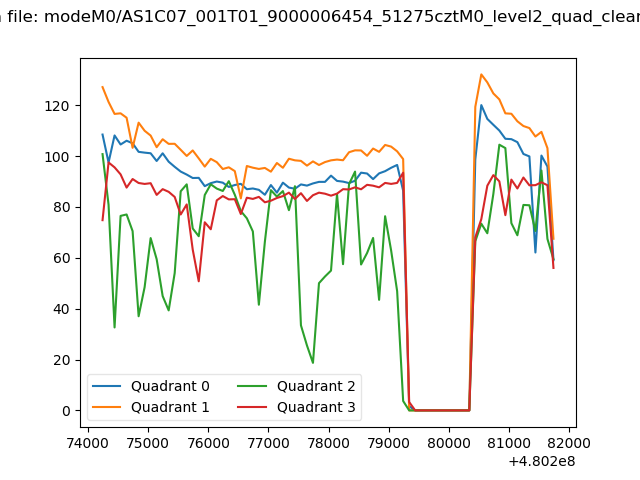 |
|
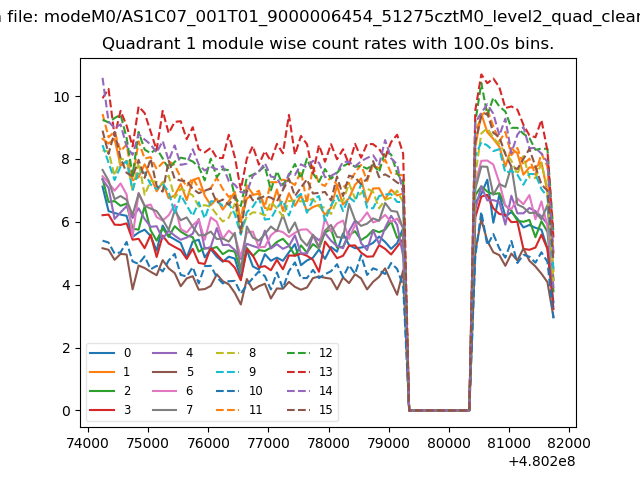
| Module-wise count rates for Quadrant A Data is divided into 100 sec bins |
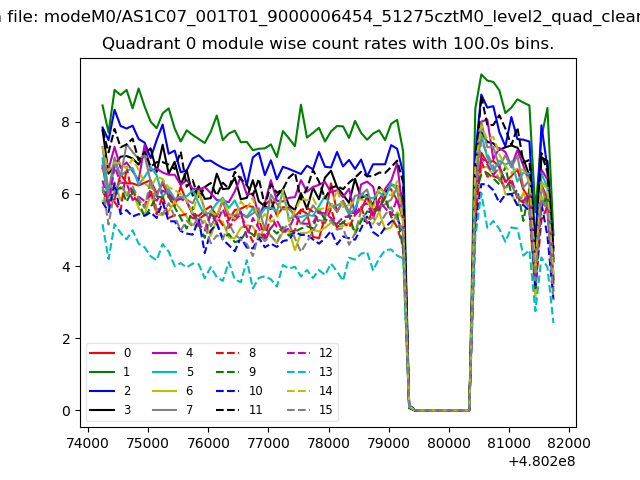 |
 |
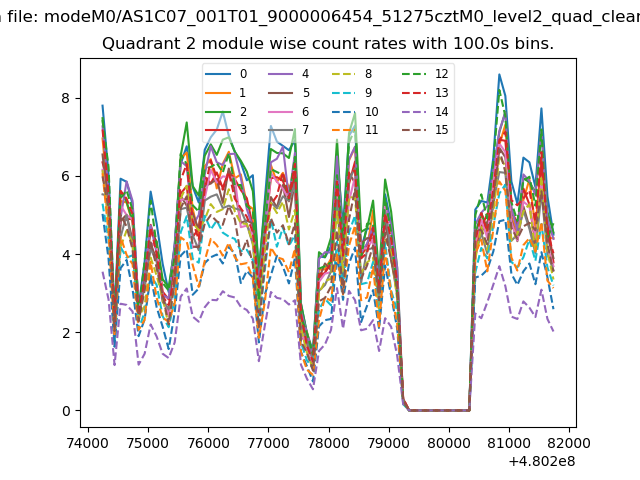
| Module-wise count rates for Quadrant B Data is divided into 100 sec bins |
 |
 |
| Module-wise count rates for Quadrant C Data is divided into 100 sec bins |
 |
 |
| Module-wise count rates for Quadrant D Data is divided into 100 sec bins |
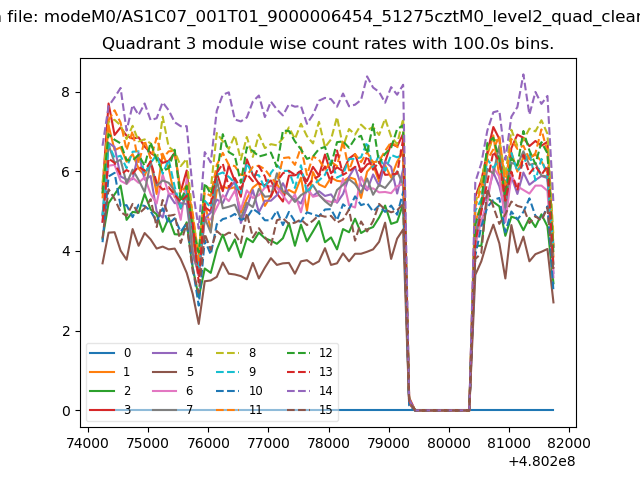 |
 |
| Parameter | Plot |
|---|---|
| CZT HV Monitor | 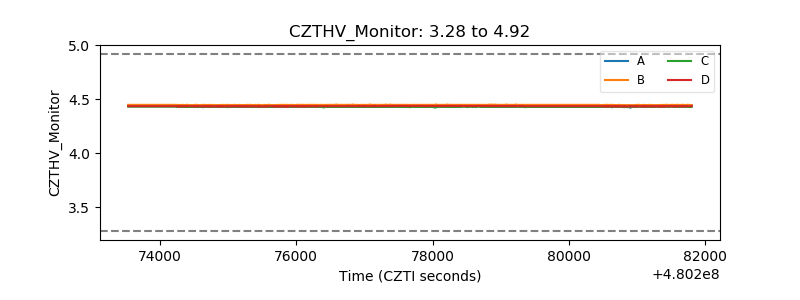 |
| D_VDD | 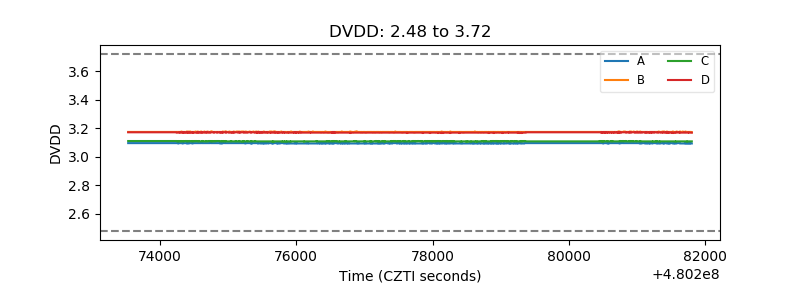 |
| Temperature 1 | 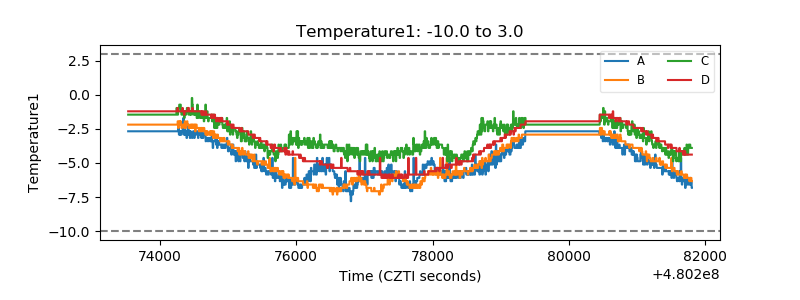 |
| Veto HV Monitor | 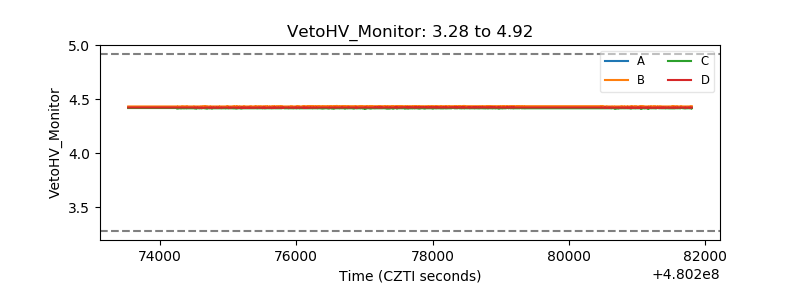 |
| Veto LLD | 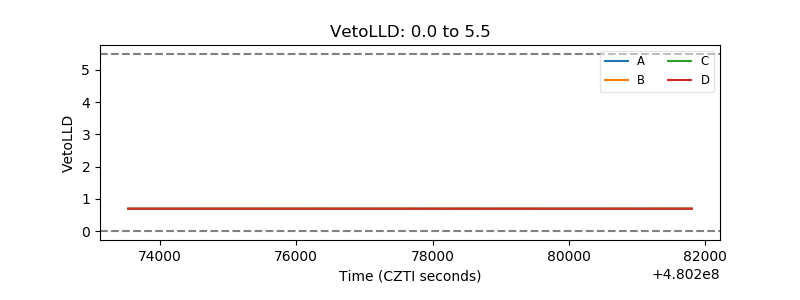 |
| Alpha Counter | 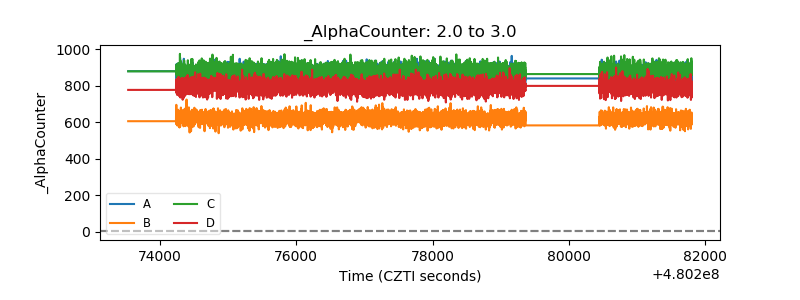 |
| _CPM_Rate | 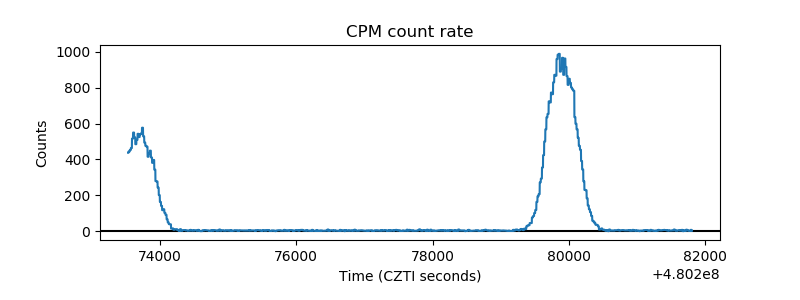 |
| CZT Counter | 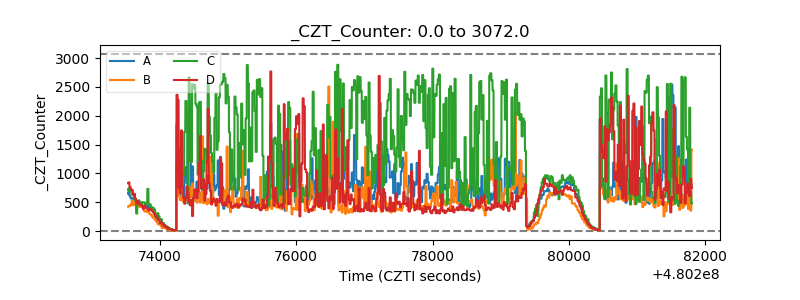 |
| +2.5 Volts monitor | 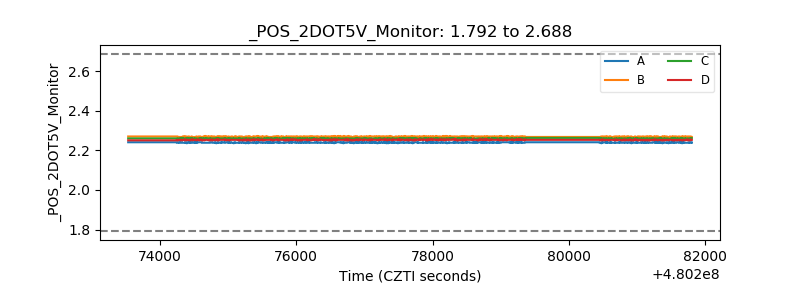 |
| +5 Volts monitor | 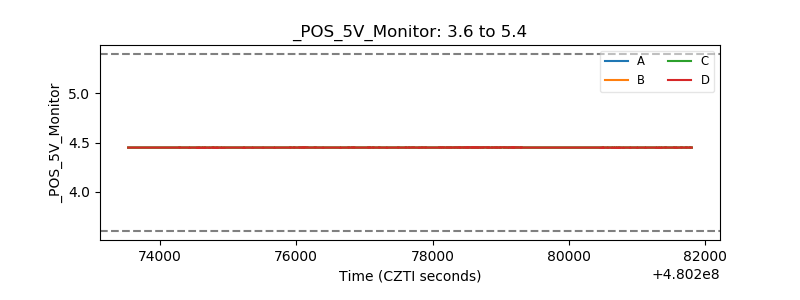 |
| _ROLL_ROT | 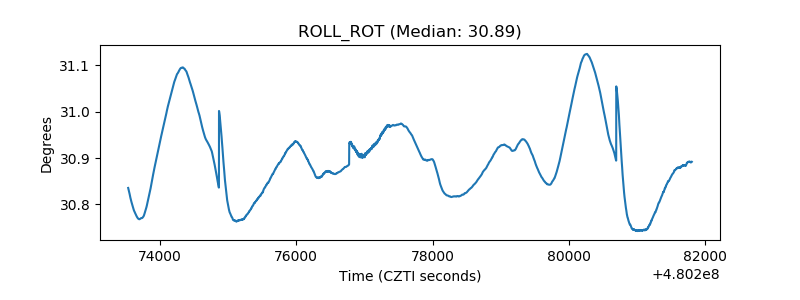 |
| _Roll_DEC | 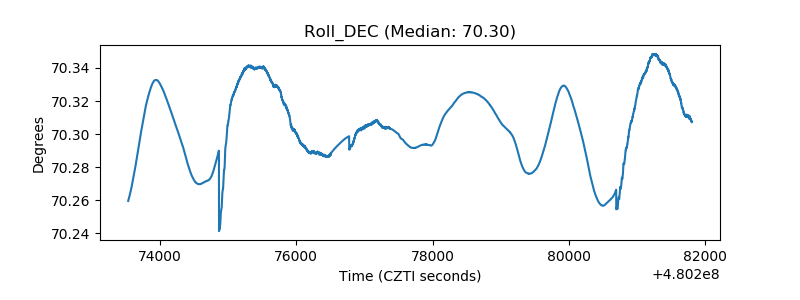 |
| _Roll_RA | 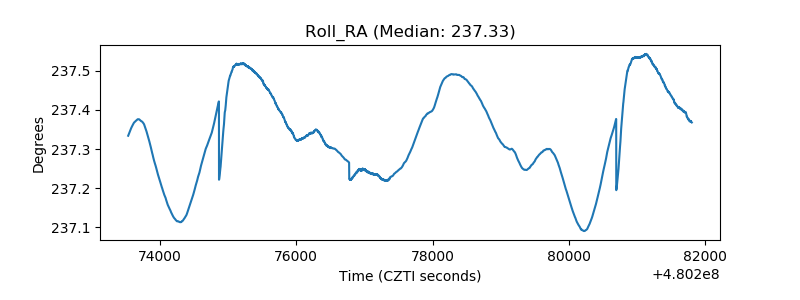 |
| Veto Counter | 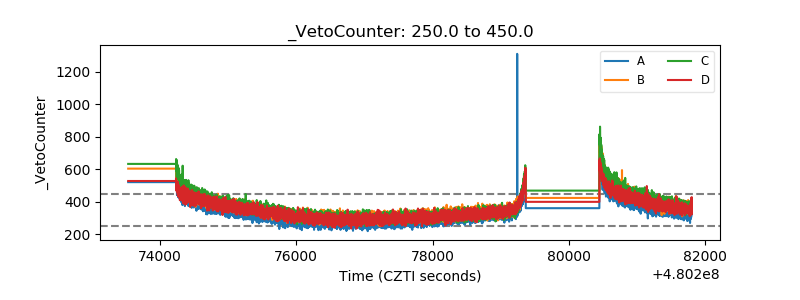 |