| Param | Original file | Final file |
|---|---|---|
| Filename | modeM0/AS1C07_001T01_9000006454_51276cztM0_level2.fits | modeM0/AS1C07_001T01_9000006454_51276cztM0_level2_quad_clean.evt |
| Size (bytes) | 653,019,840 | 90,685,440 |
| Size | 622.8 MB | 86.5 MB |
| Events in quadrant A | 5,816,398 | 623,842 |
| Events in quadrant B | 3,952,942 | 691,534 |
| Events in quadrant C | 9,573,789 | 412,826 |
| Events in quadrant D | 4,330,648 | 567,803 |
| Mode M0 | |||
|---|---|---|---|
| Quadrant | BADHDUFLAG | Total packets | Discarded packets |
| A | 0 | 21915 | 2 |
| B | 0 | 16167 | 2 |
| C | 0 | 32815 | 2 |
| D | 0 | 17558 | 3 |
| Mode SS | |||
|---|---|---|---|
| Quadrant | BADHDUFLAG | Total packets | Discarded packets |
| A | 0 | 132 | 0 |
| B | 0 | 132 | 0 |
| C | 0 | 132 | 0 |
| D | 0 | 132 | 0 |
| Mode M9 | |||
|---|---|---|---|
| Quadrant | BADHDUFLAG | Total packets | Discarded packets |
| A | 0 | 11 | 0 |
| B | 0 | 11 | 0 |
| C | 0 | 11 | 0 |
| D | 0 | 11 | 0 |
| Quadrant | Total seconds | Saturated seconds | Saturation percentage |
|---|---|---|---|
| A | 6442 | 245 | 3.803167% |
| B | 6443 | 185 | 2.871333% |
| C | 6443 | 2439 | 37.855036% |
| D | 6442 | 279 | 4.330953% |
Noise dominated data is calculated using 1-second bins in cleaned event files. If a bin has >2000 counts, and if more than 50% of those come from <1% of pixels, then it is considered to be noise-dominated and hence unusable.
| Quadrant | # 1 sec bins | Bins with >0 counts | Bins with >2000 counts | High rate bins dominated by noise | Noise dominated (total time) | Noise dominated (detector-on time) | Marked lightcurve |
|---|---|---|---|---|---|---|---|
| A | 7597 | 6442 | 126 | 126 | 1.66% | 1.96% | 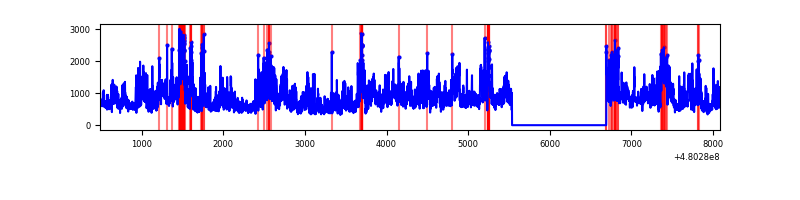 |
| B | 7598 | 6443 | 98 | 98 | 1.29% | 1.52% | 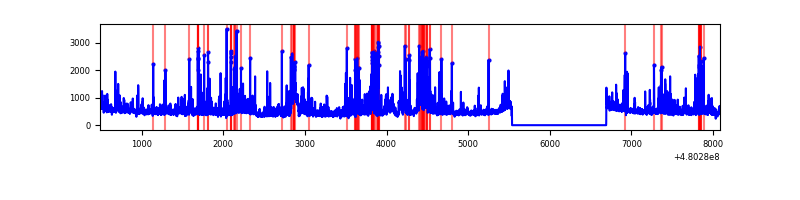 |
| C | 7598 | 6443 | 2372 | 2372 | 31.22% | 36.82% | 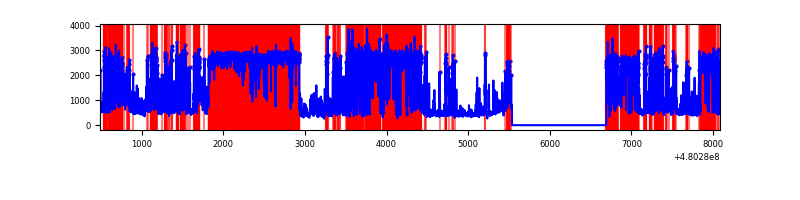 |
| D | 7597 | 6442 | 223 | 223 | 2.94% | 3.46% | 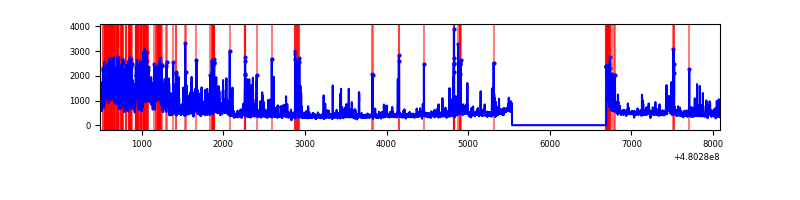 |
Top three noisy pixels from each quadrant. If the there are fewer than three noisy pixels in the level2.evt file, extra rows are filled as -1
| Pixel properties | Quadrant properties | ||||||
|---|---|---|---|---|---|---|---|
| Quadrant | DetID | PixID | Counts | Sigma | Mean | Median | Sigma |
| A | 12 | 3 | 1716470 | 10141.34 | 681 | 664 | 169.2 |
| A | 8 | 10 | 491001 | 2898.16 | 681 | 664 | 169.2 |
| A | 9 | 160 | 226209 | 1333.09 | 681 | 664 | 169.2 |
| B | 5 | 185 | 602171 | 4143.78 | 687 | 663 | 145.2 |
| B | 10 | 247 | 168254 | 1154.53 | 687 | 663 | 145.2 |
| B | 10 | 254 | 89579 | 612.54 | 687 | 663 | 145.2 |
| C | 4 | 12 | 6293638 | 41975.85 | 541 | 536 | 149.9 |
| C | 10 | 171 | 623014 | 4152.01 | 541 | 536 | 149.9 |
| C | 12 | 16 | 114156 | 757.86 | 541 | 536 | 149.9 |
| D | 8 | 176 | 874806 | 4731.57 | 663 | 639 | 184.8 |
| D | 2 | 216 | 341251 | 1843.62 | 663 | 639 | 184.8 |
| D | 3 | 12 | 91069 | 489.47 | 663 | 639 | 184.8 |
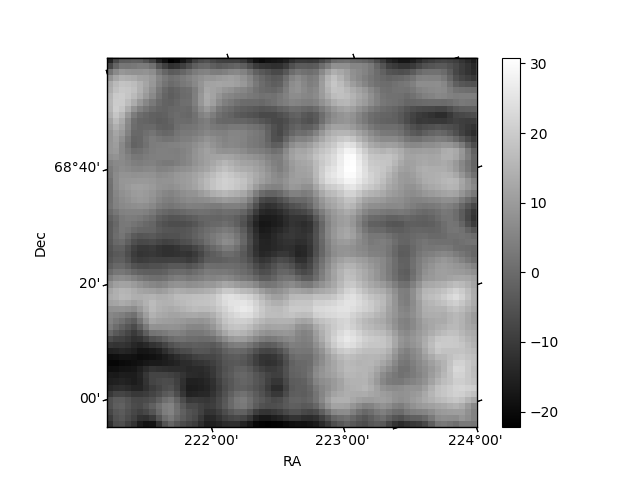
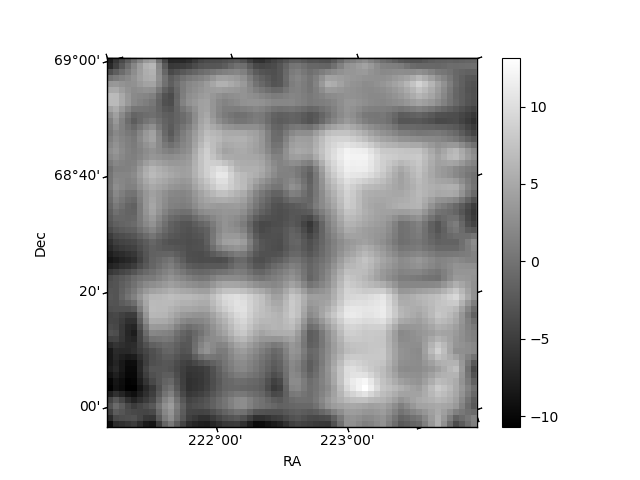
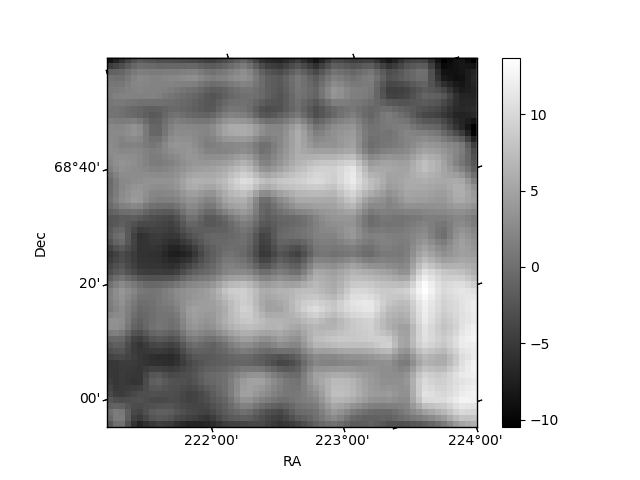
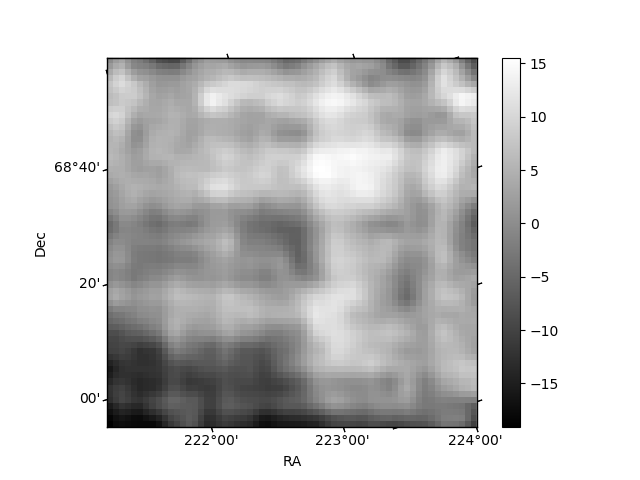
Histogram calculated using DETX and DETY for each event in the final _common_clean file
| Quadrant A | 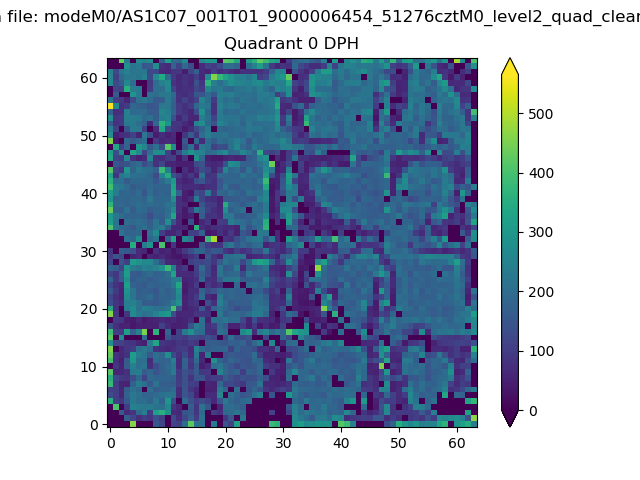 |
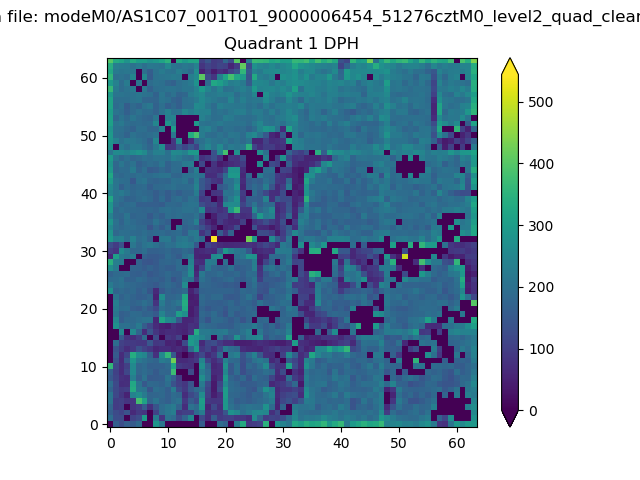 |
Quadrant B |
|---|---|---|---|
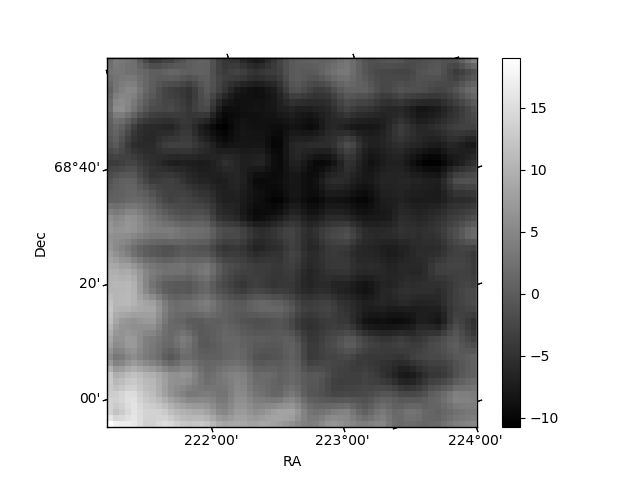
| Quadrant D | 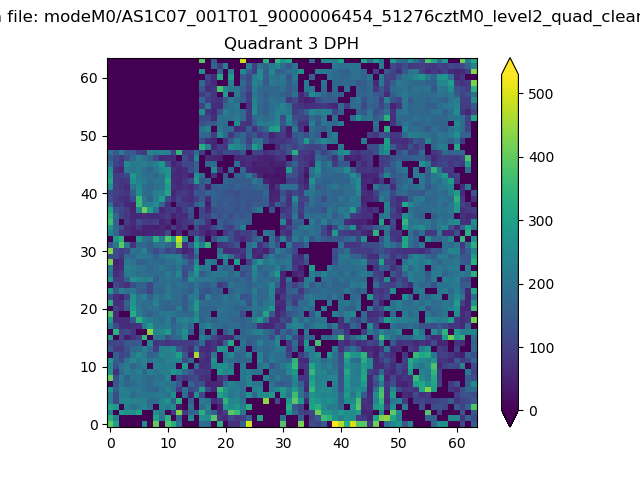 |
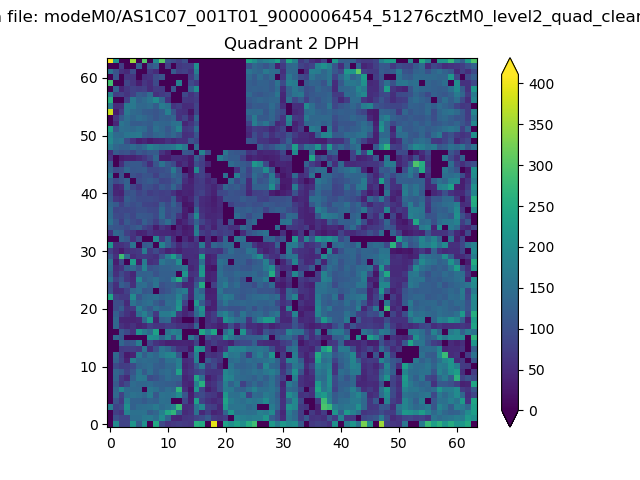 |
Quadrant C |
| Plot type | Count rate plots | Images |
|---|---|---|
| Comparison with Poisson distribution Blue bars denote a histogram of data divided into 1 sec bins. Red curve is a Poisson curve with rate = median count rate of data. |
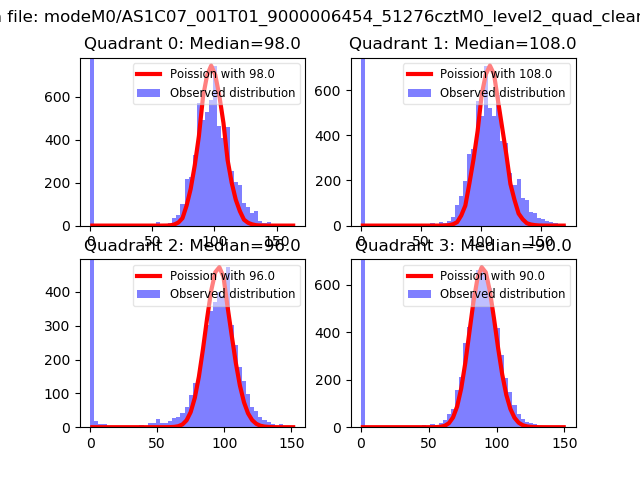 |
 |
| Quadrant-wise count rates Data is divided into 100 sec bins |
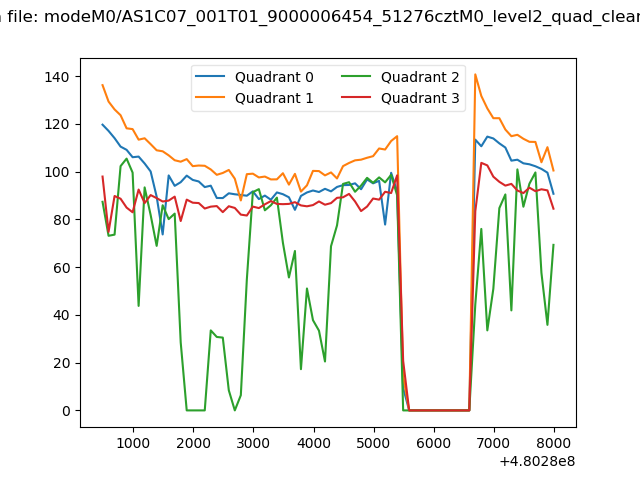 |
|
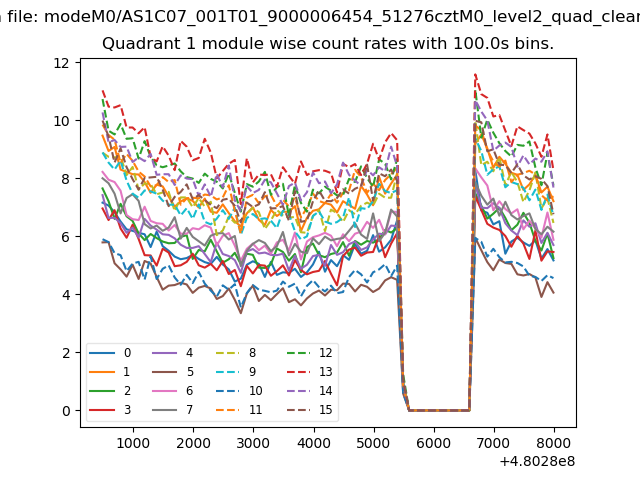
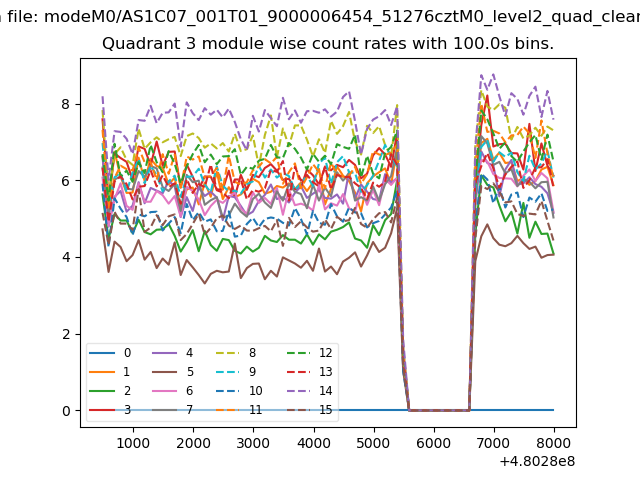
| Module-wise count rates for Quadrant A Data is divided into 100 sec bins |
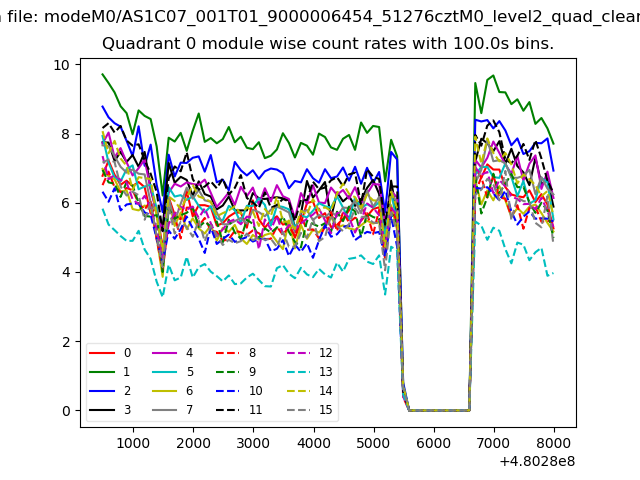 |
 |
| Module-wise count rates for Quadrant B Data is divided into 100 sec bins |
 |
 |
| Module-wise count rates for Quadrant C Data is divided into 100 sec bins |
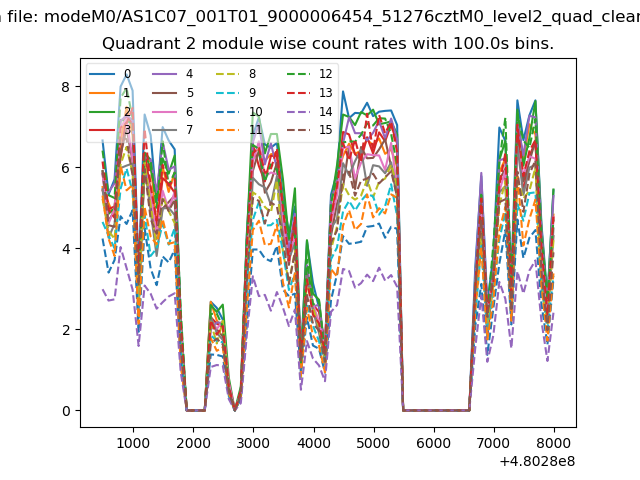 |
 |
| Module-wise count rates for Quadrant D Data is divided into 100 sec bins |
 |
 |
| Parameter | Plot |
|---|---|
| CZT HV Monitor | 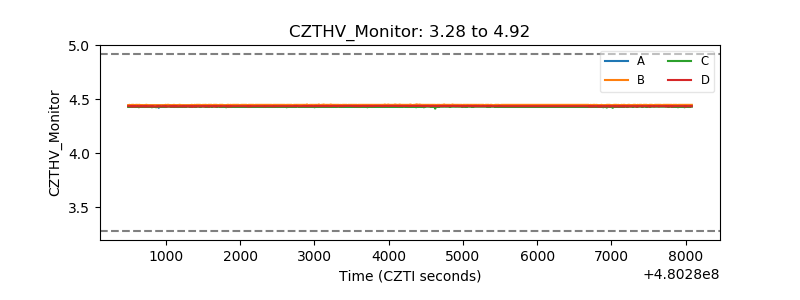 |
| D_VDD | 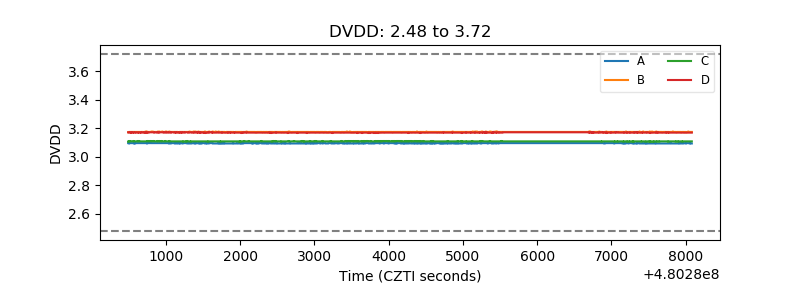 |
| Temperature 1 | 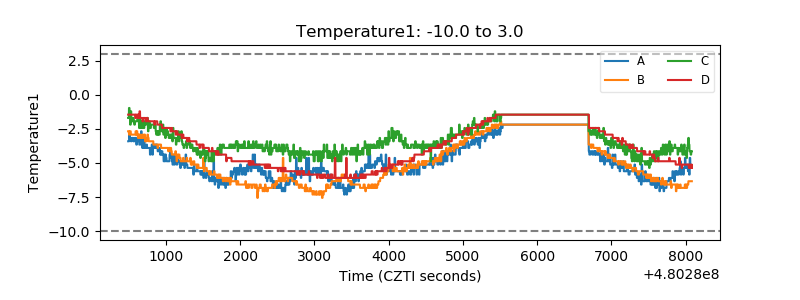 |
| Veto HV Monitor | 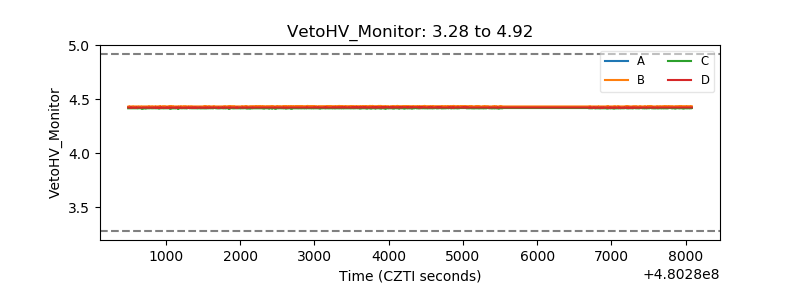 |
| Veto LLD | 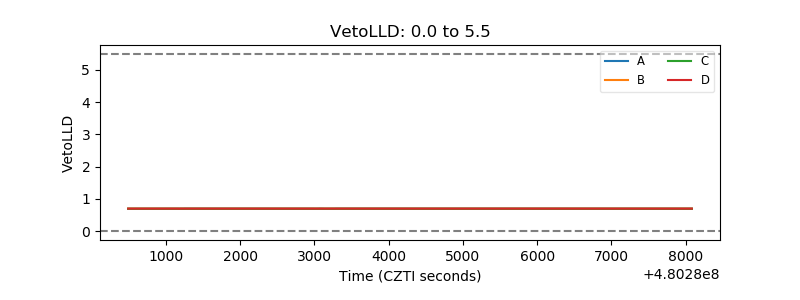 |
| Alpha Counter | 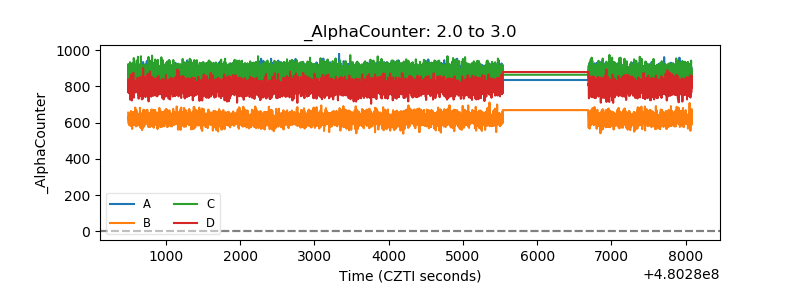 |
| _CPM_Rate | 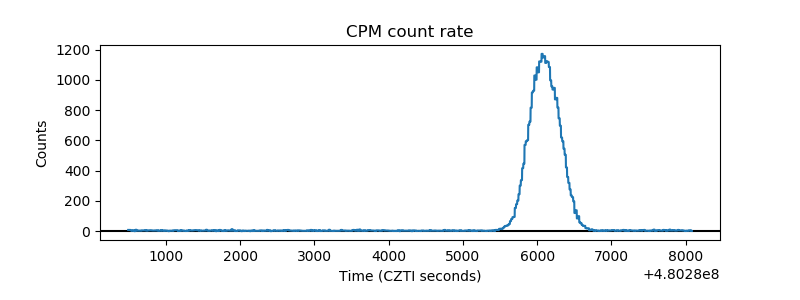 |
| CZT Counter | 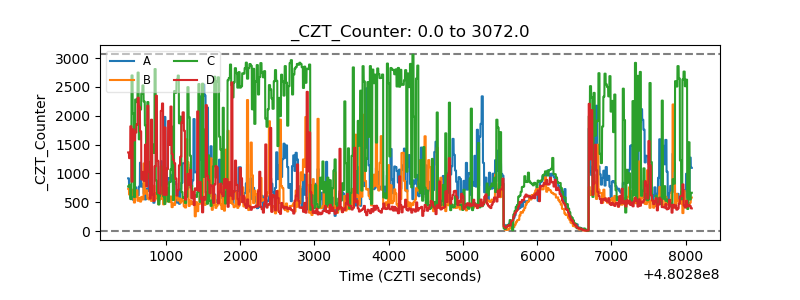 |
| +2.5 Volts monitor | 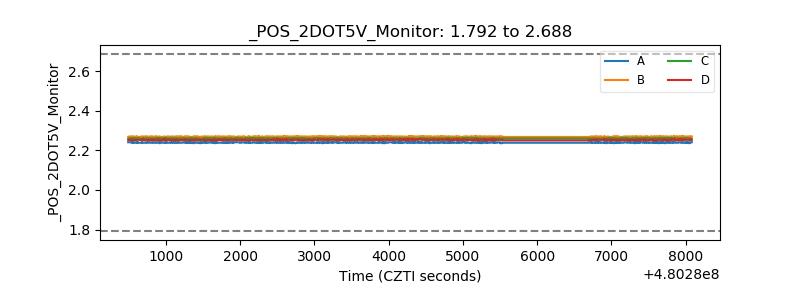 |
| +5 Volts monitor | 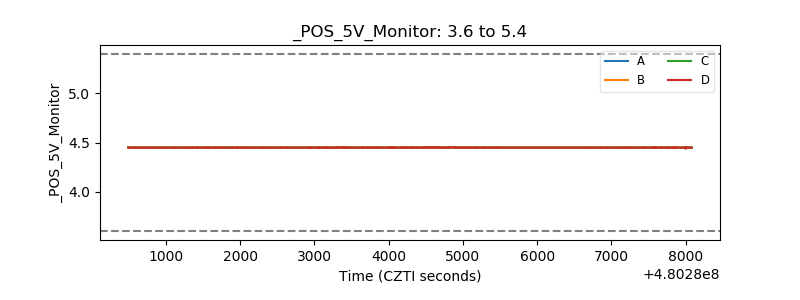 |
| _ROLL_ROT | 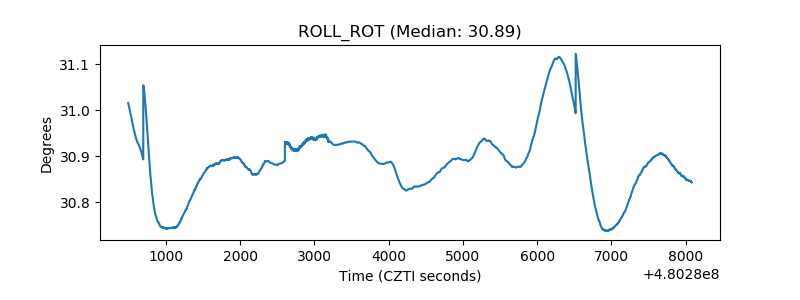 |
| _Roll_DEC | 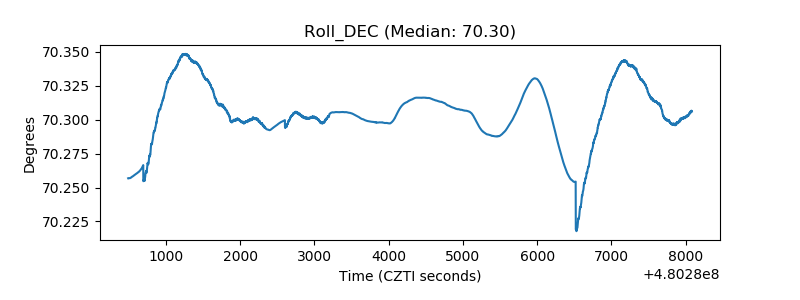 |
| _Roll_RA | 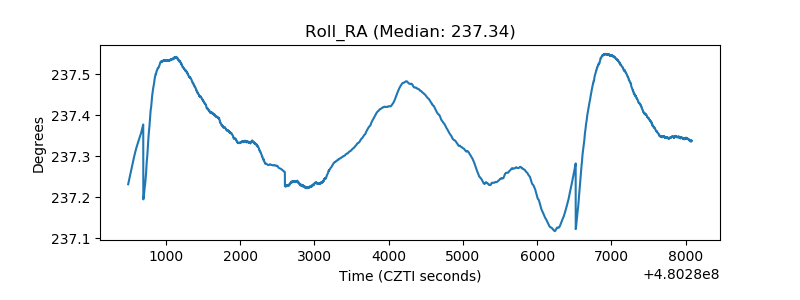 |
| Veto Counter | 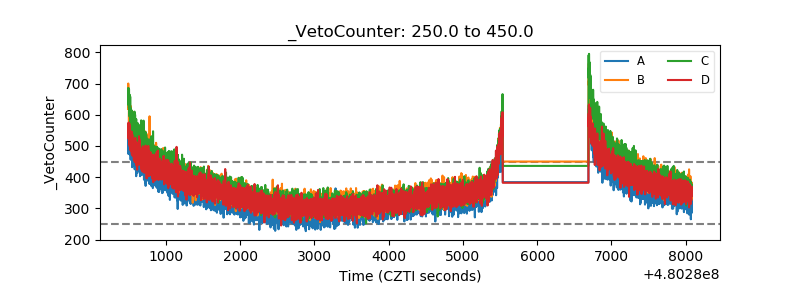 |