| Param | Original file | Final file |
|---|---|---|
| Filename | modeM0/AS1C07_001T01_9000006454_51277cztM0_level2.fits | modeM0/AS1C07_001T01_9000006454_51277cztM0_level2_quad_clean.evt |
| Size (bytes) | 665,389,440 | 94,176,000 |
| Size | 634.6 MB | 89.8 MB |
| Events in quadrant A | 6,492,001 | 635,046 |
| Events in quadrant B | 3,693,225 | 722,101 |
| Events in quadrant C | 9,935,350 | 431,627 |
| Events in quadrant D | 3,992,617 | 597,053 |
| Mode M0 | |||
|---|---|---|---|
| Quadrant | BADHDUFLAG | Total packets | Discarded packets |
| A | 0 | 24015 | 2 |
| B | 0 | 15624 | 2 |
| C | 0 | 34142 | 3 |
| D | 0 | 16609 | 2 |
| Mode SS | |||
|---|---|---|---|
| Quadrant | BADHDUFLAG | Total packets | Discarded packets |
| A | 0 | 138 | 0 |
| B | 0 | 138 | 0 |
| C | 0 | 138 | 0 |
| D | 0 | 138 | 0 |
| Mode M9 | |||
|---|---|---|---|
| Quadrant | BADHDUFLAG | Total packets | Discarded packets |
| A | 0 | 23 | 0 |
| B | 0 | 23 | 0 |
| C | 0 | 23 | 0 |
| D | 0 | 23 | 0 |
| Quadrant | Total seconds | Saturated seconds | Saturation percentage |
|---|---|---|---|
| A | 6678 | 356 | 5.330937% |
| B | 6679 | 171 | 2.560264% |
| C | 6678 | 2559 | 38.319856% |
| D | 6678 | 203 | 3.039832% |
Noise dominated data is calculated using 1-second bins in cleaned event files. If a bin has >2000 counts, and if more than 50% of those come from <1% of pixels, then it is considered to be noise-dominated and hence unusable.
| Quadrant | # 1 sec bins | Bins with >0 counts | Bins with >2000 counts | High rate bins dominated by noise | Noise dominated (total time) | Noise dominated (detector-on time) | Marked lightcurve |
|---|---|---|---|---|---|---|---|
| A | 9008 | 6678 | 110 | 110 | 1.22% | 1.65% | 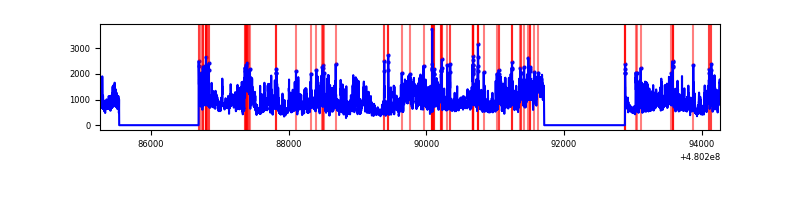 |
| B | 9009 | 6680 | 41 | 41 | 0.46% | 0.61% | 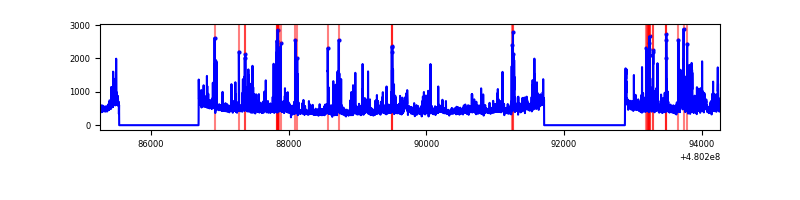 |
| C | 9008 | 6678 | 2456 | 2456 | 27.26% | 36.78% | 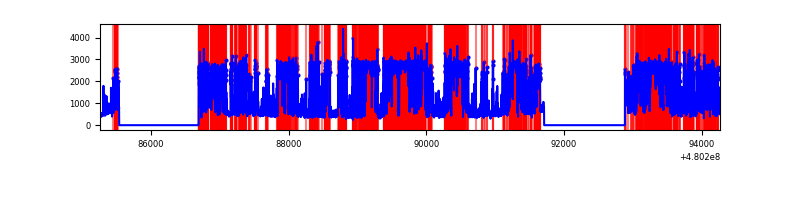 |
| D | 9008 | 6679 | 138 | 138 | 1.53% | 2.07% | 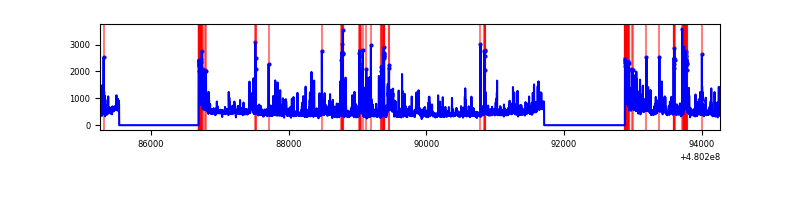 |
Top three noisy pixels from each quadrant. If the there are fewer than three noisy pixels in the level2.evt file, extra rows are filled as -1
| Pixel properties | Quadrant properties | ||||||
|---|---|---|---|---|---|---|---|
| Quadrant | DetID | PixID | Counts | Sigma | Mean | Median | Sigma |
| A | 12 | 3 | 2224989 | 12647.58 | 709 | 690 | 175.9 |
| A | 8 | 10 | 396956 | 2253.21 | 709 | 690 | 175.9 |
| A | 9 | 160 | 343635 | 1950.02 | 709 | 690 | 175.9 |
| B | 5 | 185 | 166545 | 1097.35 | 721 | 695 | 151.1 |
| B | 8 | 128 | 147760 | 973.06 | 721 | 695 | 151.1 |
| B | 10 | 247 | 131304 | 864.18 | 721 | 695 | 151.1 |
| C | 4 | 12 | 6678514 | 43461.85 | 555 | 549 | 153.7 |
| C | 10 | 171 | 539186 | 3505.58 | 555 | 549 | 153.7 |
| C | 1 | 45 | 154807 | 1003.95 | 555 | 549 | 153.7 |
| D | 8 | 176 | 401714 | 2094.29 | 692 | 670 | 191.5 |
| D | 3 | 12 | 206217 | 1073.38 | 692 | 670 | 191.5 |
| D | 6 | 42 | 190859 | 993.18 | 692 | 670 | 191.5 |
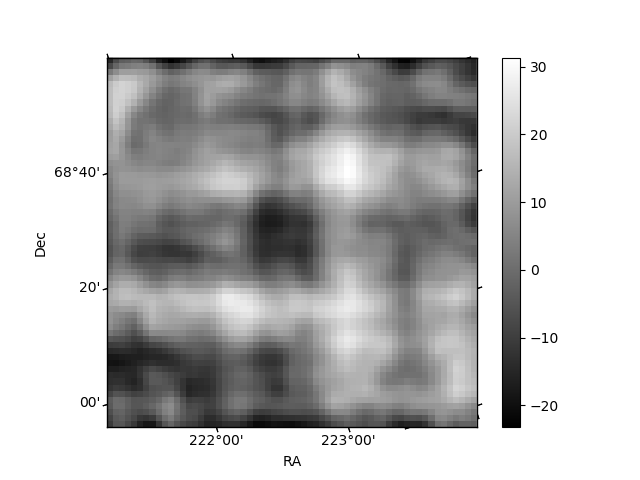
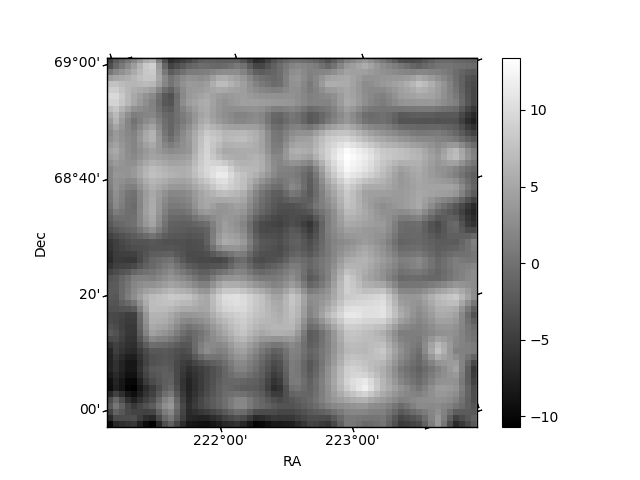
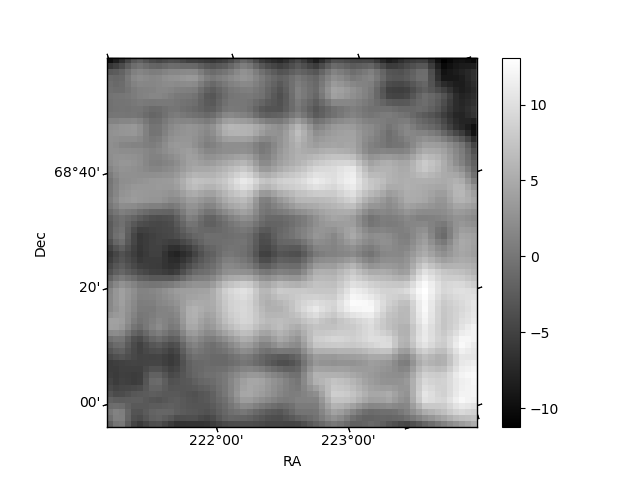
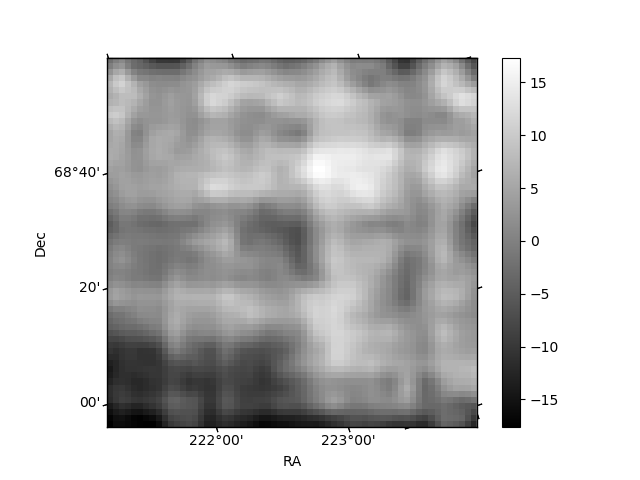
Histogram calculated using DETX and DETY for each event in the final _common_clean file
| Quadrant A | 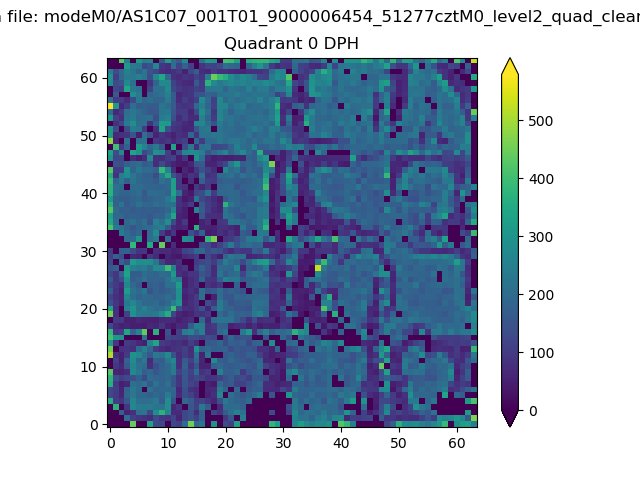 |
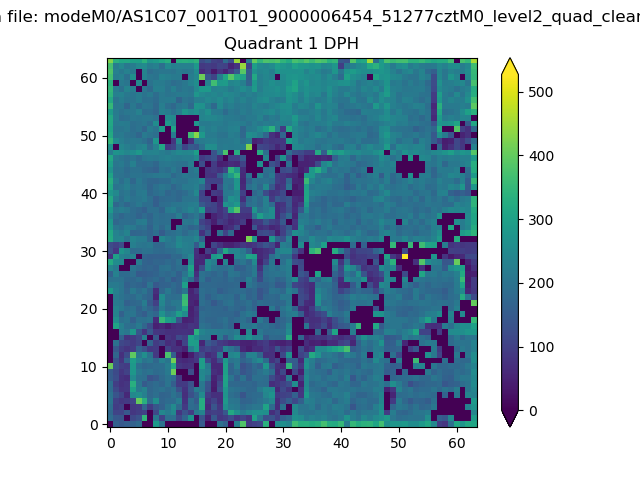 |
Quadrant B |
|---|---|---|---|
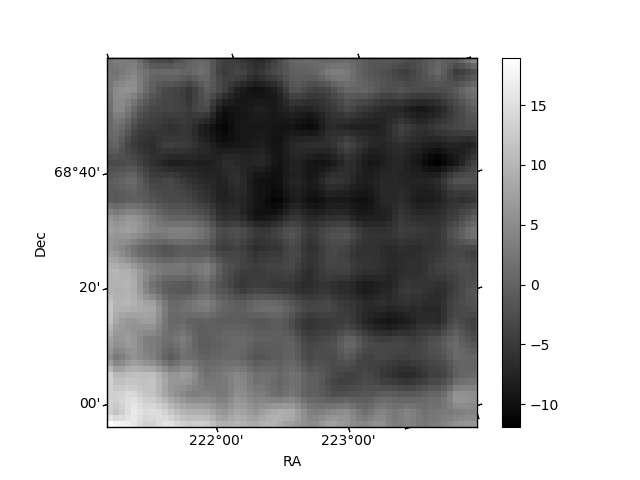
| Quadrant D | 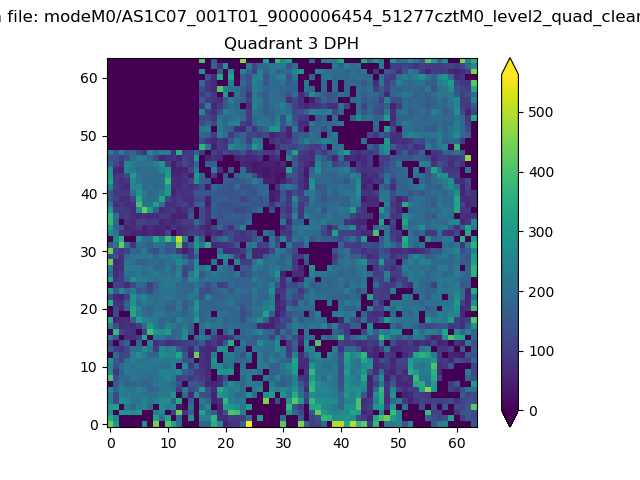 |
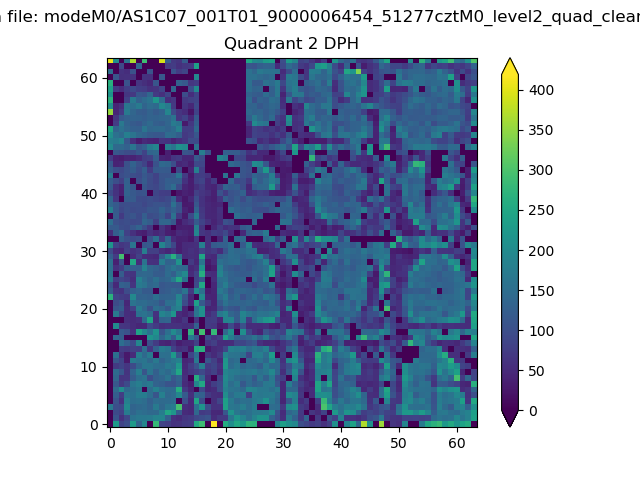 |
Quadrant C |
| Plot type | Count rate plots | Images |
|---|---|---|
| Comparison with Poisson distribution Blue bars denote a histogram of data divided into 1 sec bins. Red curve is a Poisson curve with rate = median count rate of data. |
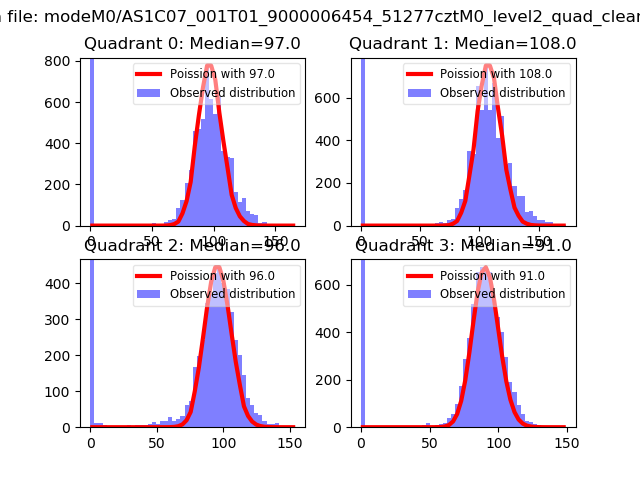 |
 |
| Quadrant-wise count rates Data is divided into 100 sec bins |
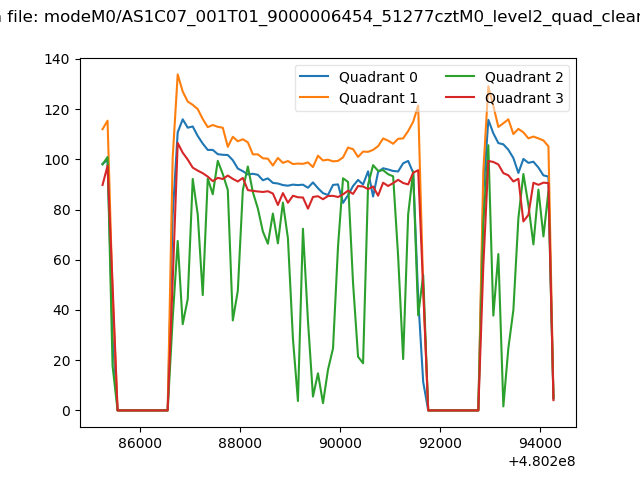 |
|
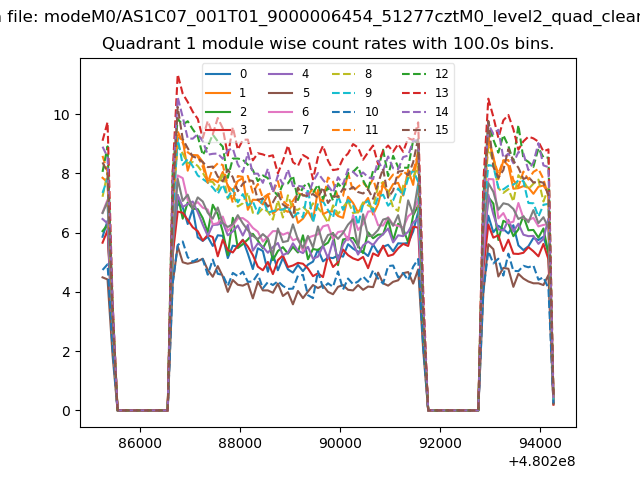
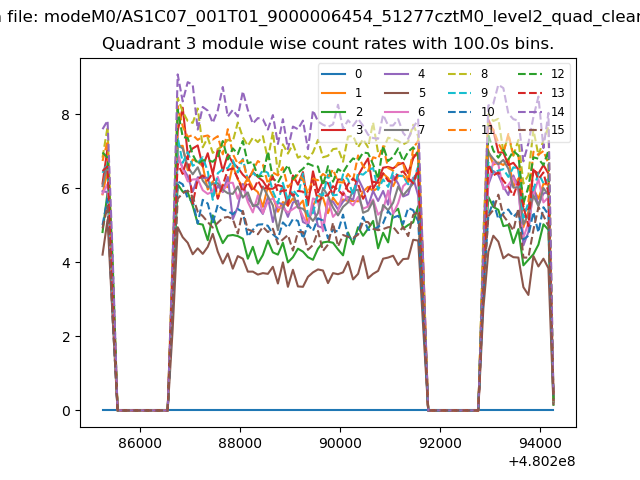
| Module-wise count rates for Quadrant A Data is divided into 100 sec bins |
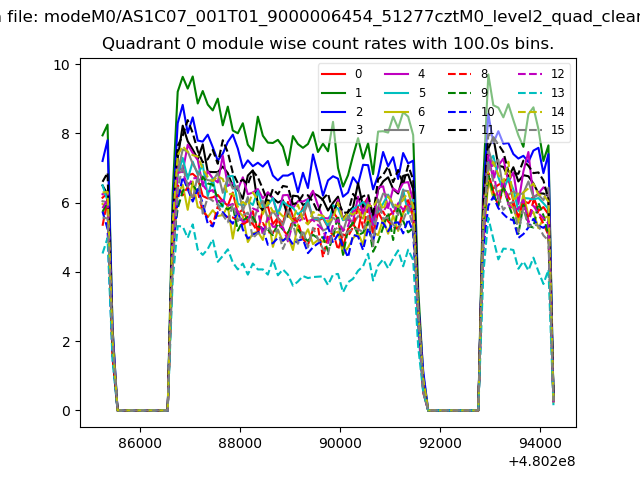 |
 |
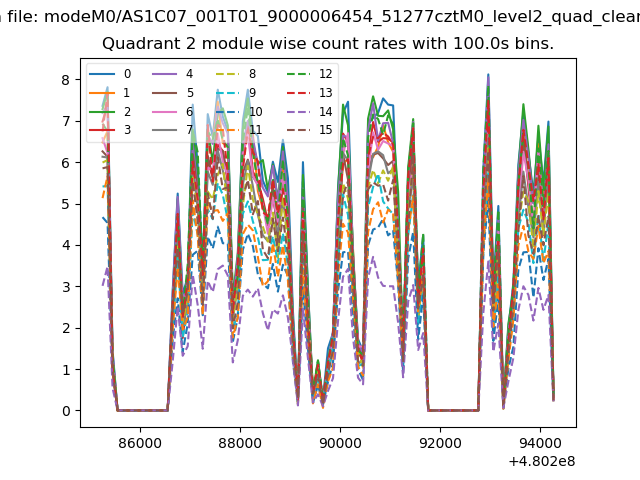
| Module-wise count rates for Quadrant B Data is divided into 100 sec bins |
 |
 |
| Module-wise count rates for Quadrant C Data is divided into 100 sec bins |
 |
 |
| Module-wise count rates for Quadrant D Data is divided into 100 sec bins |
 |
 |
| Parameter | Plot |
|---|---|
| CZT HV Monitor | 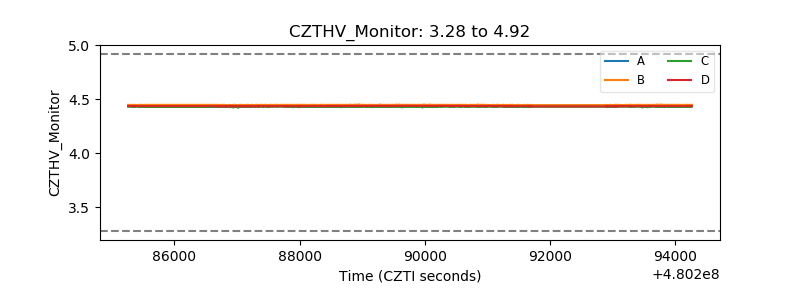 |
| D_VDD | 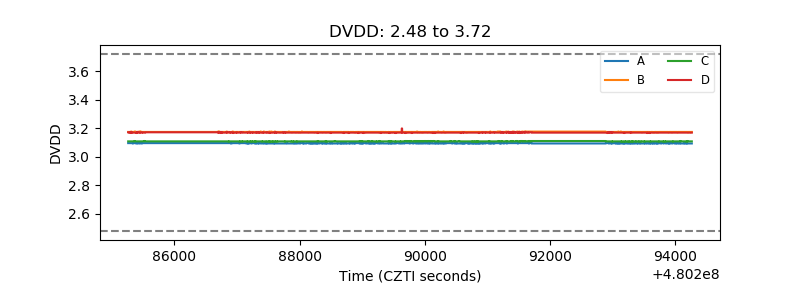 |
| Temperature 1 | 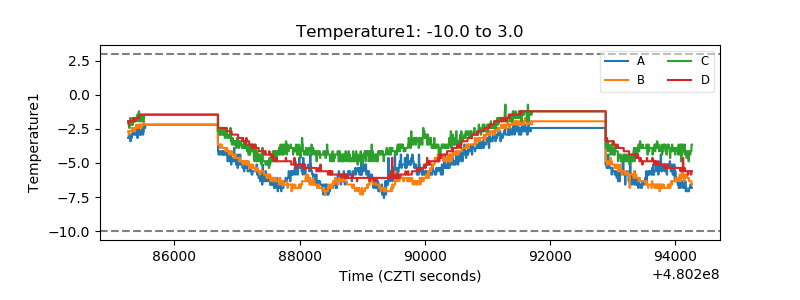 |
| Veto HV Monitor | 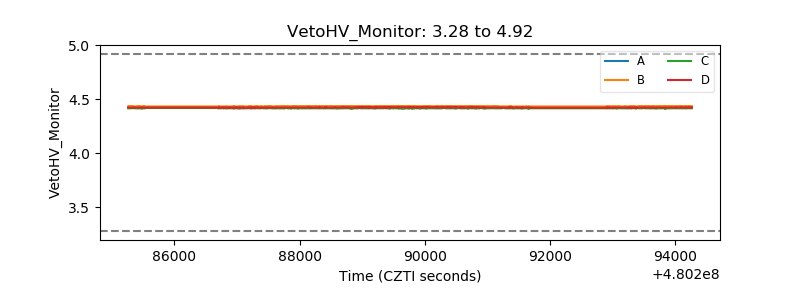 |
| Veto LLD | 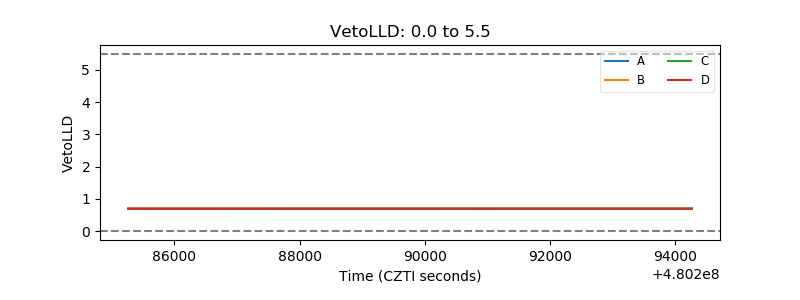 |
| Alpha Counter | 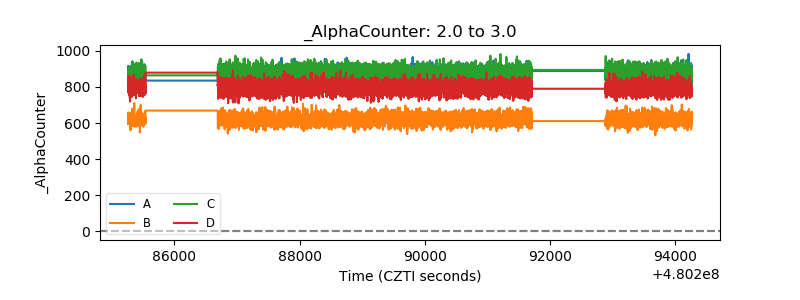 |
| _CPM_Rate | 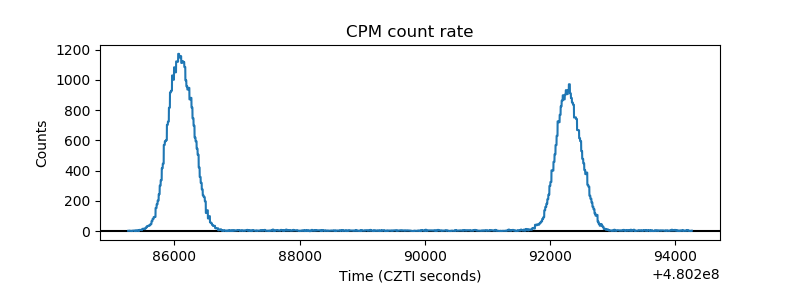 |
| CZT Counter | 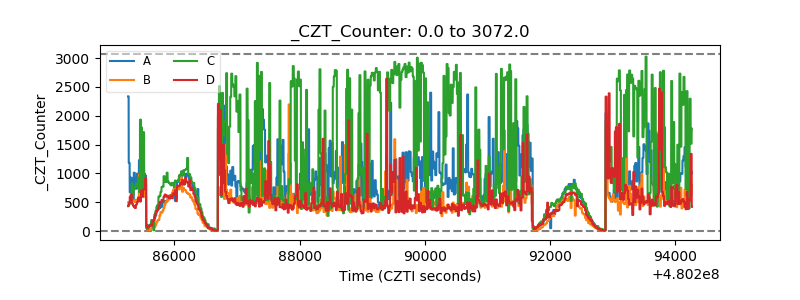 |
| +2.5 Volts monitor | 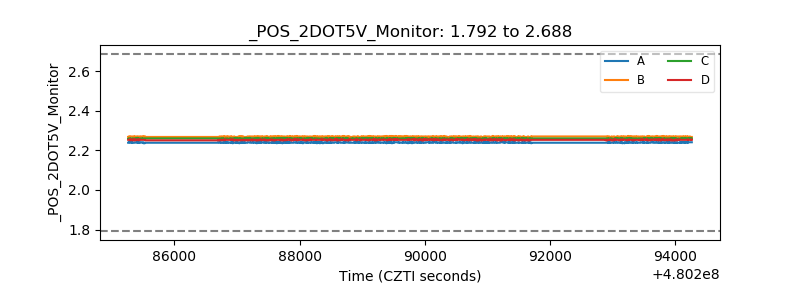 |
| +5 Volts monitor | 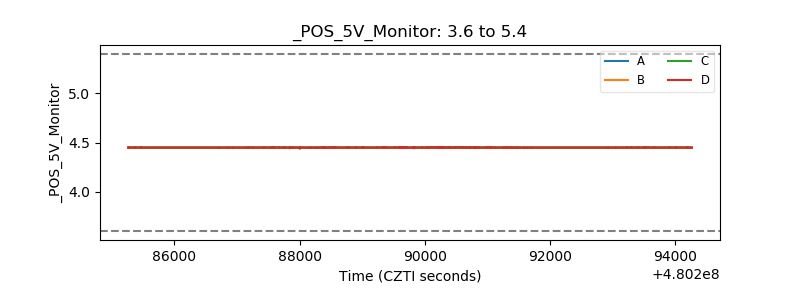 |
| _ROLL_ROT | 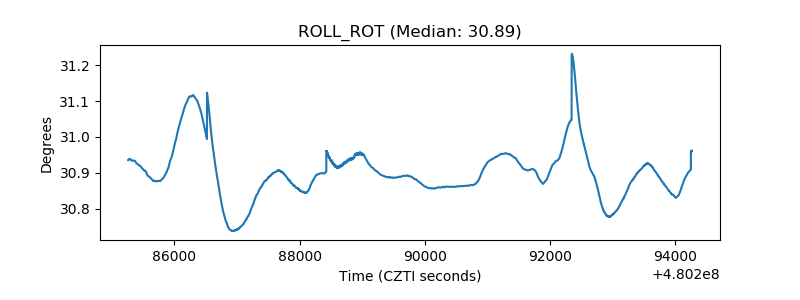 |
| _Roll_DEC | 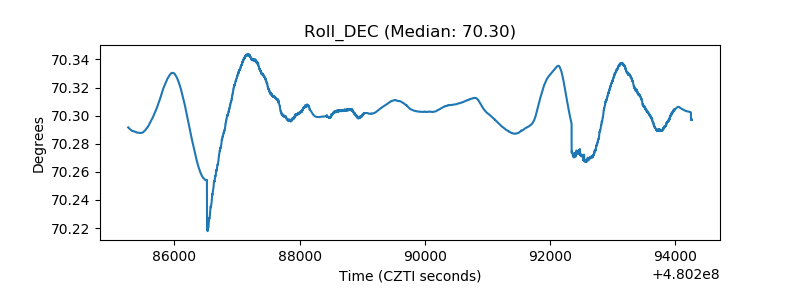 |
| _Roll_RA | 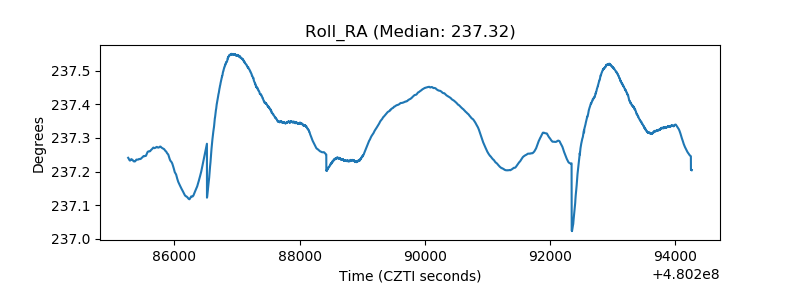 |
| Veto Counter | 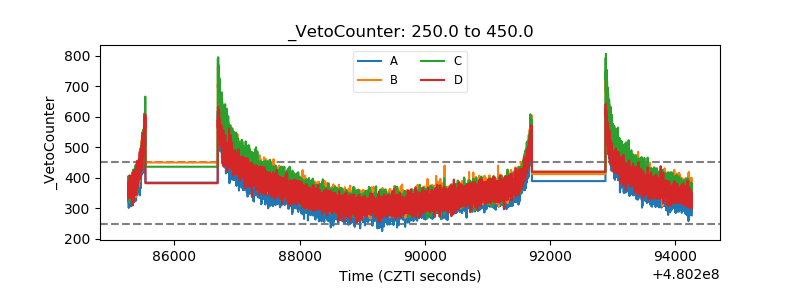 |