| Param | Original file | Final file |
|---|---|---|
| Filename | modeM0/AS1C07_001T01_9000006454_51278cztM0_level2.fits | modeM0/AS1C07_001T01_9000006454_51278cztM0_level2_quad_clean.evt |
| Size (bytes) | 719,282,880 | 87,140,160 |
| Size | 686.0 MB | 83.1 MB |
| Events in quadrant A | 5,789,119 | 608,060 |
| Events in quadrant B | 4,438,369 | 669,519 |
| Events in quadrant C | 11,728,585 | 358,609 |
| Events in quadrant D | 4,175,488 | 555,860 |
| Mode M0 | |||
|---|---|---|---|
| Quadrant | BADHDUFLAG | Total packets | Discarded packets |
| A | 0 | 21710 | 2 |
| B | 0 | 17581 | 2 |
| C | 0 | 39251 | 2 |
| D | 0 | 16973 | 2 |
| Mode SS | |||
|---|---|---|---|
| Quadrant | BADHDUFLAG | Total packets | Discarded packets |
| A | 0 | 132 | 0 |
| B | 0 | 132 | 0 |
| C | 0 | 132 | 0 |
| D | 0 | 132 | 0 |
| Mode M9 | |||
|---|---|---|---|
| Quadrant | BADHDUFLAG | Total packets | Discarded packets |
| A | 0 | 17 | 0 |
| B | 0 | 18 | 0 |
| C | 0 | 18 | 0 |
| D | 0 | 18 | 0 |
| Quadrant | Total seconds | Saturated seconds | Saturation percentage |
|---|---|---|---|
| A | 6390 | 168 | 2.629108% |
| B | 6390 | 228 | 3.568075% |
| C | 6389 | 2979 | 46.627015% |
| D | 6389 | 245 | 3.834716% |
Noise dominated data is calculated using 1-second bins in cleaned event files. If a bin has >2000 counts, and if more than 50% of those come from <1% of pixels, then it is considered to be noise-dominated and hence unusable.
| Quadrant | # 1 sec bins | Bins with >0 counts | Bins with >2000 counts | High rate bins dominated by noise | Noise dominated (total time) | Noise dominated (detector-on time) | Marked lightcurve |
|---|---|---|---|---|---|---|---|
| A | 7560 | 6391 | 108 | 108 | 1.43% | 1.69% | 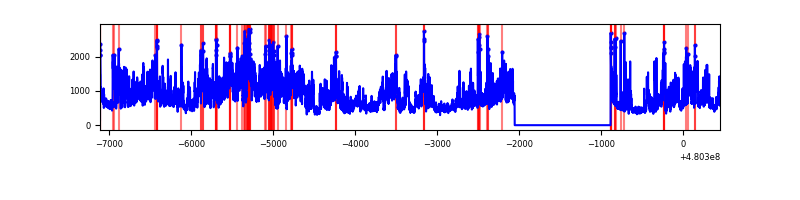 |
| B | 7560 | 6391 | 162 | 162 | 2.14% | 2.53% | 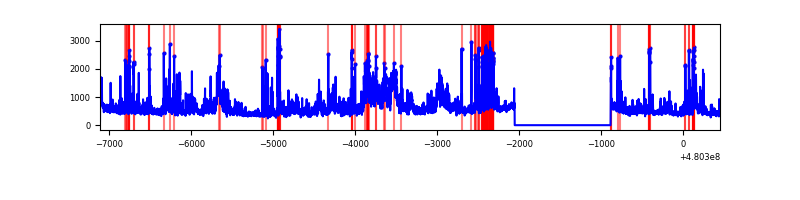 |
| C | 7559 | 6389 | 3112 | 3112 | 41.17% | 48.71% | 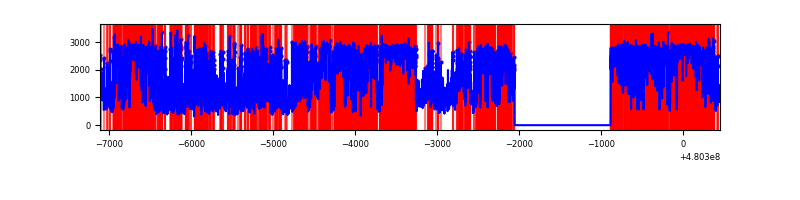 |
| D | 7559 | 6390 | 229 | 229 | 3.03% | 3.58% | 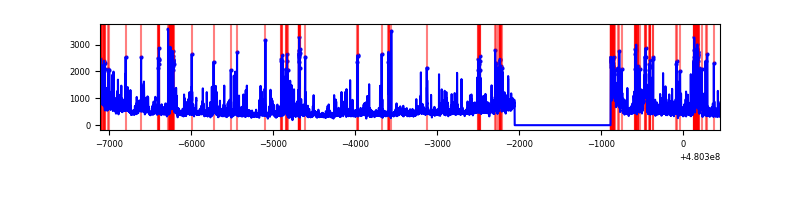 |
Top three noisy pixels from each quadrant. If the there are fewer than three noisy pixels in the level2.evt file, extra rows are filled as -1
| Pixel properties | Quadrant properties | ||||||
|---|---|---|---|---|---|---|---|
| Quadrant | DetID | PixID | Counts | Sigma | Mean | Median | Sigma |
| A | 12 | 3 | 2182574 | 13185.25 | 660 | 645 | 165.5 |
| A | 9 | 160 | 293349 | 1768.79 | 660 | 645 | 165.5 |
| A | 12 | 194 | 252440 | 1521.58 | 660 | 645 | 165.5 |
| B | 10 | 254 | 882729 | 6329.34 | 662 | 640 | 139.4 |
| B | 5 | 185 | 536209 | 3842.92 | 662 | 640 | 139.4 |
| B | 7 | 252 | 70114 | 498.5 | 662 | 640 | 139.4 |
| C | 4 | 12 | 6418356 | 44677.0 | 515 | 510 | 143.6 |
| C | 10 | 171 | 2707813 | 18846.54 | 515 | 510 | 143.6 |
| C | 1 | 45 | 221081 | 1535.48 | 515 | 510 | 143.6 |
| D | 8 | 176 | 483310 | 2686.87 | 636 | 613 | 179.7 |
| D | 3 | 12 | 390738 | 2171.58 | 636 | 613 | 179.7 |
| D | 12 | 2 | 214854 | 1192.55 | 636 | 613 | 179.7 |
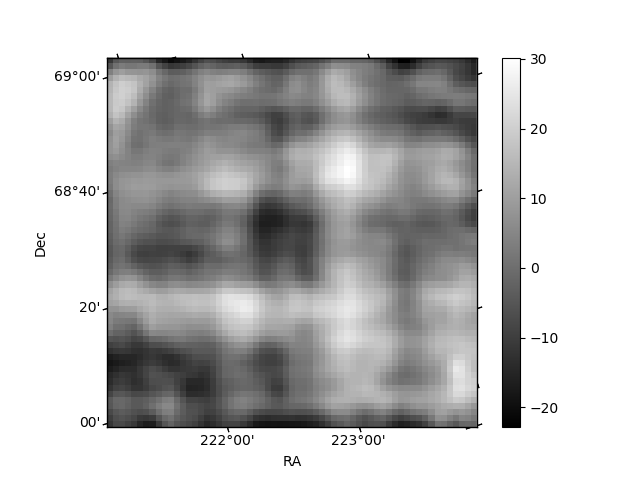
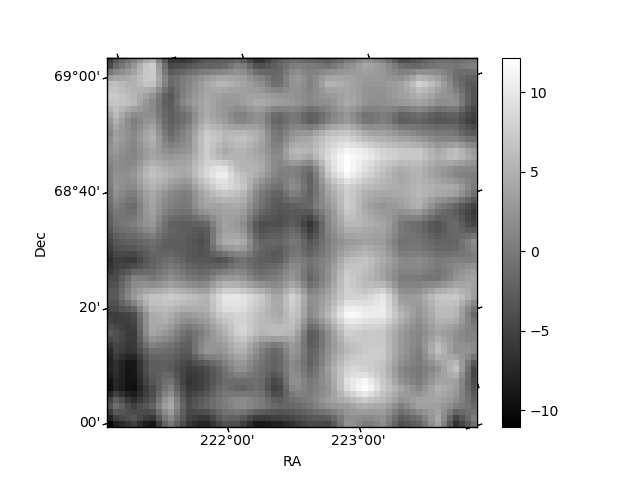
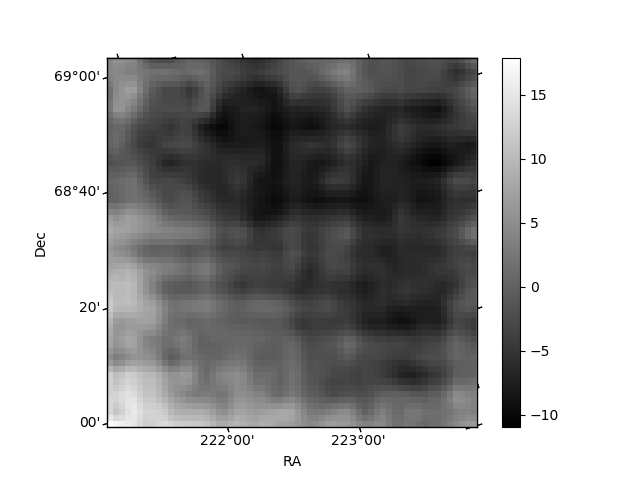
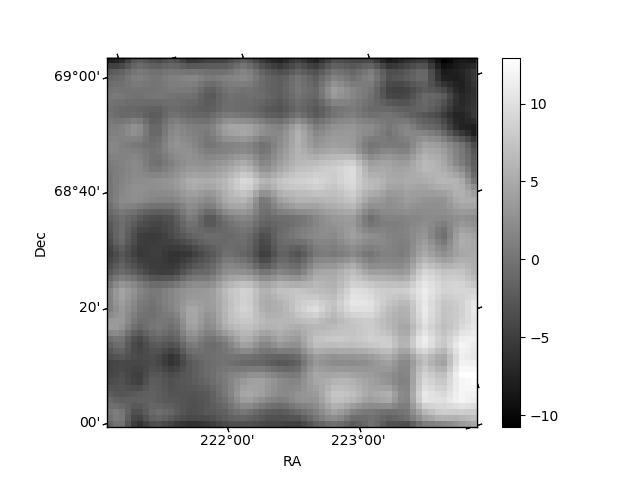
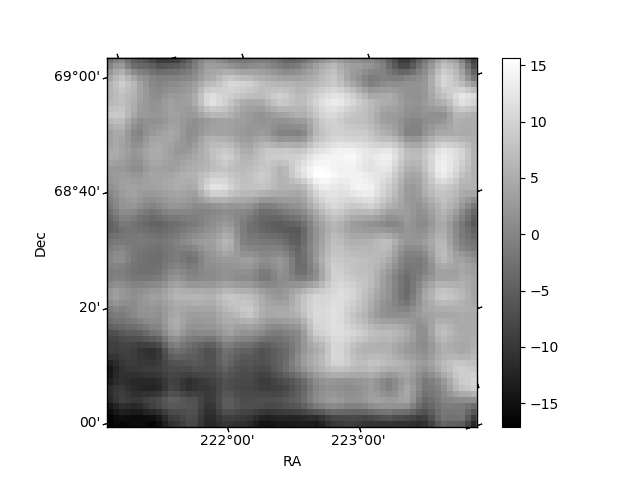
Histogram calculated using DETX and DETY for each event in the final _common_clean file
| Quadrant A | 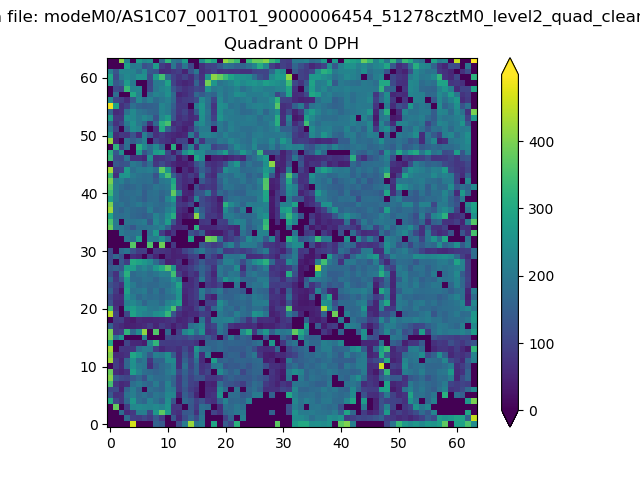 |
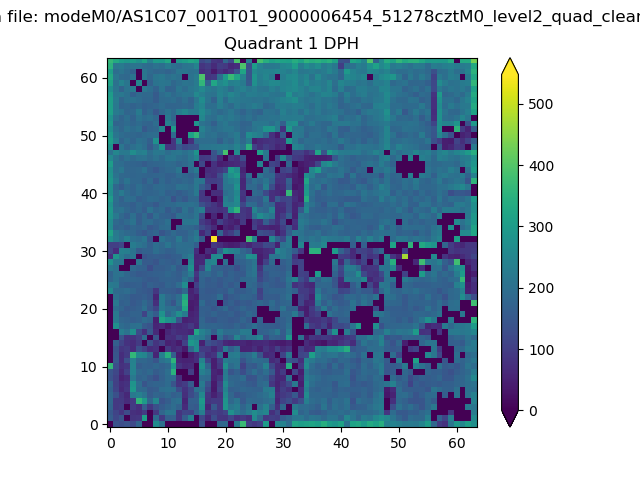 |
Quadrant B |
|---|---|---|---|
| Quadrant D | 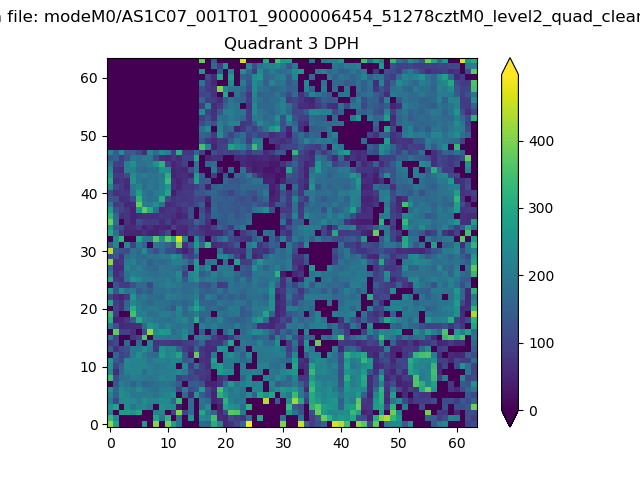 |
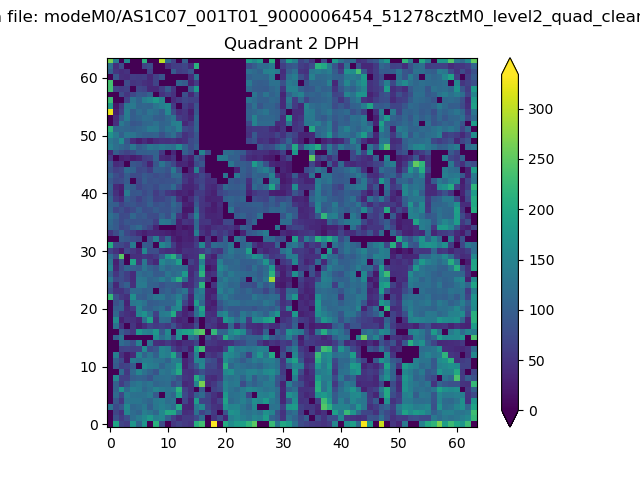 |
Quadrant C |
| Plot type | Count rate plots | Images |
|---|---|---|
| Comparison with Poisson distribution Blue bars denote a histogram of data divided into 1 sec bins. Red curve is a Poisson curve with rate = median count rate of data. |
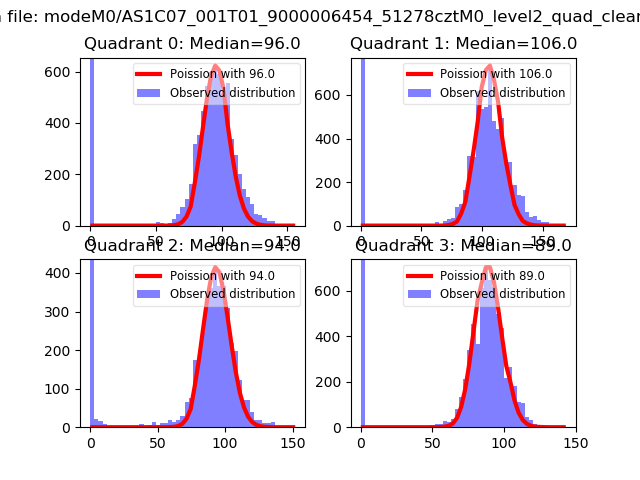 |
 |
| Quadrant-wise count rates Data is divided into 100 sec bins |
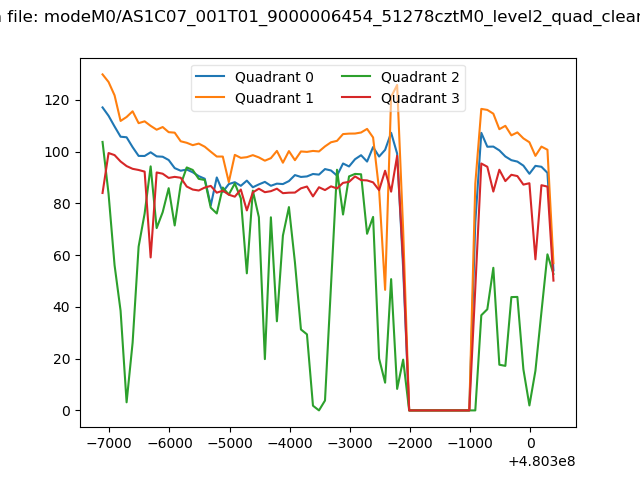 |
|
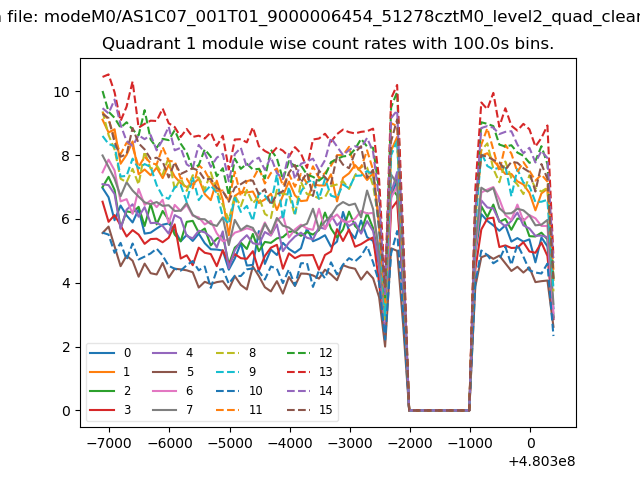
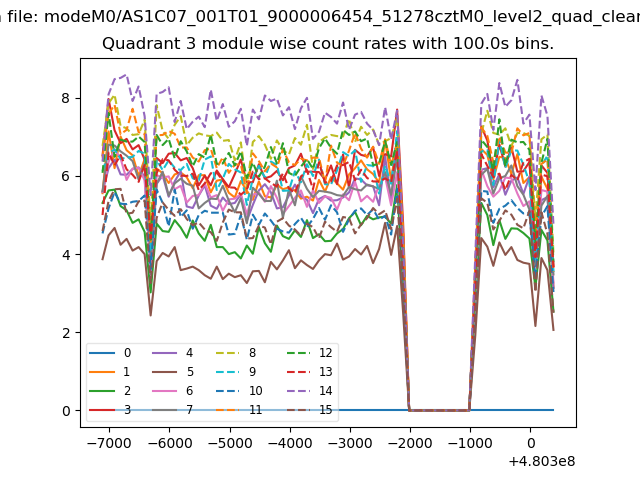
| Module-wise count rates for Quadrant A Data is divided into 100 sec bins |
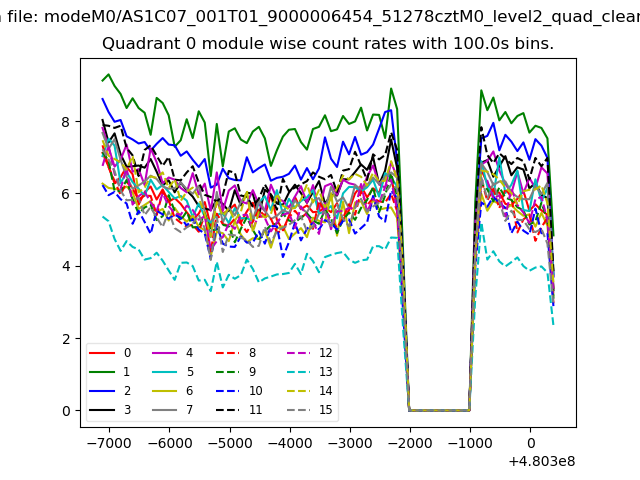 |
 |
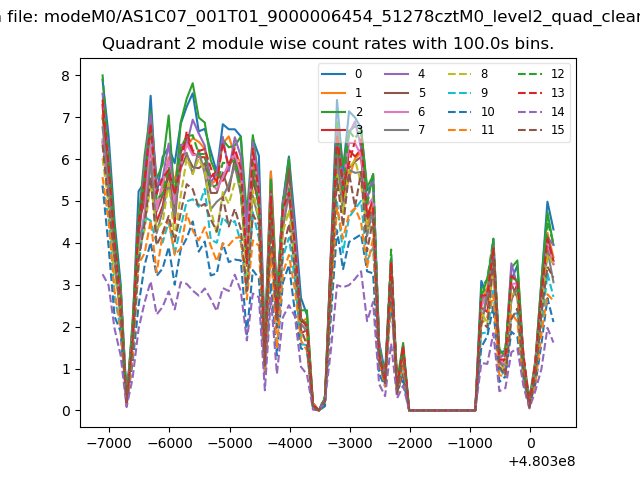
| Module-wise count rates for Quadrant B Data is divided into 100 sec bins |
 |
 |
| Module-wise count rates for Quadrant C Data is divided into 100 sec bins |
 |
 |
| Module-wise count rates for Quadrant D Data is divided into 100 sec bins |
 |
 |
| Parameter | Plot |
|---|---|
| CZT HV Monitor | 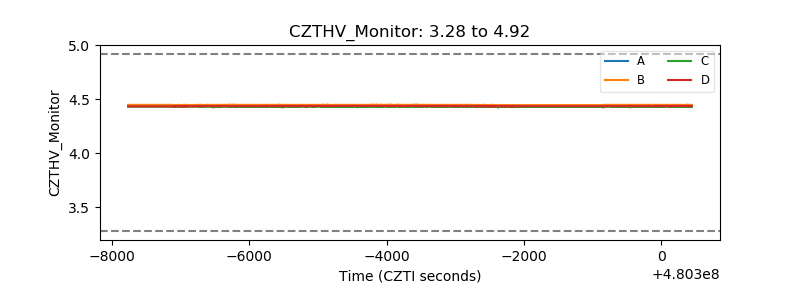 |
| D_VDD | 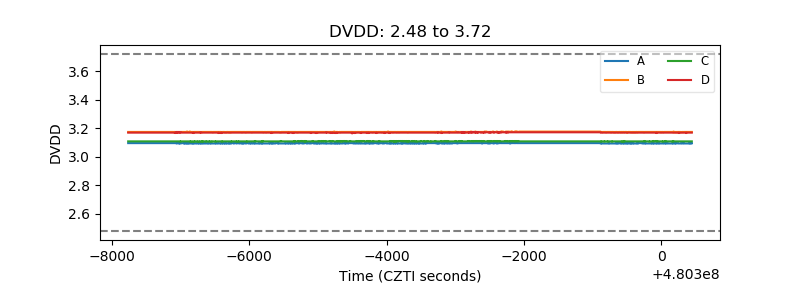 |
| Temperature 1 | 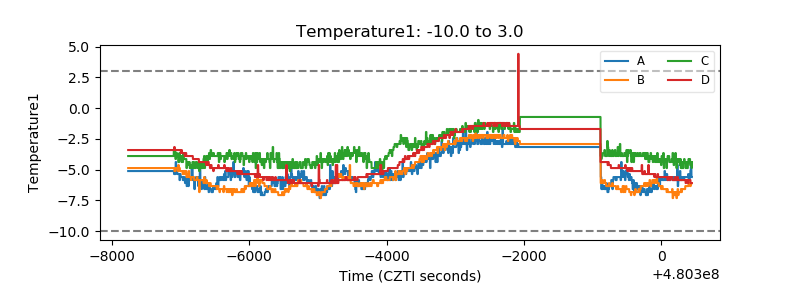 |
| Veto HV Monitor | 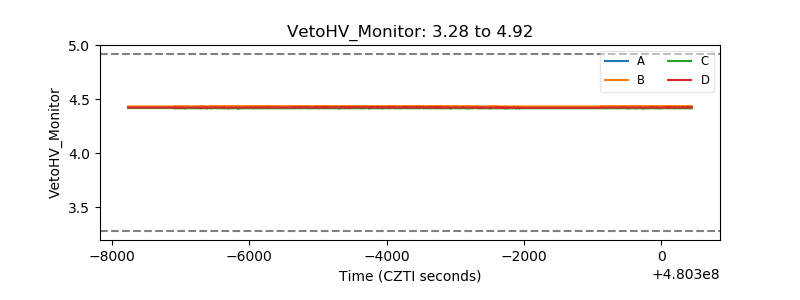 |
| Veto LLD | 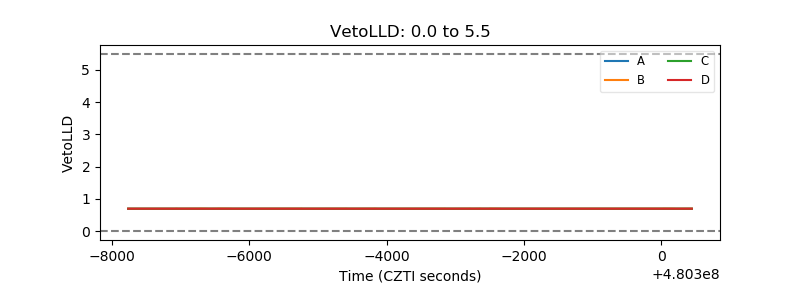 |
| Alpha Counter | 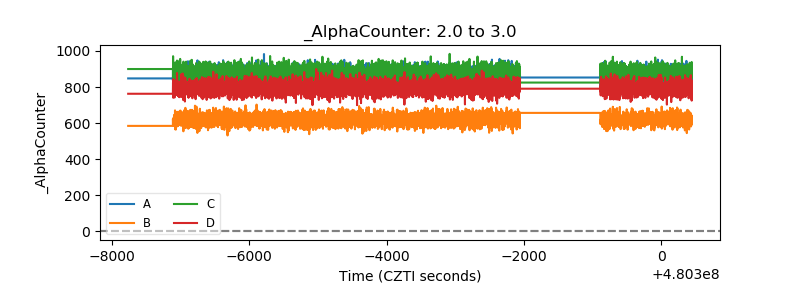 |
| _CPM_Rate | 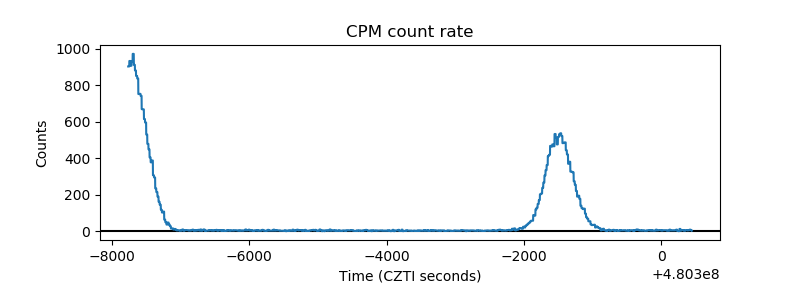 |
| CZT Counter | 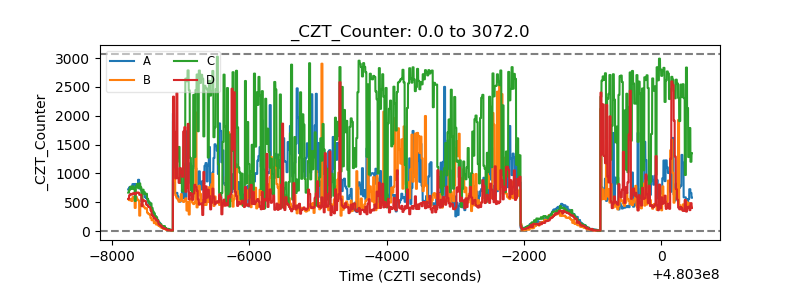 |
| +2.5 Volts monitor | 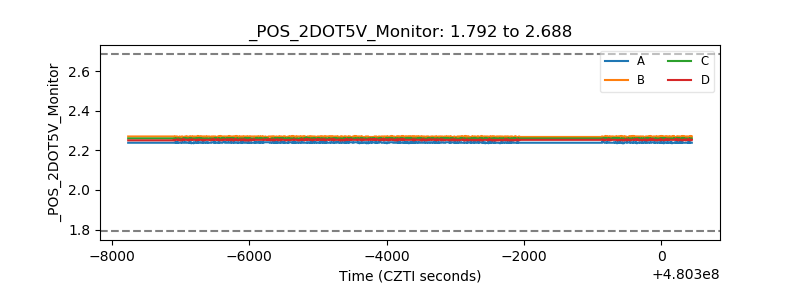 |
| +5 Volts monitor | 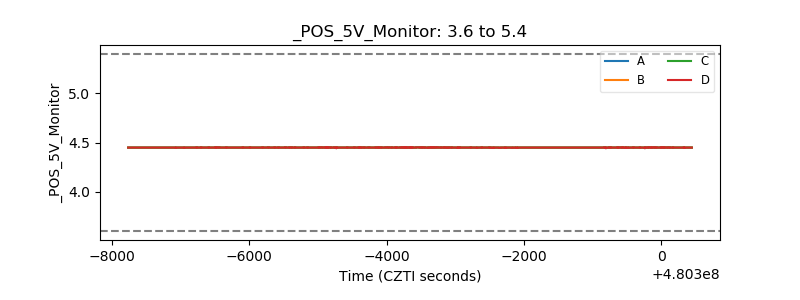 |
| _ROLL_ROT | 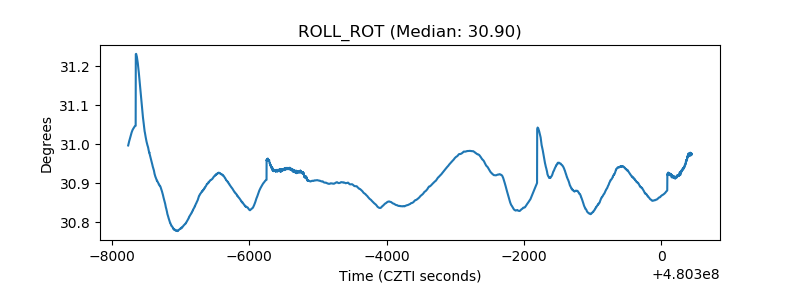 |
| _Roll_DEC | 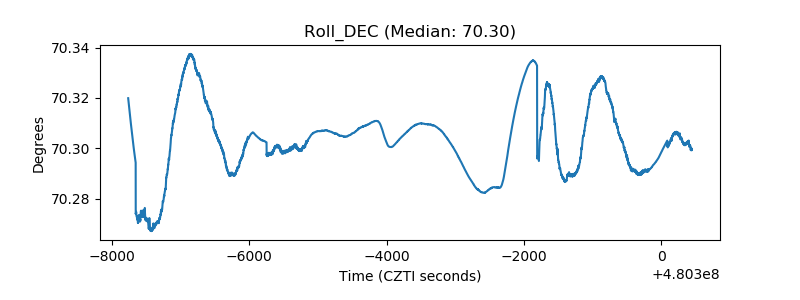 |
| _Roll_RA | 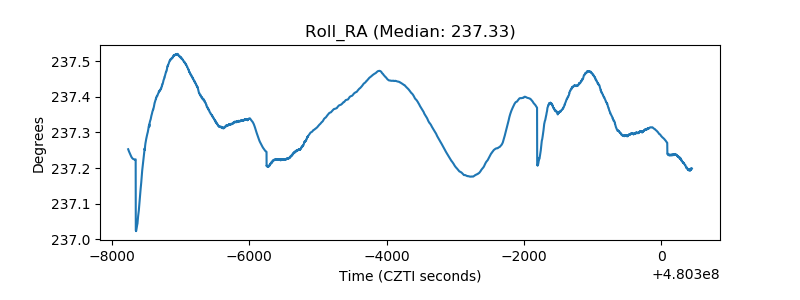 |
| Veto Counter | 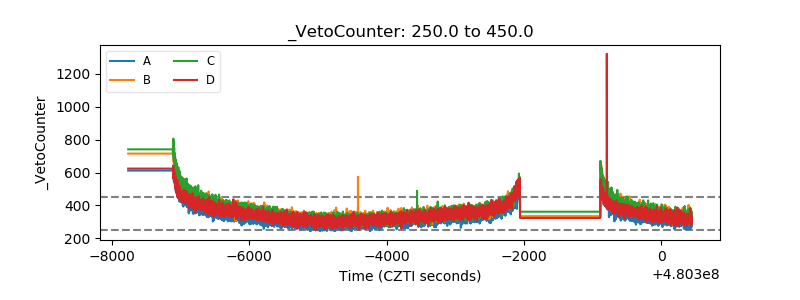 |